Altenheim Family-first Senior Living
Nursing Home, Assisted Living & Independent Living · Indianapolis, IN
CMS overall rating Info CMS (the Centers for Medicare & Medicaid Services) is the federal agency that rates nursing home quality. Its Overall Rating runs from 1 to 5 stars, combining health inspections, staffing, and quality measures, with inspections weighted most heavily.

Altenheim Family-first Senior Living

Nursing Home, Assisted Living & Independent Living · Indianapolis, IN
CMS overall rating Info CMS (the Centers for Medicare & Medicaid Services) is the federal agency that rates nursing home quality. Its Overall Rating runs from 1 to 5 stars, combining health inspections, staffing, and quality measures, with inspections weighted most heavily.
Calculator: See prices in your area
Altenheim Family-first Senior Living accepts Medicare, Medicaid, and private pay.

Overview of Altenheim Family-First Senior Living

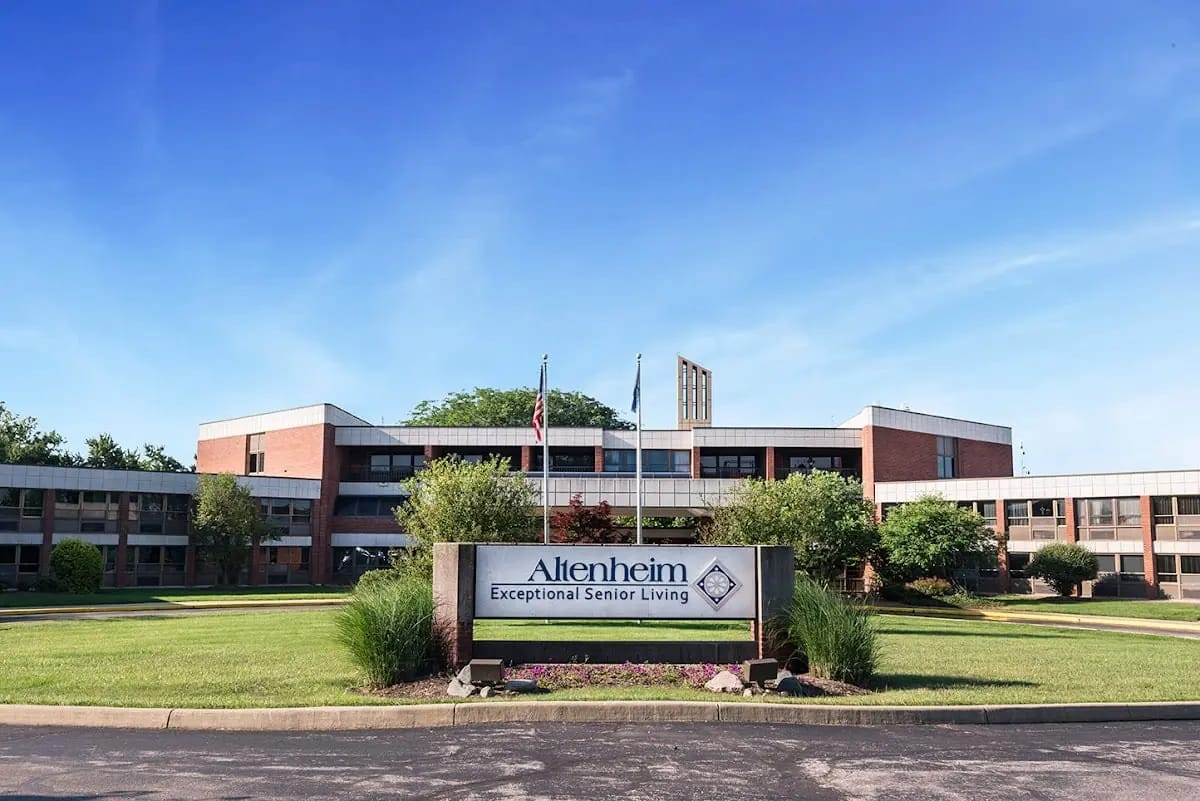
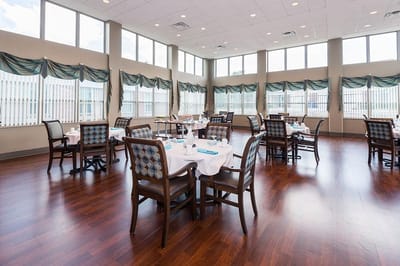
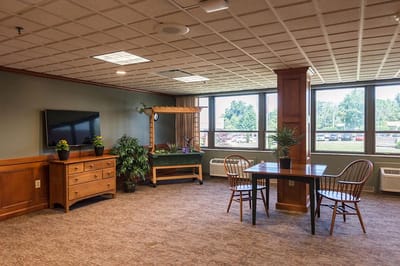
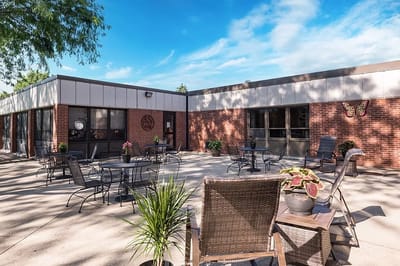
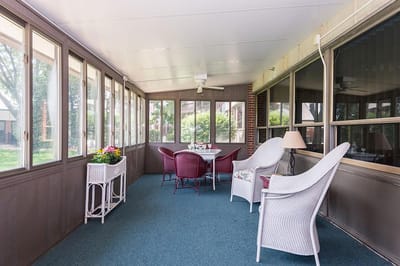
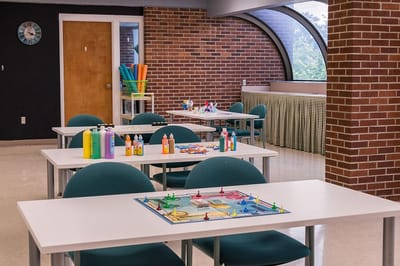
Over 32 acres of friendly and beautiful environment, Altenheim is definitely a nurturing community for families. They offer an array of services as an independent living facility with assisted living and memory care options. They follow a philosophy called Family-first, which dates way back to 1977 when CarDon & Associates was first established. This community group now extends throughout south-central Indiana and has involved all members to prioritize each resident’s personal care. They ensure that residents are able to feel a sense of comfort and joy with their time at the community, as well as opportunities to socialize, enjoy, and learn– considering that it’s a community with a stimulating environment.

Altenheim promotes an oasis-kind of escape found in their own community. The community has a list of services that puts the well-being of residents first– personalized care plan with assessment and development; 24-hour nursing services available everyday; social, cultural, and educational activities and programs. Community amenities and features include emergency response system, paved walking paths, chapel with organ, scheduled transportation, weekly housekeeping and linen services, laundry services, and restaurant-style dining rooms– to name a few of the services they offer to make the lives of each resident hassle-free.

(317) 788-4261

Quality ratings

Measured by Centers for Medicare & Medicaid Services (CMS)

Overall rating Info The Overall CMS Rating combines results from health inspections, staffing levels and quality measures. Health inspections carry the most weight. Staffing and quality scores can increase or decrease the final rating based on performance compared to state and national standards.
▲ 29.7% Above IN avg. ▲ 29.7% Above IN avg.IN average: 3.1Click the badge to see the full State ranking.Click here to see the full State ranking.
Health Inspection Info Based on the results of the facility's three most recent standard inspections and any complaint investigations. CMS reviews the number, scope, and severity of deficiencies, with more recent findings weighted more heavily.
▲ 42.5% Above IN avg. ▲ 42.5% Above IN avg.IN average: 2.8Click the badge to see the full State ranking.Click here to see the full State ranking.
Staffing Info Measures average nursing staff hours per resident per day, including Registered Nurses (RNs) and total nursing staff. Ratings are adjusted based on the level of care residents require and are compared to state and national benchmarks.
▼ 59.3% Below IN avg. ▼ 59.3% Below IN avg.IN average: 2.5Click the badge to see the full State ranking.Click here to see the full State ranking.
Quality Measures Info Based on clinical and physical health indicators reported to CMS, such as hospital readmissions, falls, pressure ulcers, and improvements in mobility. These measures reflect how well residents' health needs are being managed.
▲ 22.3% Above IN avg. ▲ 22.3% Above IN avg.IN average: 4.1Click the badge to see the full State ranking.Click here to see the full State ranking.

Staffing hours breakdown

Info Daily nursing hours per resident by staff type, reported to CMS. Higher is generally better — compare this facility to state and national averages to see where staffing stands.

Hours per resident per day — compared to Indiana state averages

Total nursing care / resident Info This home is ranked 130th out of 291 homes in Indiana for nurse hours. Total adjusted nursing hours per resident per day, combining RN, LPN, and aide time. CMS adjusts this for case-mix so facilities can be fairly compared.
3h 22m per day
Rank #130 / 291Nurse hours — State benchmarkedThis home is ranked 130th out of 291 homes in Indiana. Shows adjusted nurse hours per resident per day benchmarked to the Indiana average, with a ranking across 291 Indiana facilities. More hours mean more direct care. The national average is about 3.5 hrs; below 3.0 is a red flag.Rankings are based only on facilities in Indiana that report data for that category. Facilities without available data are excluded from the ranking.Click the rank badge to see the full State ranking.Click here to see the full State ranking.
This facility Indiana avg (3h 26m per day)
vs Indiana avg
-2%

4 of 6 metrics below state avg

Standout metric Physical Therapist is +128% above state avg
Staff typeHours / Day / Residentvs state avg
Registered Nurse (RN) Info RNs hold the highest nursing license and can assess residents, interpret test results, and direct care plans. More RN hours per day often signals stronger clinical oversight and faster response to health changes. 19m per day ▼ 52% State avg: 39m per day · National avg: 41m per day
LPN / LVN Info Licensed Practical Nurses (LPNs) or Licensed Vocational Nurses (LVNs) deliver routine hands-on care — medication administration, wound dressing, and monitoring vital signs. They work under RN supervision and make up a large share of daily bedside care. 1h 12m per day ▲ 52% State avg: 47m per day · National avg: 52m per day
Nurse Aide Info Certified Nurse Aides (CNAs) provide the most direct day-to-day assistance: bathing, dressing, feeding, and mobility. Nurse aide hours are typically the largest staffing category and directly affect residents' quality of life. 2h 1m per day ▼ 10% State avg: 2h 15m per day · National avg: 2h 20m per day
Weekend Total Nursing Info Combined nursing hours (RN + LPN + Nurse Aide) per resident per day on weekends. Staffing often drops on weekends — this figure reveals whether the facility maintains adequate coverage outside of weekday hours. 2h 58m per day ▼ 9% State avg: 3h 16m per day · National avg: 3h 27m per day
Physical Therapist Info Hours per resident per day provided by licensed Physical Therapists (PTs) or PT Assistants. PT services help residents recover mobility after injury or illness and are especially important for post-acute (short-stay) rehabilitation. 8m per day ▲ 128% State avg: 4m per day · National avg: 4m per day
Weekend RN Info Registered nurse hours specifically on weekends. Facilities sometimes reduce RN presence on Saturdays and Sundays — a low weekend RN figure compared to weekday hours can indicate reduced clinical oversight when most administrative staff are absent. 2m per day ▼ 94% State avg: 27m per day · National avg: 29m per day

Capacity and availability

This home usually has availability

Higher occupancy than the Indiana average: 69.4%
Occupancy rate
73.2% Rank #162 / 434Occupancy rate — State benchmarkedThis home is ranked 162nd out of 434 homes in Indiana. Shows this facility's occupancy rate versus the Indiana average, with its Statewide rank out of 434. Higher occupancy signals strong local demand and financial stability.Rankings are based only on facilities in Indiana that report data for that category. Facilities without available data are excluded from the ranking.Click the rank badge to see the full State ranking.Click here to see the full State ranking.
Avg. Length of Stay
58 days
Bed community size
87-bed community Rank #294 / 437Bed count — State benchmarkedThis home is ranked 294th out of 437 homes in Indiana. Shows this facility's certified or reported bed count compared to other Indiana facilities. Larger communities may offer more amenities, programs, and on-site services for residents and families.Rankings are based only on facilities in Indiana that report data for that category. Facilities without available data are excluded from the ranking.Click the rank badge to see the full State ranking.Click here to see the full State ranking.
A larger shared setting that may offer more common spaces and organized community services.
Walk Score
Walk Score: 24 / 100 Rank #366 / 587Walk Score — State benchmarkedThis home is ranked 366th out of 587 homes in Indiana. Shows how walkable this facility's neighborhood is compared to the average Walk Score across Indiana facilities. Higher scores benefit residents, families, and staff.Rankings are based only on facilities in Indiana that report data for that category. Facilities without available data are excluded from the ranking.Click the rank badge to see the full State ranking.Click here to see the full State ranking.
Car-dependent. Most errands require a car, with limited nearby walkable options.
BBB Rating
BBB Rating: A- (Not Accredited)
An independent rating from the Better Business Bureau based on factors such as complaint history, transparency, and business practices.
How BBB ratings work

Therapy & Rehabilitation

2 services
Rehabilitation Services
Respite Care

Staffing & Medical

1 service
24-Hour Staffing

Pricing & Financial Information

Independent Living$2,455 per month
Assisted Living$2,500 per month
Memory Care$5,130 per month
Skilled Nursing$348 per month

Dining & Nutrition

Food DescriptionThree meals inspired by Executive Chef

Contact Altenheim Family-first Senior Living

Health Inspection History

Inspections since 2023
Total health inspections 8

Indiana average 6


Last Health inspection on Jul 2025

Total health citations
10 Rank #41 / 292Health citations — State benchmarkedThis home is ranked 41st out of 292 homes in Indiana. Shows this facility's total health deficiency citations benchmarked to the Indiana State average, with a ranking across all 292 IN facilities. Lower citation counts earn a better rank.Rankings are based only on facilities in Indiana that report data for that category. Facilities without available data are excluded from the ranking.Click the rank badge to see the full State ranking.Click here to see the full State ranking.

Indiana average 25

Citations per inspection
1.25 Rank #6 / 292Citations per inspection — State benchmarkedThis home is ranked 6th out of 292 homes in Indiana. Shows average deficiency citations per CMS inspection for this facility versus the Indiana mean across 292 facilities with citation data. Lower is better.Rankings are based only on facilities in Indiana that report data for that category. Facilities without available data are excluded from the ranking.Click the rank badge to see the full State ranking.Click here to see the full State ranking.

Indiana average 4.12


Health citations are formal notices following inspections when they fail to comply with safety and care standards.

4 of 10 citations resulted from standard inspections; 5 of 10 resulted from complaint investigations; and 1 of 10 came from combined inspections (standard and complaint).

Breakdown of citation severity (last 3 years)
Critical health citations
0
100% better than Indiana average

Indiana average: 0.2


Serious health citations
0
100% better than Indiana average

Indiana average: 0.6

0 critical citations Indiana average: 0.2

0 serious citations Indiana average: 0.6

10 moderate citations Indiana average: 23.8

0 minor citations Indiana average: 0.4
Citations history (last 3 years)
Pharmacy moderate citation Jul 30, 2025

Infection Control moderate citation Jun 19, 2025
Corrected

Resident Rights moderate citation Jun 19, 2025
Corrected

Pharmacy moderate citation Feb 24, 2025
Corrected

Staffing Data

Reporting period: October 1 – December 31, 2025 (Q4 2025). Source: CMS Payroll-Based Journal report.

Total staff 161
Employees 101
Contractors 60
Staff to resident ratio 2.33 : 1
2333233% more staff per resident than Indiana average
Indiana average ratio: 0.00 : 1 Indiana average ratio: 0.00 : 1See full Indiana ranking
Avg staff/day 45
Average shift 7.8 hours
0% compared with Indiana average
Indiana average: 7.7 hours Indiana average shift: 7.7 hoursSee full Indiana ranking
Total staff hours (quarter) 32,258

Nursing staff breakdown

Q4 2025 · Oct 1 – Dec 31 More info This data comes from the CMS Payroll-Based Journal report covering October 1 – December 31, 2025.
Registered Nurse

Manages medical care and health needs.

RN Staff Info 13 total: 6 full-time employees and 7 contractors. 13
Average shift length Info Average shift length. Calculated as total hours divided by days worked and average staff per day. 8.2 hours
Licensed Practical Nurse

Assists with medical care and medications.

LPN Staff Info All 24 LPN Staff are full-time employees. No contractors work on this role. 24
Average shift length Info Average shift length. Calculated as total hours divided by days worked and average staff per day. 8.6 hours
Certified Nursing Assistant

Helps with daily care and mobility.

CNA Staff Info 36 total: 35 full-time employees and 1 contractor. 36
Average shift length Info Average shift length. Calculated as total hours divided by days worked and average staff per day. 8.1 hours

Contractor staffing

Q4 2025 · Oct 1 – Dec 31 More info This data comes from the CMS Payroll-Based Journal report covering October 1 – December 31, 2025.

Total hours from contractors

14.1%

4,557 contractor hours this quarter

Qualified Social Worker: 14 Physical Therapy Assistant: 13 Speech Language Pathologist: 8 Respiratory Therapy Technician: 8 Registered Nurse: 7 Physical Therapy Aide: 6 Qualified Activities Professional: 3 Certified Nursing Assistant: 1

Staff by category

Q4 2025 · Oct 1 – Dec 31 More info This data comes from the CMS Payroll-Based Journal report covering October 1 – December 31, 2025.
Certified Nursing Assistant3513610,28392100%8.1
Licensed Practical Nurse240248,25492100%8.6
Medication Aide/Technician100103,97892100%9.6
Other Dietary Services Staff7071,67592100%7.4
Physical Therapy Assistant013131,2268491%6
Registered Nurse67131,0207379%8.2
Respiratory Therapy Technician0889988289%7.5
Dental Services Staff2029276773%7.9
Clinical Nurse Specialist7076946065%7.1
Speech Language Pathologist0886458087%5.3
Dietitian1015686773%8.5
Nurse Practitioner1015286672%8
Qualified Social Worker014144736571%5
Administrator1012883639%8
RN Director of Nursing5052342830%7.3
Physical Therapy Aide0661663437%4.4
Occupational Therapy Aide1011226166%2
Nurse Aide in Training1011091516%7.3
Qualified Activities Professional033701820%3.9
36 Certified Nursing Assistant
% of Days 100%
24 Licensed Practical Nurse
% of Days 100%
10 Medication Aide/Technician
% of Days 100%
7 Other Dietary Services Staff
% of Days 100%
13 Physical Therapy Assistant
% of Days 91%
13 Registered Nurse
% of Days 79%
8 Respiratory Therapy Technician
% of Days 89%
2 Dental Services Staff
% of Days 73%
7 Clinical Nurse Specialist
% of Days 65%
8 Speech Language Pathologist
% of Days 87%
1 Dietitian
% of Days 73%
1 Nurse Practitioner
% of Days 72%
14 Qualified Social Worker
% of Days 71%
1 Administrator
% of Days 39%
5 RN Director of Nursing
% of Days 30%
6 Physical Therapy Aide
% of Days 37%
1 Occupational Therapy Aide
% of Days 66%
1 Nurse Aide in Training
% of Days 16%
3 Qualified Activities Professional
% of Days 20%

Penalties and fines

Federal penalties imposed by CMS for regulatory violations, including civil money penalties (fines) and denials of payment for new Medicare/Medicaid admissions.

Source: CMS Penalties Database

No penalties in the past 3 years

No civil money penalties or payment denials were reported in the last 3 years.

Quality of care over time

These measures show how residents usually do over time at this home, based on health outcomes and preventive care.

High-risk clinical events score Info A composite score based on pressure ulcers, falls with injury, weight loss, walking ability decline, and activities of daily living decline. 3.6
55% better than Indiana average

Indiana average: 8.0

Functional decline score Info A composite score based on activities of daily living decline, walking ability decline, and incontinence. 12.9
25% better than Indiana average

Indiana average: 17.1

Long-stay resident measures
Need for Help with Daily Activities Increased Info Percent of long-stay residents whose need for help with daily activities has increased 3.0%
75% better than Indiana average

Indiana average: 12.0%

Walking Ability Worsened Info Percent of long-stay residents whose ability to move independently worsened 4.1%
71% better than Indiana average

Indiana average: 14.4%

Low Risk Residents with Bowel/Bladder Incontinence Info Percent of low risk long-stay residents who lose control of their bowels or bladder 31.5%
28% worse than Indiana average

Indiana average: 24.6%

Falls with Major Injury Info Percent of long-stay residents experiencing one or more falls with major injury 3.1%
19% better than Indiana average

Indiana average: 3.9%

High Risk Residents with Pressure Ulcers Info Percent of long-stay high risk residents with pressure ulcers 5.5%
25% worse than Indiana average

Indiana average: 4.4%

Urinary Tract Infection Info Percent of long-stay residents with a urinary tract infection 1.4%
11% worse than Indiana average

Indiana average: 1.2%

Lost Too Much Weight Info Percent of long-stay residents who lose too much weight 2.4%
58% better than Indiana average

Indiana average: 5.7%

Depressive Symptoms Info Percent of long-stay residents who have depressive symptoms 1.9%
92% better than Indiana average

Indiana average: 24.1%

Antipsychotic Use Info Percent of long-stay residents who received an antipsychotic medication 9.3%
25% better than Indiana average

Indiana average: 12.4%

Pneumococcal Vaccine Info Percent of long-stay residents assessed and appropriately given the pneumococcal vaccine 99.6%
6% better than Indiana average

Indiana average: 93.7%

Influenza Vaccine Info Percent of long-stay residents assessed and appropriately given the seasonal influenza vaccine 96.7%
In line with Indiana average

Indiana average: 95.4%

Short-stay resident measures
Pneumococcal Vaccine Info Percent of short-stay residents assessed and appropriately given the pneumococcal vaccine 83.3%
In line with Indiana average

Indiana average: 81.7%

Antipsychotic medication increase Info Percent of short-stay residents who newly received an antipsychotic medication 0.5%
63% better than Indiana average

Indiana average: 1.4%

Influenza Vaccine Info Percent of short-stay residents assessed and appropriately given the seasonal influenza vaccine 83.5%
6% better than Indiana average

Indiana average: 79.0%

Breakdown by payment type

Medicare

30% of new residents, usually for short-term rehab.

Typical stay 29 days

Private pay

63% of new residents, often for short stays.

Typical stay 4 - 5 months

Medicaid

7% of new residents, often for long-term daily care.

Typical stay 1 - 2 years

Facility Characteristics

Source: CMS Long-Term Care Facility Characteristics (Data as of Jan 2026)

Total residents 69
Medicare
11
15.9% of residents
Medicaid
39
56.5% of residents
Private pay or other
19
27.5% of residents
Programs & Services
Clinical Research

Conducts clinical research trials to develop and test new treatments

Finances and operations

Based on CMS SNF Cost Report for fiscal year ending in 12/2023.

Governmental community
Operated by federal authorities.
Net patient revenue Info Net patient revenue — what the home actually collects for resident care, after contractual allowances, bad debt and discounts are subtracted from its gross charges (CMS cost report, Worksheet G-3). It covers resident care only; money the home earns from other sources is shown separately as "Other income."
$15.1M
Net patient income Info Net patient income: net patient revenue minus the home's total operating expenses. A positive figure means it earns more from resident care than it spends to deliver it; a negative figure means the opposite. It excludes non-operating "other income."
$376.3K
Governmental community Operated by federal authorities.
Net patient revenue Info Net patient revenue — what the home actually collects for resident care, after contractual allowances, bad debt and discounts are subtracted from its gross charges (CMS cost report, Worksheet G-3). It covers resident care only; money the home earns from other sources is shown separately as "Other income."
$15.1M Rank #25 / 294Revenue — State benchmarkedThis home is ranked 25th out of 294 homes in Indiana. Shows this facility's annual revenue compared to the Indiana average. Higher revenue generally means more resources for staffing and capital — read alongside Payroll %.Rankings are based only on facilities in Indiana that report data for that category. Facilities without available data are excluded from the ranking.Click the rank badge to see the full State ranking.Click here to see the full State ranking.
Net patient income Info Net patient income: net patient revenue minus the home's total operating expenses. A positive figure means it earns more from resident care than it spends to deliver it; a negative figure means the opposite. It excludes non-operating "other income."
$376.3K
Other income Info Money the home earns outside of resident care — such as investments, grants, rentals and other non-operating sources (CMS cost report, Worksheet G-3). It is tracked separately from net patient revenue: it is not part of that figure, and it is not included in net patient income.
$34.2K
Payroll costs Info Staff salaries plus wage-related costs — benefits such as payroll taxes, health insurance and retirement — from the home's own accounting records (CMS cost report, Worksheet A). Contract or agency labor is counted separately, under other operating costs. Rank #49 / 294Payroll — State benchmarkedThis home is ranked 49th out of 294 homes in Indiana. Shows total annual staff payroll benchmarked to the Indiana average. Higher payroll investment relative to peers often signals better staffing and less reliance on cheaper contract labor.Rankings are based only on facilities in Indiana that report data for that category. Facilities without available data are excluded from the ranking.Click the rank badge to see the full State ranking.Click here to see the full State ranking.
$7.0M 46.6% of net patient revenue Info Payroll as a share of revenue: staff salaries and wage-related benefits divided by net patient revenue. A higher figure means more of each revenue dollar goes to staff pay. Rank #257 / 294Payroll % — State benchmarkedThis home is ranked 257th out of 294 homes in Indiana. Shows payroll as a percentage of revenue versus the Indiana average. Well-run Indiana facilities typically land around 54–68% — the top third Statewide. Below 25% may signal understaffing or heavy agency use — read with Staffing ratings.Rankings are based only on facilities in Indiana that report data for that category. Facilities without available data are excluded from the ranking.Click the rank badge to see the full State ranking.Click here to see the full State ranking.
Other operating costs Info Everything it costs to run the home apart from payroll — food, utilities, supplies, maintenance, contract labor and administration. Calculated as total operating expense minus payroll (staff salaries and wage-related benefits).
$7.7M
Total costs Info The home's total operating expense for the year — all the costs of running it, salaries included (CMS cost report, Worksheet G-3).
$14.7M

Who this home usually serves

TYPE OF STAY

Primarily short stays

Residents typically stay for brief periods, with frequent admissions and discharges throughout the year.

Most new residents arrive under private pay (63% of admissions), and a typical private pay stay runs around 4 - 5 months.

Admissions
396 total

Coverage residents most often arrive under.

Medicare 30%
Private pay 63%
Medicaid 7%
Discharges
486 total

Coverage residents most often leave under.

Medicare 23%
Private pay 57%
Medicaid 21%

Managed by Daniel W. Moore

Administrator

Daniel W. Moore is a licensed health facility administrator who has served as administrator of CarDon’s Health & Living Communities in Paoli, Sullivan, and Indianapolis. He coordinated the planning and construction of Bell Trace and Brookside Village in Jasper. Daniel currently serves as executive vice president of CarDon’s board of directors, bringing extensive leadership experience to the community.

Living Spaces & Floor Plans for Altenheim Family-first Senior Living

Crawford
Crawford
Dearborn
Dearborn
Fulton
Fulton
Jackson
Jackson
Johnson
Johnson

Places of interest near Altenheim Family-first Senior Living

Address 5.1 miles from city center Info Estimated distance in miles from Indianapolis's city center to Altenheim Family-first Senior Living's address, calculated via Google Maps.

Calculate Travel Distance to Altenheim Family-first Senior Living

Add your location

Address

Compare Nursing Homes around Indianapolis

The information below is reported by the Indiana Department of Health, Division of Long Term Care.

5 facilities compared · CMS & IN Dept. of Health data

Altenheim Family-first Senior Living
NH
AL
IL
Indianapolis (Perry Township)
87
Facility 87
IN AVG 116
Rank #294 / 437
73.2%
Facility 73.2%
IN AVG 69.4%
Rank #162 / 434
+5%
3.37
Facility 3.37
IN AVG 3.44
Rank #130 / 291
-17%-2%
$0
Facility $0
IN AVG $31.4k
Rank #1 / 293
-
10
Facility 10
IN AVG 25.0
Rank #41 / 292
1.3
Facility 1.3
IN AVG 4.1
Rank #6 / 292
-77A-
24
Facility 24
IN AVG 37
Rank #366 / 587
-
$15.1M
Facility $15.1M
IN AVG $10.7M
Rank #25 / 294
$7.0M
Facility $7.0M
IN AVG $4.2M
Rank #49 / 294
46.6%
Facility 46.6%
IN AVG 42%
Rank #257 / 294
155196
Marquette Senior Living
NH
AL
IL
MC
Indianapolis (Westchester Estates)
134
Facility 134
IN AVG 116
Rank #128 / 437
92.5%
Facility 92.5%
IN AVG 69.4%
Rank #330 / 434
+33%
4.69
Facility 4.69
IN AVG 3.44
Rank #23 / 291
+19%+36%
$0
Facility $0
IN AVG $31.4k
Rank #1 / 293
76
Facility 76
IN AVG 83
Rank #241 / 384
26
Facility 26
IN AVG 25.0
Rank #164 / 292
6.5
Facility 6.5
IN AVG 4.1
Rank #251 / 292
3124A+
22
Facility 22
IN AVG 37
Rank #384 / 587
Retirement Living Inc
$33.6M
Facility $33.6M
IN AVG $10.7M
Rank #2 / 294
$15.2M
Facility $15.2M
IN AVG $4.2M
Rank #4 / 294
45.1%
Facility 45.1%
IN AVG 42%
Rank #251 / 294
155198
American Village
NH
AL
HC
IL
MC
RC
Indianapolis (Canterbury-Chatard)
229
Facility 229
IN AVG 116
Rank #18 / 437
53.3%
Facility 53.3%
IN AVG 69.4%
Rank #321 / 434
-23%
3.36
Facility 3.36
IN AVG 3.44
Rank #130 / 291
+11%-2%
$0
Facility $0
IN AVG $31.4k
Rank #1 / 293
69
Facility 69
IN AVG 83
Rank #341 / 384
55
Facility 55
IN AVG 25.0
Rank #274 / 292
6.1
Facility 6.1
IN AVG 4.1
Rank #239 / 292
-134A+
70
Facility 70
IN AVG 37
Rank #71 / 587
Gina Couch
$18.7M
Facility $18.7M
IN AVG $10.7M
Rank #23 / 294
$10.7M
Facility $10.7M
IN AVG $4.2M
Rank #12 / 294
57.1%
Facility 57.1%
IN AVG 42%
Rank #88 / 294
155292
Spring Mill Meadows
NH
HC
IL
RC
Indianapolis (North Willow Farms)
130
Facility 130
IN AVG 116
Rank #140 / 437
63.8%
Facility 63.8%
IN AVG 69.4%
Rank #246 / 434
-8%
3.66
Facility 3.66
IN AVG 3.44
Rank #72 / 291
+11%+6%
$0
Facility $0
IN AVG $31.4k
Rank #1 / 293
70
Facility 70
IN AVG 83
Rank #326 / 384
27
Facility 27
IN AVG 25.0
Rank #175 / 292
3.4
Facility 3.4
IN AVG 4.1
Rank #118 / 292
387A+
68
Facility 68
IN AVG 37
Rank #81 / 587
Cynthia Kump
$10.3M
Facility $10.3M
IN AVG $10.7M
Rank #111 / 294
$5.4M
Facility $5.4M
IN AVG $4.2M
Rank #111 / 294
52.8%
Facility 52.8%
IN AVG 42%
Rank #177 / 294
155154
Community Nursing and Rehabilitation Center
NH
HC
RC
Indianapolis (Eastside)
115
Facility 115
IN AVG 116
Rank #188 / 437
47.8%
Facility 47.8%
IN AVG 69.4%
Rank #366 / 434
-31%
3.79
Facility 3.79
IN AVG 3.44
Rank #63 / 291
-52%+10%
$0
Facility $0
IN AVG $31.4k
Rank #1 / 293
74
Facility 74
IN AVG 83
Rank #270 / 384
47
Facility 47
IN AVG 25.0
Rank #256 / 292
9.4
Facility 9.4
IN AVG 4.1
Rank #287 / 292
149A+
56
Facility 56
IN AVG 37
Rank #172 / 587
The Health And Hospital Corporation Of Marion County
$5.1M
Facility $5.1M
IN AVG $10.7M
Rank #236 / 294
$3.4M
Facility $3.4M
IN AVG $4.2M
Rank #237 / 294
65.8%
Facility 65.8%
IN AVG 42%
Rank #95 / 294
155029

Financial Assistance for
Nursing Home in Indiana

Altenheim Family-first Senior Living is located in Indianapolis, Indiana.
Here are the financial assistance programs available to residents in Indiana.

Get Financial aid guidance

Aged and Disabled Waiver

Indiana Medicaid A&D Waiver

Age 65+ or disabled
General Indiana resident, Medicaid-eligible, nursing home-level care need.
Income Limits (2025) ~$2,829/month 300% FBR, individual
Asset Limits $2,000 (individual), $3,000 (couple).
IN

Requires level-of-care determination.

Benefits
Personal care (5-7 hours/day) Respite (240 hours/year) Adult day care (~$60/day) Home health services

CHOICE Program

Indiana CHOICE

Age 60+
General Indiana resident, at risk of nursing home.
Income Limits ~$2,000/month varies
Asset Limits $10,000 individual
IN

Limited funding; regional variation.

Benefits
In-home care (3-5 hours/week) Respite (up to 10 days/year) Transportation (~5 trips/month)

Residential Care Assistance Program (RCAP)

Indiana Residential Care Assistance Program

Age 65+
General or blind, or disabled, Indiana resident, in approved facility, low-income or SSI recipient.
Income Limits (2025) ~$1,004/month including SSI
Asset Limits $2,000 (individual), $3,000 (couple).
IN

~50 facilities statewide; per diem rate set by FSSA.

Benefits
Room/board Laundry Minimal care coordination (~$20-$50/day subsidy)

Medicare Savings Program (MSP)

Indiana Medicare Savings Program

Age 65+ or disabled
General Indiana resident, Medicare Part A/B.
Income Limits (2025) ~$2,510/month (QMB), ~$3,380/month (SLMB), ~$3,598/month (QI)—individual.
Asset Limits $9,430 (individual), $14,130 (couple).
IN

Three tiers; no waitlist.

Benefits
Covers Part B premiums ($174.70/month) Deductibles ($240/year) Copays (~20%)

National Family Caregiver Support Program (NFCSP) Respite

Indiana NFCSP Respite Care

Age
General Caregivers of 60+ needing care or 55+ caregivers of others; Indiana resident; functional needs (2+ ADLs).
Income Limits (2025) Prioritizes ~$24,980/year (individual); no strict cap.
Asset Limits Not assessed; need-based.
IN

16 AAAs; prioritizes low-income, rural caregivers.

Benefits
Respite (4-6 hours/week or 5 days/year) Adult day care ($60/day) Caregiver training

VA Aid and Attendance (A&A) and Housebound Benefits

Indiana VA Aid and Attendance/Housebound

Age 65+ or disabled veteran/spouse
General Indiana resident, wartime service, need for ADL help (A&A) or homebound.
Income Limits (2025) Net income < ~$1,984/month (veteran with dependent, A&A); pension offsets income.
Asset Limits ~$155,356 net worth limit
IN

High veteran demand statewide.

Benefits
Cash (~$1,433-$2,642/month veteran, ~$951-$1,318 spouse) for care costs (e.g., in-home, assisted living)

Frequently Asked Questions about Altenheim Family-first Senior Living

What neighborhood is Altenheim Family-first Senior Living in?

Altenheim Family-first Senior Living is in the Perry Township neighborhood of Indianapolis.

Is Altenheim Family-first Senior Living in a walkable area?

Altenheim Family-first Senior Living has a walk score of 24. Car-dependent. Most errands require a car, with limited nearby walkable options.

What is the occupancy rate at Altenheim Family-first Senior Living?

Altenheim Family-first Senior Living's occupancy is 73.2%.

Does Altenheim Family-first Senior Living have different floorplan options?

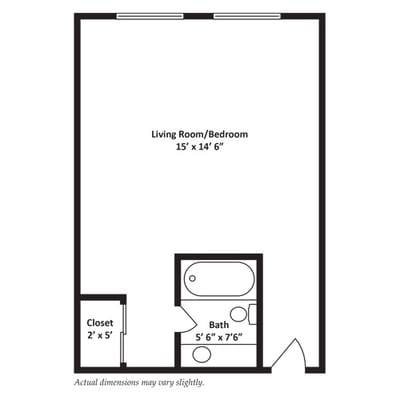
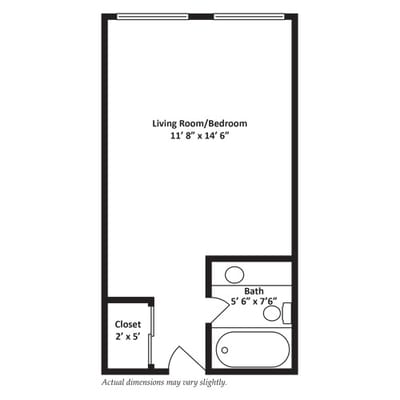
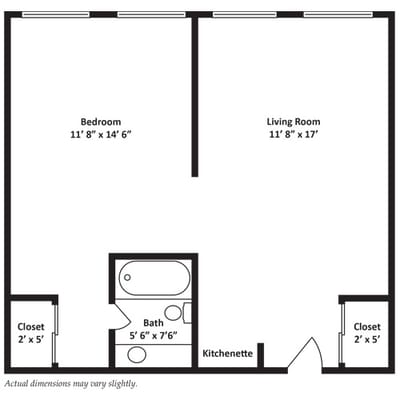
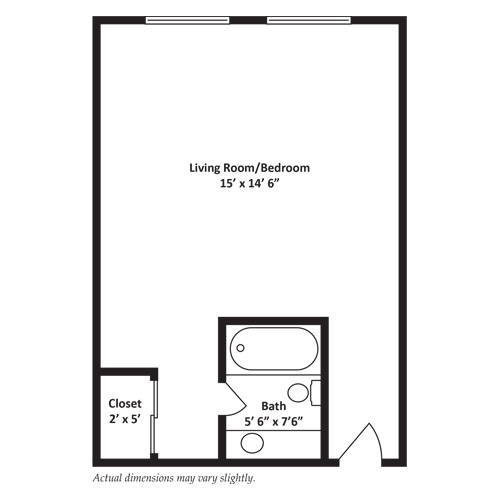
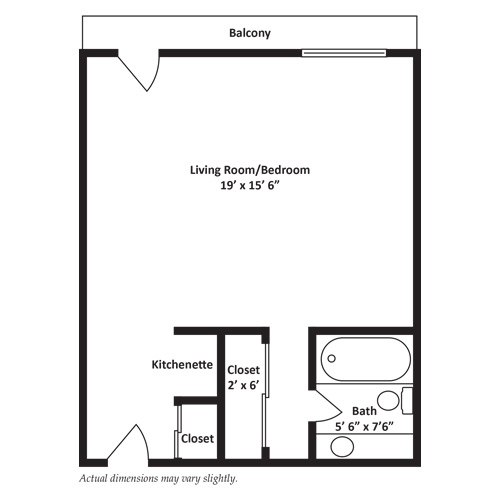
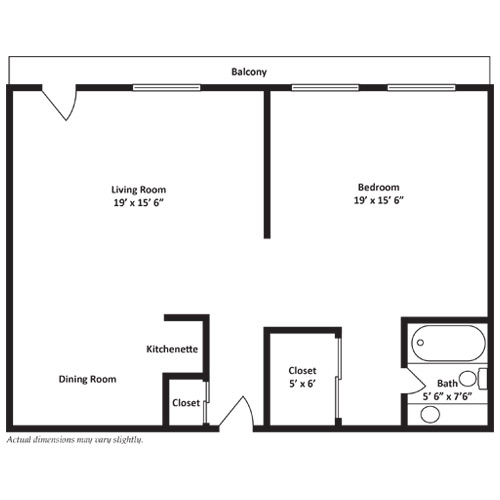
Yes — see the floorplan options available at Altenheim Family-first Senior Living on this page.

Are there photos of Altenheim Family-first Senior Living?

Yes — there are 31 photos of Altenheim Family-first Senior Living in the photo gallery on this page.

What is the address of Altenheim Family-first Senior Living?

Altenheim Family-first Senior Living is located at 3525 E Hanna Ave, Indianapolis, IN 46237.

What is the phone number of Altenheim Family-first Senior Living?

(317) 788-4261 will put you in contact with the team at Altenheim Family-first Senior Living.

Guides for Better Senior Living

Care Cost Calculator: See Prices in Your Area

Nursing Home Data Explorer

Don’t Wait Too Long: 7 Red Flag Signs Your Parent Needs Assisted Living Now

The True Cost of Assisted Living in 2025 – And How Families Are Paying For It

Understanding Senior Living Costs: Pricing Models, Discounts & Financial Assistance