


Occupancy rate
72%
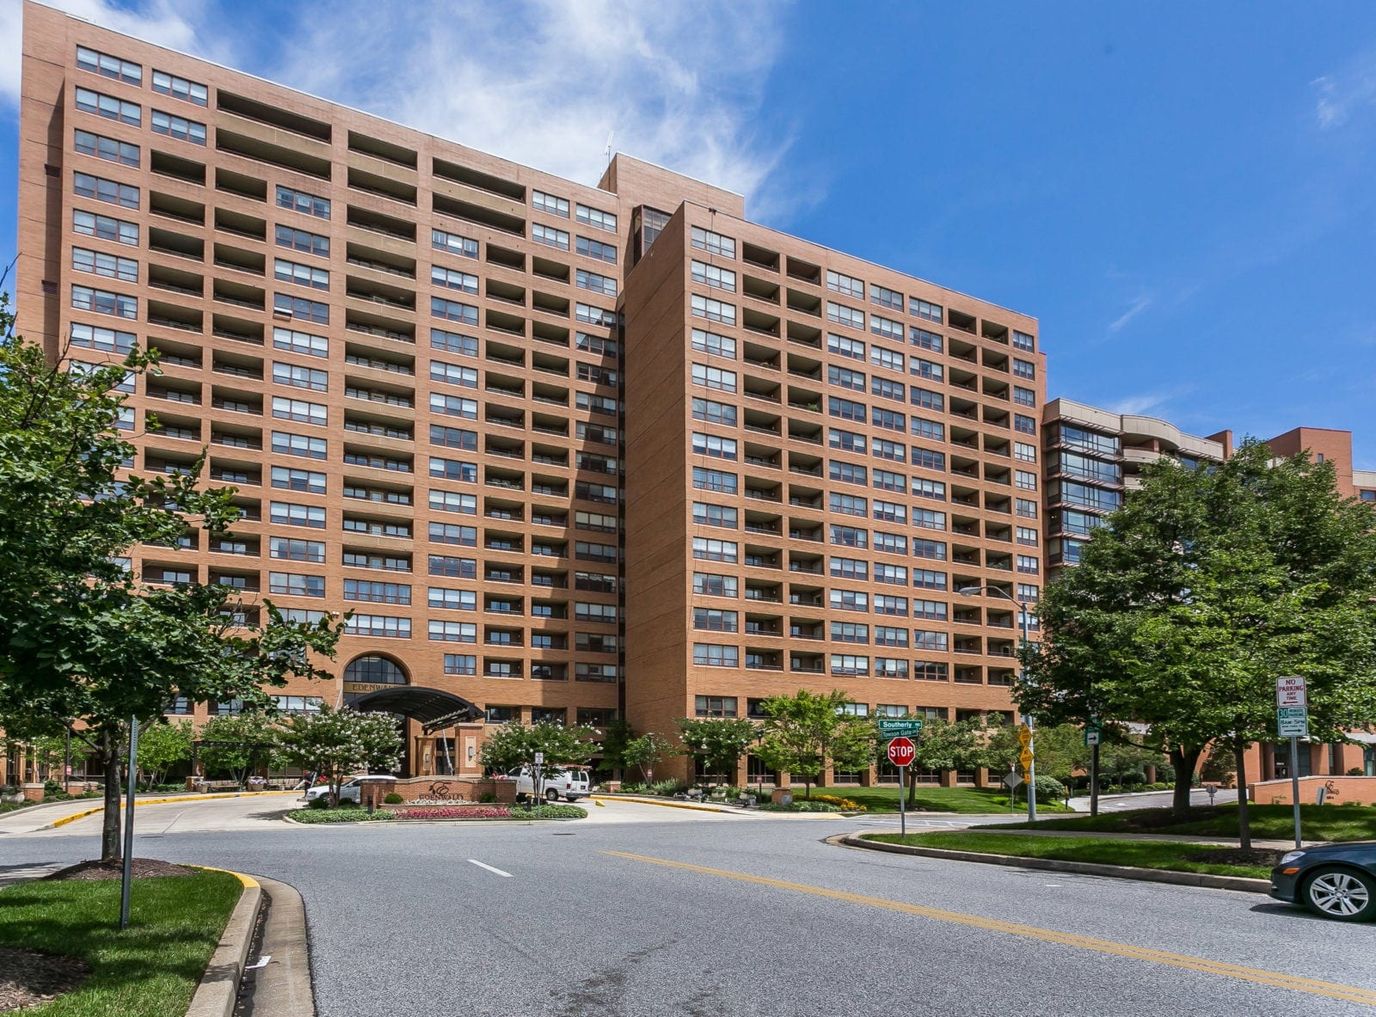
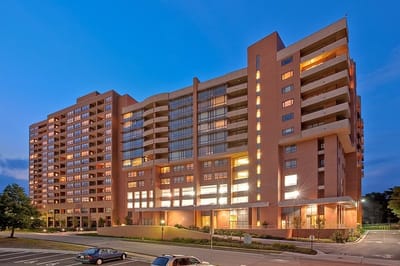

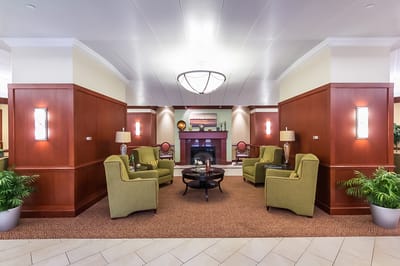

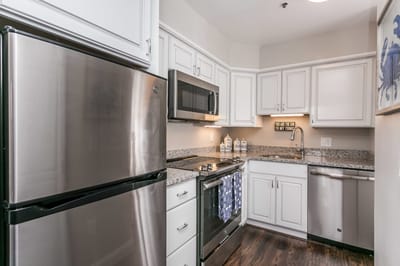
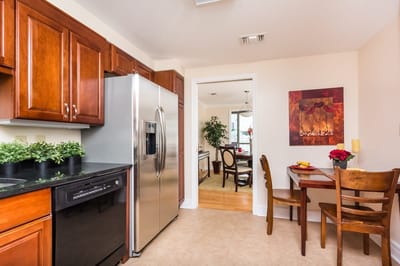
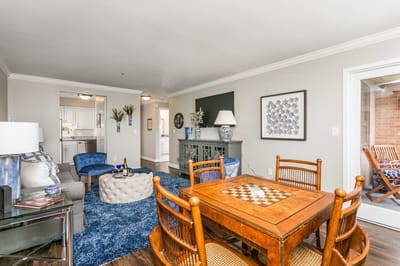
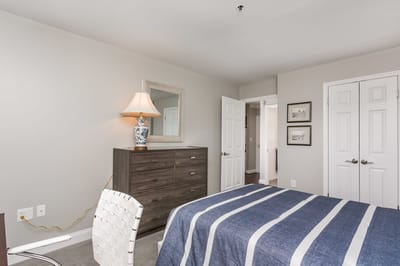


Live your best years at Edenwald Senior Living, an esteemed community in Towson, MD, offering independent living. The community also provides assisted living, memory care, and nursing care, ensuring residents can easily access healthcare when needs arise. Residents also enjoy hassle-free living with maintenance services and plenty of convenient apartment features.
A well-thought-out calendar of engaging activities and enriching programs is conducted, encouraging residents to live actively and make new friends. Residents have the finest dining experience with multiple dining venues that cater to their dietary needs and preferences. The community is ideal for those seeking independence in retirement, especially with its vibrant and welcoming environment.
| Staff type | Hours / Day / Resident | vs state avg |
|---|---|---|
|
Registered Nurse (RN)
| 1h 20m per day | ▲ 63% State avg: 49m per day · National avg: 41m per day |
|
LPN / LVN
| 38m per day | ▼ 29% State avg: 55m per day · National avg: 52m per day |
|
Nurse Aide
| 2h 52m per day | ▲ 34% State avg: 2h 8m per day · National avg: 2h 20m per day |
|
Weekend Total Nursing
| 4h 13m per day | ▲ 20% State avg: 3h 31m per day · National avg: 3h 27m per day |
|
Physical Therapist
| 15m per day | ▲ 151% State avg: 6m per day · National avg: 4m per day |
|
Weekend RN
| 53m per day | ▲ 45% State avg: 37m per day · National avg: 29m per day |
Key information about the people who lead and staff this community.
Maryland average 3.9
Last Health inspection on Jun 2025
Maryland average 49.9
Maryland average 12.81
Health citations are formal notices following inspections when they fail to comply with safety and care standards.
7 of 9 citations resulted from standard inspections; and 2 of 9 resulted from complaint investigations.
Maryland average: 0.5
Maryland average: 0.6
Resident demographic information for this facility.
How this facility protects residents through staff vaccination policies and immunization practices.
The facility requires certain vaccinations for staff as part of its infection prevention measures.
Reporting period: October 1 – December 31, 2025 (Q4 2025). Source: CMS Payroll-Based Journal report.
Manages medical care and health needs.
Assists with medical care and medications.
Helps with daily care and mobility.
Total hours from contractors
2,848 contractor hours this quarter
| Certified Nursing Assistant | 24 | 10 | 34 | 7,375 | 92 | 100% | 7.4 |
| Registered Nurse | 10 | 2 | 12 | 2,460 | 92 | 100% | 7.9 |
| Medication Aide/Technician | 6 | 0 | 6 | 1,875 | 91 | 99% | 8.5 |
| Licensed Practical Nurse | 8 | 1 | 9 | 1,834 | 92 | 100% | 7.9 |
| Clinical Nurse Specialist | 3 | 0 | 3 | 1,416 | 63 | 68% | 8 |
| Other Dietary Services Staff | 3 | 0 | 3 | 1,179 | 88 | 96% | 7.8 |
| Respiratory Therapy Technician | 0 | 2 | 2 | 786 | 63 | 68% | 7.8 |
| Physical Therapy Assistant | 0 | 2 | 2 | 657 | 63 | 68% | 7.8 |
| Dietitian | 1 | 0 | 1 | 510 | 63 | 68% | 8.1 |
| Occupational Therapy Aide | 1 | 0 | 1 | 488 | 61 | 66% | 8 |
| Administrator | 1 | 0 | 1 | 434 | 62 | 67% | 7 |
| Nurse Practitioner | 1 | 0 | 1 | 427 | 61 | 66% | 7 |
| Physical Therapy Aide | 0 | 1 | 1 | 392 | 49 | 53% | 8 |
| Dental Services Staff | 1 | 0 | 1 | 280 | 35 | 38% | 8 |
| Mental Health Service Worker | 1 | 0 | 1 | 240 | 30 | 33% | 8 |
| RN Director of Nursing | 1 | 0 | 1 | 232 | 25 | 27% | 9.3 |
| Qualified Social Worker | 0 | 1 | 1 | 201 | 30 | 33% | 6.7 |
| Speech Language Pathologist | 0 | 1 | 1 | 60 | 10 | 11% | 6 |
| Medical Director | 0 | 1 | 1 | 48 | 24 | 26% | 2 |
| Occupational Therapy Assistant | 0 | 1 | 1 | 18 | 3 | 3% | 5.8 |
Federal penalties imposed by CMS for regulatory violations, including civil money penalties (fines) and denials of payment for new Medicare/Medicaid admissions.
Source: CMS Penalties Database
No penalties in the past 3 years
No civil money penalties or payment denials were reported in the last 3 years.
These measures show how residents usually do over time at this home, based on health outcomes and preventive care.
Maryland average: 12.9
Maryland average: 25.7
Maryland average: 23.7%
Maryland average: 27.7%
Maryland average: 25.9%
Maryland average: 2.3%
Maryland average: 6.5%
Maryland average: 1.6%
Maryland average: 5.8%
Maryland average: 20.2%
Maryland average: 12.9%
Maryland average: 92.0%
Maryland average: 96.6%
Maryland average: 78.4%
Maryland average: 1.4%
Maryland average: 80.6%
Quality measures are calculated from Minimum Data Set (MDS) assessments. For most measures, lower percentages indicate better care quality.
29% of new residents, usually for short-term rehab.
71% of new residents, often for short stays.
Source: CMS Long-Term Care Facility Characteristics (Data as of Jan 2026)
Residents meet regularly to discuss policies, care quality, and activities
Part of a Continuing Care Retirement Community offering multiple care levels
Organized group of residents that meets regularly to discuss facility policies, quality of life, and activities.
Data sourced from CMS Long-Term Care Facility Characteristics quarterly report. Payer mix reflects the current resident census by primary payment source.
Historical financial and operational data for Edenwald Senior Living from 2022–2023, based on CMS SNF Cost Reports.
Based on CMS SNF Cost Report for fiscal year ending in 12/2023.
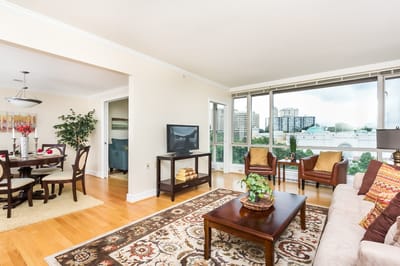
Housing Options: 1 Bed / 2 Bed
Building Type: High-rise
Beauty Services
Transportation Services
Housekeeping Services
Social and Recreational Activities
Exercise Programs
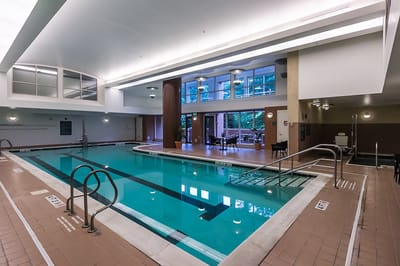
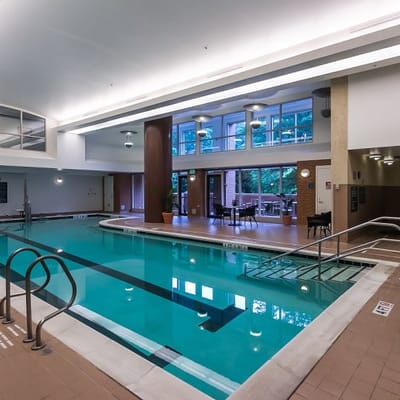
Swimming Pool
This home supports both short-term rehab and long-term care, with residents staying for a wide range of durations.
Most new residents arrive under private pay (71% of admissions), and a typical private pay stay runs around 9 years.
Coverage residents most often arrive under.
Coverage residents most often leave under.
Alan Reynolds is the Healthcare Administrator at Edenwald Senior Living. He is a licensed Nursing Home Administrator in Florida and Ohio with nearly 35 years of experience in senior living. Alan is dedicated to improving the lives of residents and brings a warm, family-oriented approach to his leadership role.
![]() 0.9 miles from city center
0.9 miles from city center
![]() Estimated distance in miles from Towson's city center to Edenwald Senior Living's address, calculated via Google Maps.
Estimated distance in miles from Towson's city center to Edenwald Senior Living's address, calculated via Google Maps.
Add your location
The information below is reported by the Maryland Department of Health, Office of Health Care Quality.
| Edenwald Senior Living | NH AL IL MC NC | Towson (Southerly Road) | 94
Facility
94
MD AVG
43
Rank
#148 / 697 | 72.3% | -12% | 5.28 | +5% | +40% | $0 | 9
Facility
9
MD AVG
49.9
Rank
#2 / 149 | 4.5 | - | 35 | A+ |
83
Facility
83
MD AVG
43
Rank
#70 / 985 | Mark Beggs | $29.9M | $16.0M | 53.6%
Facility
53.6%
MD AVG
38.5%
Rank
#77 / 148 | 215372 | ||||
| Blakehurst (Chestnut Green) | NH AL IL MC | Towson | 35
Facility
35
MD AVG
43
Rank
#246 / 697 | 88.1% | +7% | 5.25 | -12% | +39% | $0 | 9
Facility
9
MD AVG
49.9
Rank
#2 / 149 | 4.5 | - | 37 | - |
10
Facility
10
MD AVG
43
Rank
#837 / 985 | The Chestnut Real Estate Partnership | $4.7M | $12.5M | 262.4%
Facility
262.4%
MD AVG
38.5%
Rank
#126 / 148 | 215255 | ||||
| Complete Care at Multi-Medical Center | NH HC PC RC | Towson | 118
Facility
118
MD AVG
43
Rank
#86 / 697 | 89.7% | +9% | 3.11 | -23% | -18% | $0 | 29
Facility
29
MD AVG
49.9
Rank
#31 / 149 | 9.7 | - | 106 | - |
59
Facility
59
MD AVG
43
Rank
#327 / 985 | Pc MD Opcos LLC | $19.9M | $7.4M | 37.2%
Facility
37.2%
MD AVG
38.5%
Rank
#90 / 148 | 215096 | ||||
| Orchard Hill Rehabilitation & Healthcare Center | NH HC MC NC PC RC | Towson (West Road) | 139
Facility
139
MD AVG
43
Rank
#56 / 697 | 78.8% | -4% | 3.17 | +43% | -16% | $50.1k | 104
Facility
104
MD AVG
49.9
Rank
#141 / 149 | 20.8 | 1 | 120 | - |
75
Facility
75
MD AVG
43
Rank
#131 / 985 | Quinto Guardian LLC | $15.8M | $6.9M | 43.9%
Facility
43.9%
MD AVG
38.5%
Rank
#40 / 148 | 215069 |
Edenwald Senior Living is located in Towson, Maryland.
Here are the financial assistance programs available to residents in Maryland.
Edenwald Senior Living is in the Southerly Road neighborhood of Towson.
Edenwald Senior Living has a walk score of 83. Very walkable. Most errands can be accomplished on foot, and many essentials are within a short walk.
Edenwald Senior Living's occupancy is 72%.
Yes — see the floorplan options available at Edenwald Senior Living on this page.
Edenwald Senior Living is registered as a for-profit in MD.
Edenwald Senior Living has 94 beds.
Yes — there are 20 photos of Edenwald Senior Living in the photo gallery on this page.
Care Cost Calculator: See Prices in Your Area
Nursing Home Data Explorer
Don’t Wait Too Long: 7 Red Flag Signs Your Parent Needs Assisted Living Now
The True Cost of Assisted Living in 2025 – And How Families Are Paying For It
Understanding Senior Living Costs: Pricing Models, Discounts & Financial Assistance


