


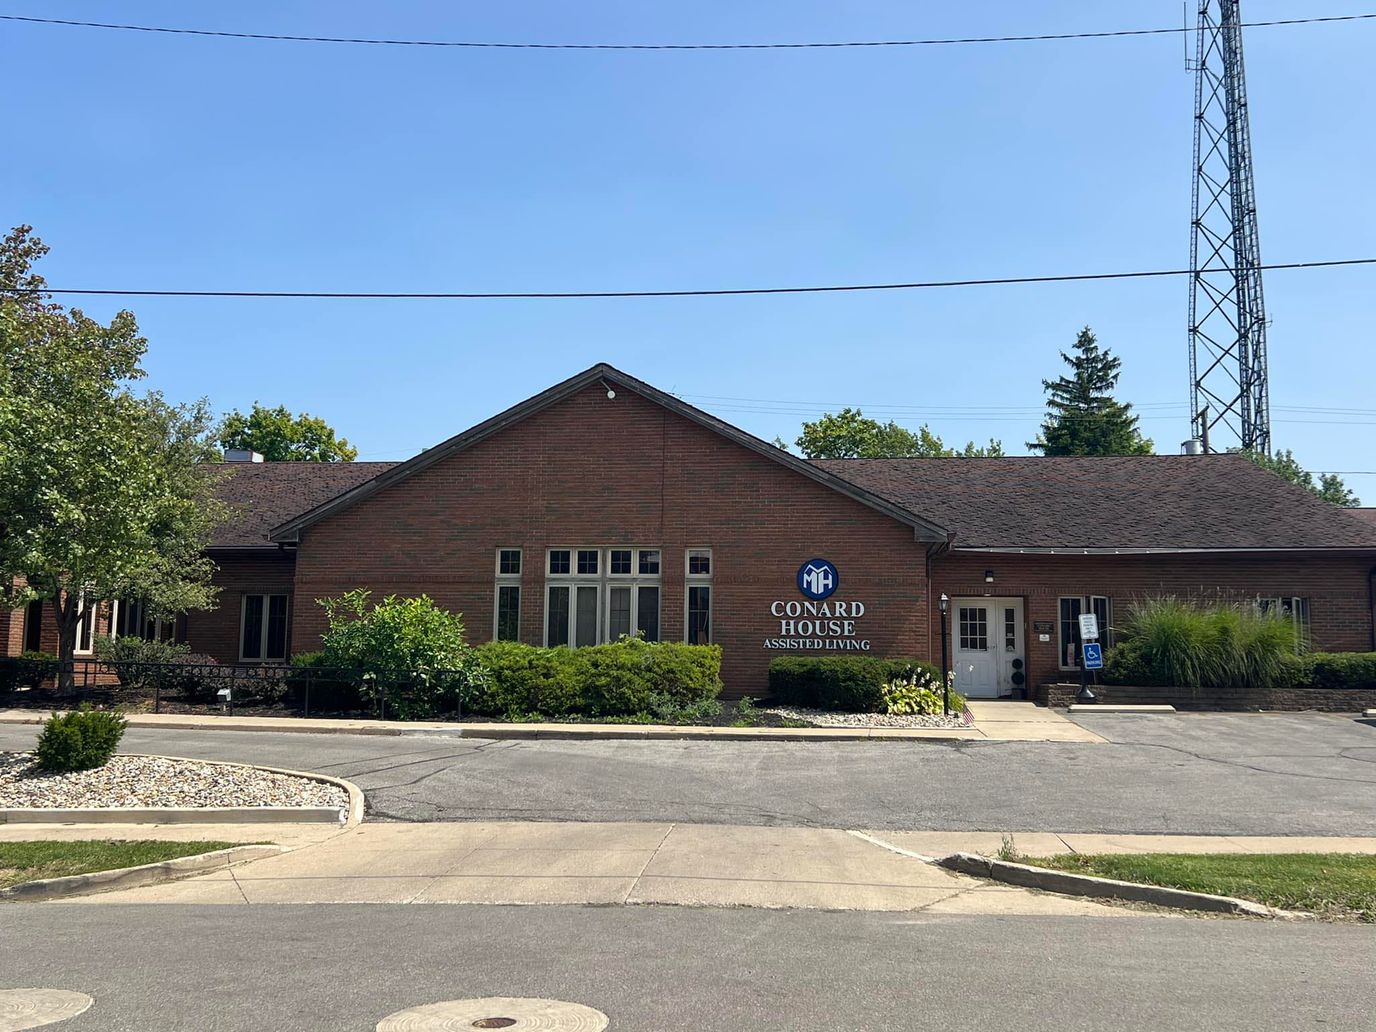
Conard House Assisted Living
Assisted Living, Home Care, Hospice Care, Memory Care & Skilled Nursing · Mansfield, OH
Conard House Assisted Living
Assisted Living, Home Care, Hospice Care, Memory Care & Skilled Nursing · Mansfield, OH
Conard House Assisted Living is an exceptional assisted living and memory care community in Mansfield, OH, that offers personal and specialized care for older adults and those with memory loss. Promoting a home-like and welcoming environment, the community ensures older adults feel at ease during their stay. Medication management and personal hygiene are also provided, ensuring a worry-free lifestyle.
Mind-stimulating activities, social events, and light exercises are conducted to enhance residents’ cognition and ensure their wellness. Housekeeping and meal preparation are also taken care of, ensuring residents’ comfort and convenience. The community’s accessible amenities and dedicated services create the ideal setting for the finest retirement experience.
25-bed community Rank #281 / 306Bed count — State benchmarkedThis home is ranked 281st out of 306 homes in Ohio for bed count. Shows this facility's certified or reported bed count compared to other Ohio facilities. Larger communities may offer more amenities, programs, and on-site services for residents and families.Facilities with the same value for a metric share the same rank. Rankings are based only on facilities in Ohio that report data for that category. Facilities without available data are excluded from the ranking.Click the rank badge to see the full State ranking.Click here to see the full State ranking.
A smaller, more intimate setting that may offer a quieter environment and closer staff-resident interactions.
Walk Score: 69 / 100 Rank #77 / 673Walk Score — State benchmarkedThis home is ranked 77th out of 673 homes in Ohio for walk score. Shows how walkable this facility's neighborhood is compared to the average walk score across Ohio facilities. Higher scores benefit residents, families, and staff.Facilities with the same value for a metric share the same rank. Rankings are based only on facilities in Ohio that report data for that category. Facilities without available data are excluded from the ranking.Click the rank badge to see the full State ranking.Click here to see the full State ranking.
Moderately walkable. Some errands can be accomplished on foot, with a mix of nearby amenities.
What does this home offer?
No pets allowed
Building Type: Single-story
Housekeeping Services
Social and Recreational Activities
Places of interest near Conard House Assisted Living
![]() 0.7 miles from city center
0.7 miles from city center
![]() Estimated distance in miles from Mansfield's city center to Conard House Assisted Living's address, calculated via Google Maps.
Estimated distance in miles from Mansfield's city center to Conard House Assisted Living's address, calculated via Google Maps.
Calculate Travel Distance to Conard House Assisted Living
Add your location
Compare Assisted Living around the area
Info below is compiled from the OH Dept. of Health, senior community websites & trusted data sources such as Walk Score & BBB.
Communities are listed from highest to lowest based on our ranking methodology.
| Locust Ridge | AL MC NH RC SNF | Williamsburg | 61
Facility
61
OH AVG
75
Rank
#172 / 306 | No | - | Private Rooms | A+ | - | - | 18
Facility
18
OH AVG
2
Rank
#153 / 172 | 4.5 |
| Brookdale Westlake Village | AL IL MC NH SNF | Westlake | 60
Facility
60
OH AVG
75
Rank
#175 / 306 | Yes |
25
Facility
25
OH AVG
42
Rank
#501 / 673 | 1 Bed / 2 Bed | A+ | Suzanne Nall | 86
Facility
86
OH AVG
85.8
Rank
#81 / 190 | 7
Facility
7
OH AVG
2
Rank
#135 / 172 | 1.8 |
| Elizabeth Scott Community | AL MC NH SNF | Maumee | 60
Facility
60
OH AVG
75
Rank
#175 / 306 | No | - | Studio / 1 Bed | A+ | Jill Schlievert | 94
Facility
94
OH AVG
85.8
Rank
#8 / 190 | 9
Facility
9
OH AVG
2
Rank
#143 / 172 | 2.3 |
| The Knolls of Oxford | AL IL MC NH SNF | Oxford | 50
Facility
50
OH AVG
75
Rank
#212 / 306 | Yes | - | Private / 1 Bed / 2 Bed / 3 Bed Rooms | - | Laura Lacy | 92
Facility
92
OH AVG
85.8
Rank
#19 / 190 | 4
Facility
4
OH AVG
2
Rank
#105 / 172 | - |
| Conard House Assisted Living | AL HC HOS MC SNF | Mansfield (Blymyer Avenue) | 25
Facility
25
OH AVG
75
Rank
#281 / 306 | No |
69
Facility
69
OH AVG
42
Rank
#77 / 673 | - | - | - | - | - | - |
Frequently Asked Questions about Conard House Assisted Living
What neighborhood is Conard House Assisted Living in?
Conard House Assisted Living is in the Blymyer Avenue neighborhood.
Is Conard House Assisted Living in a walkable area?
Conard House Assisted Living has a walk score of 69. Moderately walkable. Some errands can be accomplished on foot, with a mix of nearby amenities.
Are pets allowed at Conard House Assisted Living?
No, Conard House Assisted Living has a no-pet policy.
Are there photos of Conard House Assisted Living?
Yes — there is 1 photo of Conard House Assisted Living in the photo gallery on this page.
What is the address of Conard House Assisted Living?
Conard House Assisted Living is located at 71 Blymyer Avenue, Mansfield, OH 44903.
What is the phone number of Conard House Assisted Living?
(419) 774-5160 will put you in contact with the team at Conard House Assisted Living.
Guides for Better Senior Living
Care Cost Calculator: See Prices in Your Area
Assisted Living Explorer
Don’t Wait Too Long: 7 Red Flag Signs Your Parent Needs Assisted Living Now
The True Cost of Assisted Living in 2025 – And How Families Are Paying For It
Understanding Senior Living Costs: Pricing Models, Discounts & Financial Assistance
Updated on
