Autumn Lake Healthcare at Homewood Center
Nursing Home, Palliative Care & Respite Care · Baltimore, MD
CMS overall rating Info CMS (the Centers for Medicare & Medicaid Services) is the federal agency that rates nursing home quality. Its Overall Rating runs from 1 to 5 stars, combining health inspections, staffing, and quality measures, with inspections weighted most heavily.

Autumn Lake Healthcare at Homewood Center

Nursing Home, Palliative Care & Respite Care · Baltimore, MD
CMS overall rating Info CMS (the Centers for Medicare & Medicaid Services) is the federal agency that rates nursing home quality. Its Overall Rating runs from 1 to 5 stars, combining health inspections, staffing, and quality measures, with inspections weighted most heavily.
Calculator: See prices in your area
Autumn Lake Healthcare at Homewood Center accepts Medicare, Medicaid, and private pay.

Overview of Autumn Lake Healthcare at Homewood Center

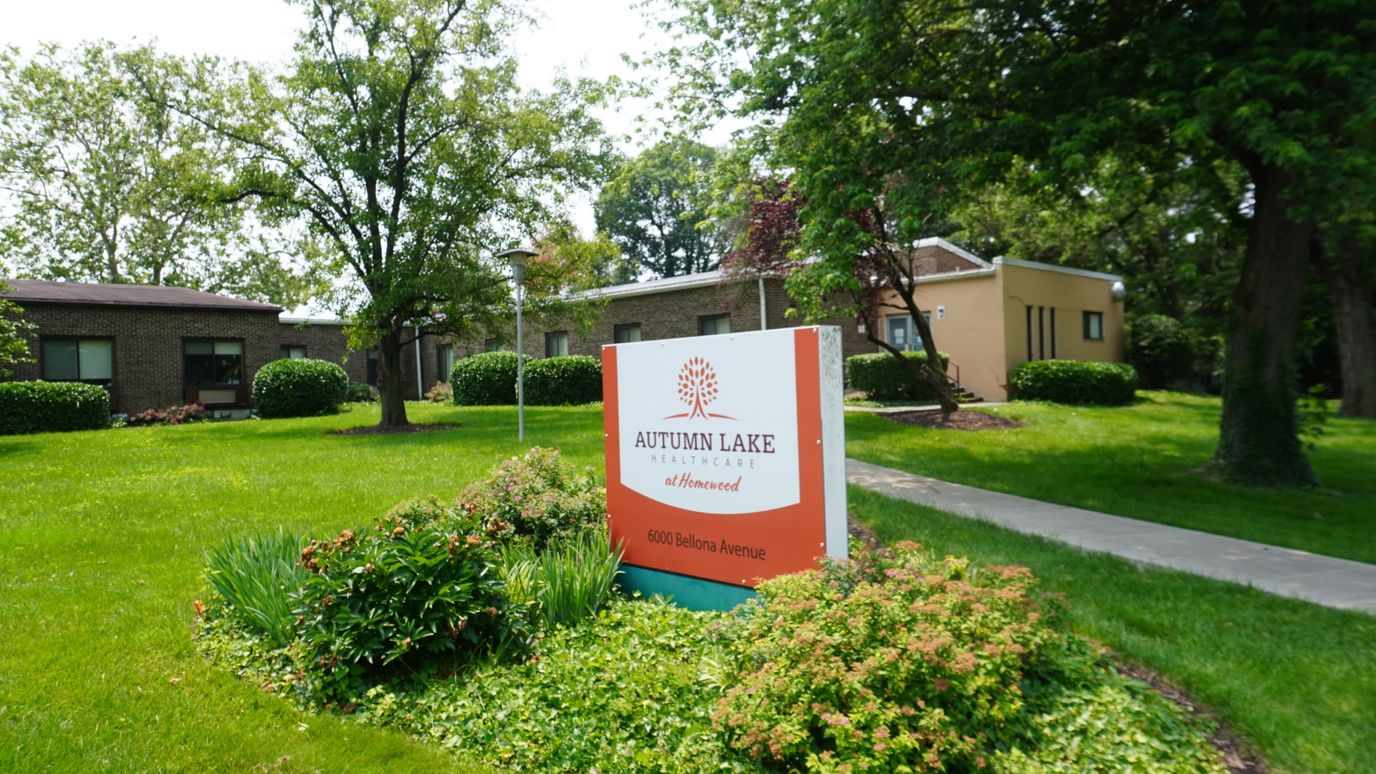
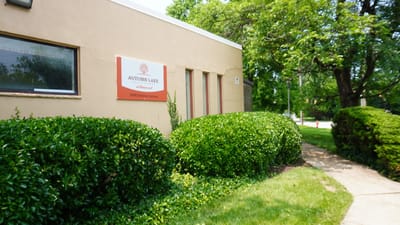
Located at 6000 Bellona Ave in the Homeland neighborhood, Autumn Lake Healthcare at Homewood Center operates as a 112-bed skilled nursing facility under the Autumn Lake Healthcare brand, owned and operated independently by 56 West Frederick Holdco LLC. The single-story facility offers private and semi-private rooms alongside dining, beauty services, recreational programming, and on-site medical care.

Admission patterns reflect a mixed population: current residents are predominantly Medicaid-funded (87.2%), with typical stays of nine to ten months for that population, plus Medicare and private-pay admissions for shorter rehabilitation periods.

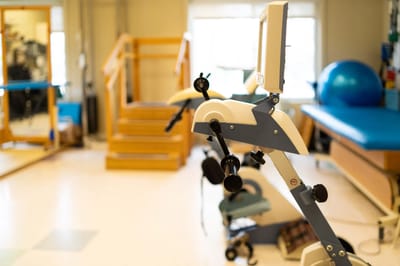
The facility provides stroke recovery, cardio-pulmonary care, orthopedic services, and joint replacement support.

While total staff-to-resident ratio reaches 2.76:1, far exceeding Maryland’s 1.81:1 average, the facility depends heavily on contract labor, particularly among licensed practical nurses: 100 of 116 LPNs are contractors. Total nursing care runs 3 hours 22 minutes per resident daily, 11% below the state benchmark. Registered nurse presence is limited at 26 minutes per day, trailing state average by nearly half, though licensed practical nurses contribute 58 minutes daily, slightly above state norms.

Clinical decline scores of 9.5 (27% better than state) and fall injury rates of 1.1% (51% better) indicate strong preventive care.

Pressure ulcer prevalence at 3.9% outperforms the state standard significantly. Vaccination coverage for long-stay residents is 92.7% pneumococcal and 96.9% influenza, and meets state expectations.

Short-stay rehabilitation residents, by contrast, experience elevated risks. Falls with major injury strike 1.6% of short-stay admissions, more than double the state average of 0.8%. Pneumococcal and influenza vaccination completion for short-stay admissions lag considerably at 57.1% and 65.0% respectively, both substantially below state performance. Re-hospitalization for short-stay patients reaches 23.7%, 12% worse than the state average.

The 2023 operating margin turned positive at 7.0%, and occupancy jumped to 84.3% from 73.2% the prior year.

No federal fines were assessed in the past three years.

The location scores 81 on walkability, with hospital access 1.58 miles distant.

The facility is oriented toward long-term Medicaid-dependent residents with significant medical needs; short-stay rehabilitation admissions face higher fall injury rates than regional peers.

(410) 323-4223

Quality ratings

Measured by Centers for Medicare & Medicaid Services (CMS)

Overall rating Info The Overall CMS Rating combines results from health inspections, staffing levels and quality measures. Health inspections carry the most weight. Staffing and quality scores can increase or decrease the final rating based on performance compared to state and national standards.
▼ 67.1% Below MD avg. ▼ 67.1% Below MD avg.MD average: 3.0Click the badge to see the full State ranking.Click here to see the full State ranking.
Health Inspection Info Based on the results of the facility's three most recent standard inspections and any complaint investigations. CMS reviews the number, scope, and severity of deficiencies, with more recent findings weighted more heavily.
▼ 29.0% Below MD avg. ▼ 29.0% Below MD avg.MD average: 2.8Click the badge to see the full State ranking.Click here to see the full State ranking.
Staffing Info Measures average nursing staff hours per resident per day, including Registered Nurses (RNs) and total nursing staff. Ratings are adjusted based on the level of care residents require and are compared to state and national benchmarks.
▼ 67.2% Below MD avg. ▼ 67.2% Below MD avg.MD average: 3.0Click the badge to see the full State ranking.Click here to see the full State ranking.
Quality Measures Info Based on clinical and physical health indicators reported to CMS, such as hospital readmissions, falls, pressure ulcers, and improvements in mobility. These measures reflect how well residents' health needs are being managed.
▲ 8.2% Above MD avg. ▲ 8.2% Above MD avg.MD average: 3.7Click the badge to see the full State ranking.Click here to see the full State ranking.

Staffing hours breakdown

Info Daily nursing hours per resident by staff type, reported to CMS. Higher is generally better — compare this facility to state and national averages to see where staffing stands.

Hours per resident per day — compared to Maryland state averages

Total nursing care / resident Info This home is ranked 79th out of 144 homes in Maryland for nurse hours. Total adjusted nursing hours per resident per day, combining RN, LPN, and aide time. CMS adjusts this for case-mix so facilities can be fairly compared.
3h 22m per day
Rank #79 / 144Nurse hours — State benchmarkedThis home is ranked 79th out of 144 homes in Maryland. Shows adjusted nurse hours per resident per day benchmarked to the Maryland average, with a ranking across 144 Maryland facilities. More hours mean more direct care. The national average is about 3.5 hrs; below 3.0 is a red flag.Click the rank badge to see the full State ranking.Click here to see the full State ranking.
This facility Maryland avg (3h 46m per day)
vs Maryland avg
-11%

5 of 6 metrics below state avg

Standout metric LPN / LVN is +24% above state avg
Staff typeHours / Day / Residentvs state avg
Registered Nurse (RN) Info RNs hold the highest nursing license and can assess residents, interpret test results, and direct care plans. More RN hours per day often signals stronger clinical oversight and faster response to health changes. 17m per day ▼ 66% State avg: 50m per day · National avg: 41m per day
LPN / LVN Info Licensed Practical Nurses (LPNs) or Licensed Vocational Nurses (LVNs) deliver routine hands-on care — medication administration, wound dressing, and monitoring vital signs. They work under RN supervision and make up a large share of daily bedside care. 1h 7m per day ▲ 24% State avg: 54m per day · National avg: 52m per day
Nurse Aide Info Certified Nurse Aides (CNAs) provide the most direct day-to-day assistance: bathing, dressing, feeding, and mobility. Nurse aide hours are typically the largest staffing category and directly affect residents' quality of life. 1h 53m per day ▼ 13% State avg: 2h 10m per day · National avg: 2h 21m per day
Weekend Total Nursing Info Combined nursing hours (RN + LPN + Nurse Aide) per resident per day on weekends. Staffing often drops on weekends — this figure reveals whether the facility maintains adequate coverage outside of weekday hours. 2h 57m per day ▼ 15% State avg: 3h 29m per day · National avg: 3h 26m per day
Physical Therapist Info Hours per resident per day provided by licensed Physical Therapists (PTs) or PT Assistants. PT services help residents recover mobility after injury or illness and are especially important for post-acute (short-stay) rehabilitation. 3m per day ▼ 39% State avg: 5m per day · National avg: 4m per day
Weekend RN Info Registered nurse hours specifically on weekends. Facilities sometimes reduce RN presence on Saturdays and Sundays — a low weekend RN figure compared to weekday hours can indicate reduced clinical oversight when most administrative staff are absent. 14m per day ▼ 63% State avg: 37m per day · National avg: 29m per day

Capacity and availability

This home usually has availability

Higher occupancy than the Maryland average: 82.4%
Occupancy rate
84.3% Rank #74 / 146Occupancy rate — State benchmarkedThis home is ranked 74th out of 146 homes in Maryland. Shows this facility's occupancy rate versus the Maryland average, with its Statewide rank out of 146. Higher occupancy signals strong local demand and financial stability.Click the rank badge to see the full State ranking.Click here to see the full State ranking.
Avg. Length of Stay
100 days
Walk Score
Walk Score: 81 / 100 Rank #86 / 985Walk Score — State benchmarkedThis home is ranked 86th out of 985 homes in Maryland. Shows how walkable this facility's neighborhood is compared to the average Walk Score across Maryland facilities. Higher scores benefit residents, families, and staff.Click the rank badge to see the full State ranking.Click here to see the full State ranking.
Very walkable. Most errands can be accomplished on foot, and many essentials are within a short walk.

Contact Autumn Lake Healthcare at Homewood Center

Staffing Data

Reporting period: October 1 – December 31, 2025 (Q4 2025). Source: CMS Payroll-Based Journal report.

Total staff 259
Employees 97
Contractors 162
Staff to resident ratio 2.76 : 1
52% more staff per resident than Maryland average
Maryland average ratio: 1.81 : 1 Maryland average ratio: 1.81 : 1See full Maryland ranking
Avg staff/day 49
Average shift 8.1 hours
0% compared with Maryland average
Maryland average: 8 hours Maryland average shift: 8 hoursSee full Maryland ranking
Total staff hours (quarter) 36,570

Nursing staff breakdown

Q4 2025 · Oct 1 – Dec 31 More info This data comes from the CMS Payroll-Based Journal report covering October 1 – December 31, 2025.
Registered Nurse

Manages medical care and health needs.

RN Staff Info 20 total: 7 full-time employees and 13 contractors. 20
Average shift length Info Average shift length. Calculated as total hours divided by days worked and average staff per day. 8.3 hours
Licensed Practical Nurse

Assists with medical care and medications.

LPN Staff Info 116 total: 16 full-time employees and 100 contractors. 116
Average shift length Info Average shift length. Calculated as total hours divided by days worked and average staff per day. 9.4 hours
Certified Nursing Assistant

Helps with daily care and mobility.

CNA Staff Info 99 total: 57 full-time employees and 42 contractors. 99
Average shift length Info Average shift length. Calculated as total hours divided by days worked and average staff per day. 7.6 hours

Contractor staffing

Q4 2025 · Oct 1 – Dec 31 More info This data comes from the CMS Payroll-Based Journal report covering October 1 – December 31, 2025.

Total hours from contractors

27.3%

9,974 contractor hours this quarter

Licensed Practical Nurse: 100 Certified Nursing Assistant: 42 Registered Nurse: 13 Physical Therapy Aide: 2 Qualified Social Worker: 2 Respiratory Therapy Technician: 1 Speech Language Pathologist: 1 Physical Therapy Assistant: 1

Staff by category

Q4 2025 · Oct 1 – Dec 31 More info This data comes from the CMS Payroll-Based Journal report covering October 1 – December 31, 2025.
Certified Nursing Assistant57429916,66092100%7.6
Licensed Practical Nurse161001169,50992100%9.4
Registered Nurse713201,5808997%8.3
Medication Aide/Technician4041,2928188%7.4
Clinical Nurse Specialist4041,1136773%7.4
RN Director of Nursing3031,0776672%7.5
Physical Therapy Aide0229276672%7.7
Other Dietary Services Staff2028667582%7.6
Dental Services Staff2028516470%7.4
Administrator1015206571%8
Respiratory Therapy Technician0114806065%8
Physical Therapy Assistant0114806166%7.9
Speech Language Pathologist0114676065%7.8
Dietitian1014586166%7.5
Qualified Social Worker0222923841%7.3
99 Certified Nursing Assistant
% of Days 100%
116 Licensed Practical Nurse
% of Days 100%
20 Registered Nurse
% of Days 97%
4 Medication Aide/Technician
% of Days 88%
4 Clinical Nurse Specialist
% of Days 73%
3 RN Director of Nursing
% of Days 72%
2 Physical Therapy Aide
% of Days 72%
2 Other Dietary Services Staff
% of Days 82%
2 Dental Services Staff
% of Days 70%
1 Administrator
% of Days 71%
1 Respiratory Therapy Technician
% of Days 65%
1 Physical Therapy Assistant
% of Days 66%
1 Speech Language Pathologist
% of Days 65%
1 Dietitian
% of Days 66%
2 Qualified Social Worker
% of Days 41%

Penalties and fines

Federal penalties imposed by CMS for regulatory violations, including civil money penalties (fines) and denials of payment for new Medicare/Medicaid admissions.

Source: CMS Penalties Database

No penalties in the past 3 years

No civil money penalties or payment denials were reported in the last 3 years.

Quality of care over time

These measures show how residents usually do over time at this home, based on health outcomes and preventive care.

High-risk clinical events score Info A composite score based on pressure ulcers, falls with injury, weight loss, walking ability decline, and activities of daily living decline. 9.5
27% better than Maryland average

Maryland average: 12.9

Functional decline score Info A composite score based on activities of daily living decline, walking ability decline, and incontinence. 22.0
14% better than Maryland average

Maryland average: 25.7

Long-stay resident measures
Above average Maryland avg: 3.7 Info CMS star rating based on long-stay quality measure performance. 5 stars = significantly above average, 1 star = significantly below average.
Need for Help with Daily Activities Increased Info Percent of long-stay residents whose need for help with daily activities has increased 18.1%
24% better than Maryland average

Maryland average: 23.7%

Walking Ability Worsened Info Percent of long-stay residents whose ability to move independently worsened 16.7%
40% better than Maryland average

Maryland average: 27.7%

Low Risk Residents with Bowel/Bladder Incontinence Info Percent of low risk long-stay residents who lose control of their bowels or bladder 31.3%
21% worse than Maryland average

Maryland average: 25.9%

Falls with Major Injury Info Percent of long-stay residents experiencing one or more falls with major injury 1.1%
51% better than Maryland average

Maryland average: 2.3%

High Risk Residents with Pressure Ulcers Info Percent of long-stay high risk residents with pressure ulcers 3.9%
40% better than Maryland average

Maryland average: 6.5%

Urinary Tract Infection Info Percent of long-stay residents with a urinary tract infection 2.0%
24% worse than Maryland average

Maryland average: 1.6%

Lost Too Much Weight Info Percent of long-stay residents who lose too much weight 7.5%
29% worse than Maryland average

Maryland average: 5.8%

Depressive Symptoms Info Percent of long-stay residents who have depressive symptoms 18.5%
9% better than Maryland average

Maryland average: 20.2%

Antipsychotic Use Info Percent of long-stay residents who received an antipsychotic medication 7.0%
46% better than Maryland average

Maryland average: 12.9%

Pneumococcal Vaccine Info Percent of long-stay residents assessed and appropriately given the pneumococcal vaccine 92.7%
In line with Maryland average

Maryland average: 92.0%

Influenza Vaccine Info Percent of long-stay residents assessed and appropriately given the seasonal influenza vaccine 96.9%
In line with Maryland average

Maryland average: 96.6%

Short-stay resident measures
Above average Maryland avg: 3.7 Info CMS star rating based on short-stay quality measure performance. 5 stars = much above average, 1 star = much below average.
Pneumococcal Vaccine Info Percent of short-stay residents assessed and appropriately given the pneumococcal vaccine 57.1%
27% worse than Maryland average

Maryland average: 78.4%

Antipsychotic medication increase Info Percent of short-stay residents who newly received an antipsychotic medication 1.2%
14% better than Maryland average

Maryland average: 1.4%

Influenza Vaccine Info Percent of short-stay residents assessed and appropriately given the seasonal influenza vaccine 65.0%
19% worse than Maryland average

Maryland average: 80.6%

Re-hospitalized after SNF stay Info Percentage of short-stay residents who were re-hospitalized after their nursing home admission. 23.7%
12% worse than Maryland average

Maryland average: 21.2%

Emergency department visits Info Percentage of short-stay residents who had an outpatient emergency department visit. 6.2%
37% better than Maryland average

Maryland average: 9.9%

Falls with major injury Info Percentage of SNF residents who experience falls with major injury during their stay. 1.6%
113% worse than Maryland average

Maryland average: 0.8%

Ability to care for self at discharge Info Percentage of residents at or above expected ability to care for themselves at discharge. 52.8%
In line with Maryland average

Maryland average: 53.7%

Successful return to home or community Info Rate of successful return to home or community from a skilled nursing facility. 48.6%
In line with Maryland average

Maryland average: 50.6%

Breakdown by payment type

Medicare

28% of new residents, usually for short-term rehab.

Typical stay 1 - 2 months

Private pay

45% of new residents, often for short stays.

Typical stay 1 months

Medicaid

27% of new residents, often for long-term daily care.

Typical stay 9 - 10 months

Facility Characteristics

Source: CMS Long-Term Care Facility Characteristics (Data as of Jan 2026)

Total residents 94
Medicare
11
11.7% of residents
Medicaid
82
87.2% of residents
Private pay or other
1
1.1% of residents
Programs & Services
Residents Group

Residents meet regularly to discuss policies, care quality, and activities

Active Resident Council

Organized group of residents that meets regularly to discuss facility policies, quality of life, and activities.

Finances and operations

Based on the 2023 CMS SNF Cost Report.

Voluntary non-profit community
Home revenue
$15.3M
Surplus of revenue
$1.1M
Voluntary non-profit community
Home revenue
$15.3M Rank #104 / 145Revenue — State benchmarkedThis home is ranked 104th out of 145 homes in Maryland. Shows this facility's annual revenue compared to the Maryland average. Higher revenue generally means more resources for staffing and capital — read alongside Payroll %.Click the rank badge to see the full State ranking.Click here to see the full State ranking.
Surplus of revenue
$1.1M
Payroll costs Info The portion of the home's budget spent on staff, including nurses, caregivers, and other employees who support care and operations. Rank #113 / 145Payroll — State benchmarkedThis home is ranked 113th out of 145 homes in Maryland. Shows total annual staff payroll benchmarked to the Maryland average. Higher payroll investment relative to peers often signals better staffing and less reliance on cheaper contract labor.Click the rank badge to see the full State ranking.Click here to see the full State ranking.
$6.2M
40.4% of revenue Rank #107 / 145Payroll % — State benchmarkedThis home is ranked 107th out of 145 homes in Maryland. Shows payroll as a percentage of revenue versus the Maryland average. Well-run Maryland facilities typically land around 49–57% — the top third Statewide. Below 25% may signal understaffing or heavy agency use — read with Staffing ratings.Click the rank badge to see the full State ranking.Click here to see the full State ranking.
Other operating costs Info All remaining costs needed to run the home, such as food, utilities, building maintenance, supplies and administrative expenses.
$8.0M
Total costs $14.2M

What does this home offer?

Housing options icon

Housing Options: Private / Semi-Private Rooms

Building type icon
Building type icon

Building Type: Single-story
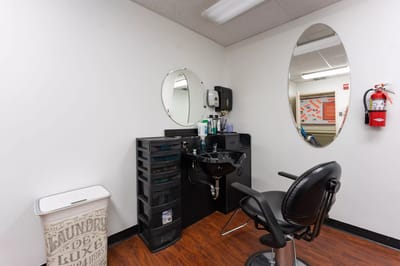
Beauty services icon

Beauty Services

Social and recreational activities icon

Social and Recreational Activities

On-site medical care and health services icon

On-site Medical Care and Health Services

Who this home usually serves

TYPE OF STAY

Mix of rehab and long-term care

This home supports both short-term rehab and long-term care, with residents staying for a wide range of durations.

New residents most often arrive under private pay (45% of admissions), and a typical private pay stay runs around 1 months.

Admissions
351 total

Coverage residents most often arrive under.

Medicare 28%
Private pay 45%
Medicaid 27%
Discharges
346 total

Coverage residents most often leave under.

Medicare 20%
Private pay 45%
Medicaid 35%

Places of interest near Autumn Lake Healthcare at Homewood Center

Address 5.6 miles from city center Info Estimated distance in miles from Baltimore's city center to Autumn Lake Healthcare at Homewood Center's address, calculated via Google Maps. — 1.58 miles to nearest hospital (MedStar Good Samaritan Hospital)

Calculate Travel Distance to Autumn Lake Healthcare at Homewood Center

Add your location

Address

Financial Assistance for
Nursing Home in Maryland

Autumn Lake Healthcare at Homewood Center is located in Baltimore, Maryland.
Here are the financial assistance programs available to residents in Maryland.

Get Financial aid guidance

Community Options Waiver

Maryland Medicaid Community Options Waiver

Age 65+ or disabled
General Maryland resident, Medicaid- eligible, nursing home-level care need.
Income Limits (2025) ~$2,829/month 300% FBR, individual
Asset Limits $2,000 (individual), $3,000 (couple) (excludes home, car).
MD

High urban demand; rural outreach efforts.

Benefits
Personal care (5-7 hours/day, e.g., bathing, dressing) Respite care (up to 240 hours/year) Adult day care ($70/day) Home modifications ($1,500 avg.)

Senior Care Program

Maryland Senior Care

Age 65+
General Maryland resident, at risk of nursing home placement.
Income Limits ~$2,000/month individual, varies by county
Asset Limits $11,000 individual
MD

Limited funding; waitlists common in high-demand areas.

Benefits
In-home care (3-5 hours/week) Respite care (up to 10 days/year) Meals (~$6/meal) Transportation (~5 trips/month) Case management

Maryland Nursing Home Medicaid

Maryland Medical Assistance (Medicaid) Nursing Home Program

Age 65+
General Maryland resident, Medicaid-eligible, requires nursing home-level care.
Income Limits (2025) $943/month (individual); most income applied to care costs.
Asset Limits $2,500 (individual), $3,000 (couple); spousal protections up to $155,356.
MD

Home equity limit $636,000; estate recovery applies post-55.

Benefits
24/7 nursing care Meals Therapy Medications (unlimited per medical need)

Senior Assisted Living Subsidy Program

Maryland Senior Assisted Living Group Home Subsidy

Age 62+
General Maryland resident, in or moving to approved assisted living, low/moderate income.
Income Limits (2025) ~$34,000/year individual, varies by county
Asset Limits Not strict; prioritizes low-income.
MD

Not available statewide; facility must be licensed by MDH.

Benefits
Personal care Meals 24-hour supervision (up to $1,500/month subsidy typical)

Veterans Aid and Attendance (A&A) Benefit

Maryland VA Aid and Attendance

Age
General Wartime veteran/spouse, age 65+ or disabled, needs ADL help, Maryland resident.
Income Limits (2025) Net income minus medical expenses < $1,984/month individual with A&A
Asset Limits $155,356 net worth limit
MD

High veteran population in suburban/rural areas.

Benefits
Cash benefit ($1,478-$2,471/month, varies by status) for care costs

Senior Prescription Drug Assistance Program (SPDAP)

Maryland Senior Prescription Drug Assistance Program

Age 65+
General Maryland resident (6+ months), Medicare Part D enrolled.
Income Limits (2025) $48,560/year individual, 300% FPL
Asset Limits None specified.
MD

Supplements Medicare Part D; annual enrollment required.

Benefits
Up to $40/month premium subsidy Reducing drug costs

Medicare Savings Programs (MSP)

Maryland Medicare Savings Programs

Age 65+
General Maryland resident, Medicare Part A/B enrollee.
Income Limits (2025) $2,014/month (QMB), $2,706/month (SLMB/QI, individual).
Asset Limits $9,090 (individual), $13,630 (couple).
MD

Includes QMB, SLMB, QI categories.

Benefits
Covers premiums (up to $174.70/month Part B) Co-pays Deductibles

Community Personal Assistance Services (CPAS)

Maryland Medicaid Community Personal Assistance Services

Age 65+
General Maryland resident, Medicaid-eligible, needs ADL assistance.
Income Limits (2025) $943/month (individual); spend-down available.
Asset Limits $2,500 (individual), $3,000 (couple).
MD

Consumer-directed option allows hiring family caregivers.

Benefits
Personal care (hours vary, typically 20-30/week) Chores Nurse supervision

Compare Nursing Home around Baltimore

The information below is reported by the Maryland Department of Health, Office of Health Care Quality.

5 facilities compared · CMS & MD Dept. of Health data

Autumn Lake Healthcare at Alice Manor
NH

Nursing Home Licensed facility providing 24/7 skilled nursing care for residents with complex, ongoing medical needs. Staffed by RNs, LPNs, and CNAs. Inspected and star-rated annually by CMS. Accepts Medicare (short-term rehab) and Medicaid (long-term care).

HC

Home Care Professional care delivered in the person's own home — from companionship and errands to skilled nursing and therapy. Allows seniors to age in place. Medicare covers skilled home health when medically necessary.

PC

Palliative Care

RC

Respite Care Short-term temporary care — days to weeks — to give family caregivers a break. Full care provided during the stay. Often used after hospitalization or to trial a facility before a permanent placement decision.

Baltimore (Woodberry)
105
Facility 105
MD AVG 43
Rank #107 / 697
81.7%
Facility 81.7%
MD AVG 82.4%
Rank #84 / 146
-1%
3.47
Facility 3.47
MD AVG 3.77
Rank #68 / 144
-51%-8%
$0
Facility $0
MD AVG $65.0k
Rank #1 / 146
54
Facility 54
MD AVG 49.9
Rank #97 / 146
13.5
Facility 13.5
MD AVG 12.8
Rank #93 / 146
195-
59
Facility 59
MD AVG 43
Rank #327 / 985
Alice Operator LLC
$12.9M
Facility $12.9M
MD AVG $18.7M
Rank #115 / 145
$6.4M
Facility $6.4M
MD AVG $6.5M
Rank #109 / 145
49.6%
Facility 49.6%
MD AVG 38.5%
Rank #43 / 145
215215
Resorts of Augsburg
NH

Nursing Home Licensed facility providing 24/7 skilled nursing care for residents with complex, ongoing medical needs. Staffed by RNs, LPNs, and CNAs. Inspected and star-rated annually by CMS. Accepts Medicare (short-term rehab) and Medicaid (long-term care).

AL

Assisted Living A licensed, long-term care setting for seniors or individuals with disabilities who need help with daily activities — like bathing, dressing, and medication management — but not 24-hour skilled nursing. Offers housing, meals, and around-the-clock support while aiming to maximize resident independence.

IL

Independent Living Lifestyle-focused communities for older adults offering dining, activities, and transportation with minimal personal care. Best for active, independent seniors who want community without medical support.

Baltimore (Gwynn Oak)
131
Facility 131
MD AVG 43
Rank #64 / 697
89.4%
Facility 89.4%
MD AVG 82.4%
Rank #41 / 146
+9%
4.17
Facility 4.17
MD AVG 3.77
Rank #28 / 144
-11%+11%
$23.9k
Facility $23.9k
MD AVG $65.0k
Rank #114 / 146
37
Facility 37
MD AVG 49.9
Rank #60 / 146
12.3
Facility 12.3
MD AVG 12.8
Rank #80 / 146
-120-
18
Facility 18
MD AVG 43
Rank #756 / 985
-
$22.6M
Facility $22.6M
MD AVG $18.7M
Rank #48 / 145
$13.6M
Facility $13.6M
MD AVG $6.5M
Rank #25 / 145
60.2%
Facility 60.2%
MD AVG 38.5%
Rank #10 / 145
215193
Autumn Lake Healthcare at BridgePark
NH

Nursing Home Licensed facility providing 24/7 skilled nursing care for residents with complex, ongoing medical needs. Staffed by RNs, LPNs, and CNAs. Inspected and star-rated annually by CMS. Accepts Medicare (short-term rehab) and Medicaid (long-term care).

HC

Home Care Professional care delivered in the person's own home — from companionship and errands to skilled nursing and therapy. Allows seniors to age in place. Medicare covers skilled home health when medically necessary.

PC

Palliative Care

RC

Respite Care Short-term temporary care — days to weeks — to give family caregivers a break. Full care provided during the stay. Often used after hospitalization or to trial a facility before a permanent placement decision.

Baltimore (Central Forest Park)
106
Facility 106
MD AVG 43
Rank #105 / 697
88.9%
Facility 88.9%
MD AVG 82.4%
Rank #47 / 146
+8%
3.77
Facility 3.77
MD AVG 3.77
Rank #46 / 144
-4%0%
$0
Facility $0
MD AVG $65.0k
Rank #1 / 146
71
Facility 71
MD AVG 49.9
Rank #121 / 146
17.8
Facility 17.8
MD AVG 12.8
Rank #121 / 146
184B-
69
Facility 69
MD AVG 43
Rank #199 / 985
Bp Capital
$16.8M
Facility $16.8M
MD AVG $18.7M
Rank #89 / 145
$7.7M
Facility $7.7M
MD AVG $6.5M
Rank #85 / 145
45.9%
Facility 45.9%
MD AVG 38.5%
Rank #60 / 145
215195
Stadium Place Nursing and Rehab Center
NH

Nursing Home Licensed facility providing 24/7 skilled nursing care for residents with complex, ongoing medical needs. Staffed by RNs, LPNs, and CNAs. Inspected and star-rated annually by CMS. Accepts Medicare (short-term rehab) and Medicaid (long-term care).

Baltimore (Ednor Gardens-Lakeside)
100
Facility 100
MD AVG 43
Rank #117 / 697
41.7%
Facility 41.7%
MD AVG 82.4%
Rank #140 / 146
-49%
3.23
Facility 3.23
MD AVG 3.77
Rank #102 / 144
-51%-14%
$16.6k
Facility $16.6k
MD AVG $65.0k
Rank #1 / 146
55
Facility 55
MD AVG 49.9
Rank #99 / 146
13.8
Facility 13.8
MD AVG 12.8
Rank #96 / 146
253-
72
Facility 72
MD AVG 43
Rank #160 / 985
-
$6.0M
Facility $6.0M
MD AVG $18.7M
Rank #141 / 145
$3.4M
Facility $3.4M
MD AVG $6.5M
Rank #138 / 145
57.1%
Facility 57.1%
MD AVG 38.5%
Rank #16 / 145
215232
Autumn Lake Healthcare at Homewood Center
NH

Nursing Home Licensed facility providing 24/7 skilled nursing care for residents with complex, ongoing medical needs. Staffed by RNs, LPNs, and CNAs. Inspected and star-rated annually by CMS. Accepts Medicare (short-term rehab) and Medicaid (long-term care).

PC

Palliative Care

RC

Respite Care Short-term temporary care — days to weeks — to give family caregivers a break. Full care provided during the stay. Often used after hospitalization or to trial a facility before a permanent placement decision.

Baltimore (Homeland)
112
Facility 112
MD AVG 43
Rank #95 / 697
84.3%
Facility 84.3%
MD AVG 82.4%
Rank #74 / 146
+2%
3.37
Facility 3.37
MD AVG 3.77
Rank #79 / 144
-44%-11%
$0
Facility $0
MD AVG $65.0k
Rank #1 / 146
72
Facility 72
MD AVG 49.9
Rank #122 / 146
24.0
Facility 24.0
MD AVG 12.8
Rank #139 / 146
-104-
81
Facility 81
MD AVG 43
Rank #86 / 985
56 West Frederick Holdco LLC
$15.3M
Facility $15.3M
MD AVG $18.7M
Rank #104 / 145
$6.2M
Facility $6.2M
MD AVG $6.5M
Rank #113 / 145
40.4%
Facility 40.4%
MD AVG 38.5%
Rank #107 / 145
215074

Frequently Asked Questions about Autumn Lake Healthcare at Homewood Center

What neighborhood is Autumn Lake Healthcare at Homewood Center in?

Autumn Lake Healthcare at Homewood Center is in the Homeland neighborhood.

Is Autumn Lake Healthcare at Homewood Center in a walkable area?

Autumn Lake Healthcare at Homewood Center has a walk score of 81. Very walkable. Most errands can be accomplished on foot, and many essentials are within a short walk.

What is the occupancy rate at Autumn Lake Healthcare at Homewood Center?

Autumn Lake Healthcare at Homewood Center's occupancy is 84.3%.

Are there photos of Autumn Lake Healthcare at Homewood Center?

Yes — there are 6 photos of Autumn Lake Healthcare at Homewood Center in the photo gallery on this page.

What is the address of Autumn Lake Healthcare at Homewood Center?

Autumn Lake Healthcare at Homewood Center is located at 6000 Bellona Ave, Baltimore, MD 21212, United States.

What is the phone number of Autumn Lake Healthcare at Homewood Center?

(410) 323-4223 will put you in contact with the team at Autumn Lake Healthcare at Homewood Center.

Is Autumn Lake Healthcare at Homewood Center Medicare or Medicaid certified?

Yes — Autumn Lake Healthcare at Homewood Center is a CMS-certified provider of Medicare and Medicaid.

Guides for Better Senior Living

Care Cost Calculator: See Prices in Your Area

Nursing Home Data Explorer

Don’t Wait Too Long: 7 Red Flag Signs Your Parent Needs Assisted Living Now

The True Cost of Assisted Living in 2025 – And How Families Are Paying For It

Understanding Senior Living Costs: Pricing Models, Discounts & Financial Assistance

Explore Open Rooms
1 Contact details
2 What type of senior care service are you looking for?
3 What budget do you have in mind for senior care?
4 How soon do you need to find care?
5 Additional details

Thank you for your interest!

Our team will be in touch shortly to help with next steps.