Glenwood Center
Nursing Home, Skilled Nursing & Memory Care · Alabama, AL
CMS overall rating Info The Overall CMS Rating is scored from 1 to 5 stars and combines results from health inspections, staffing levels, and quality measures. Health inspections carry the most weight. Staffing and quality scores can increase or decrease the final rating based on performance compared to state and national standards.

Glenwood Center

Nursing Home, Skilled Nursing & Memory Care · Alabama, AL
CMS overall rating Info The Overall CMS Rating is scored from 1 to 5 stars and combines results from health inspections, staffing levels, and quality measures. Health inspections carry the most weight. Staffing and quality scores can increase or decrease the final rating based on performance compared to state and national standards.
Calculator: See prices in your area
Glenwood Center accepts Medicare, Medicaid, and private pay.

Overview of Glenwood Center

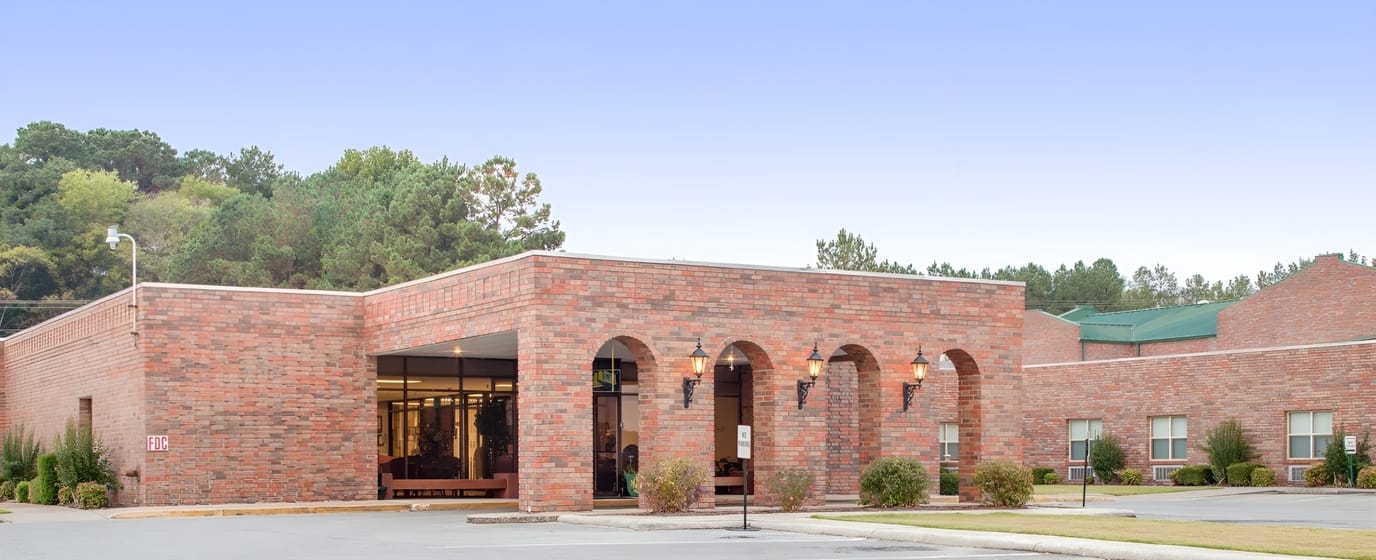
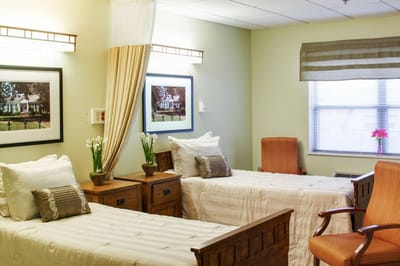
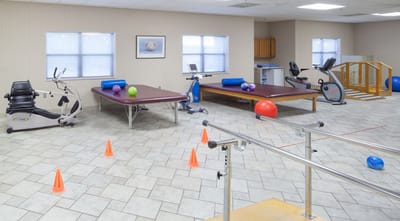
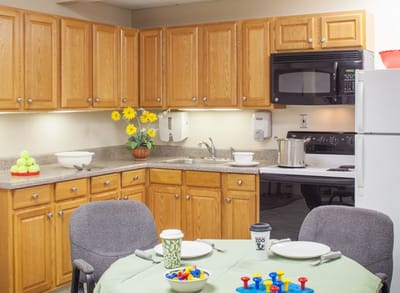
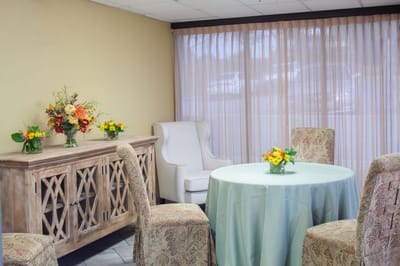
Glenwood Center is a well-regarded 125-bed nursing home in Florence, AL, that offers a wide range of care, including short-term rehabilitation, memory care, long-term care, and respite care. Fostering healing and recovery, the community has spacious private and semi-private rooms set in a supportive and welcoming environment. An on-site medical director, as well as a nurse practitioner, oversee residents’ care, while dietary management, medication management, and 24-hour emergency alert are also provided to improve their quality of life. The community also works closely with residents to meet their unique needs through personalized care plans.

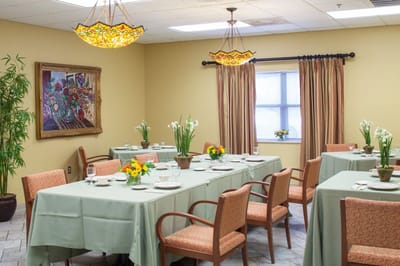
Social gatherings, cultural programs, and educational activities help enhance residents’ memory and stay active. Residents can also use the community’s state-of-the-art amenities, such as the sun room, cafe, and lounge areas, to rest and interact with friends. Shoals Pediatric Group, a bank, shops, and restaurants are also available in the area, providing residents with quick access to their needs and leisure. With its extensive amenities and great services, this nursing home has become one of the frontrunners for senior living in Alabama.

(256) 766-8963

Quality ratings

Measured by Centers for Medicare & Medicaid Services (CMS)

Overall rating Info The Overall CMS Rating combines results from health inspections, staffing levels and quality measures. Health inspections carry the most weight. Staffing and quality scores can increase or decrease the final rating based on performance compared to state and national standards.
▼ 66.0% Below AL avg. ▼ 66.0% Below AL avg.Click the badge to see the full State ranking.Click here to see the full State ranking.
Health Inspection Info Based on the results of the facility's three most recent standard inspections and any complaint investigations. CMS reviews the number, scope, and severity of deficiencies, with more recent findings weighted more heavily.
▼ 64.7% Below AL avg. ▼ 64.7% Below AL avg.Click the badge to see the full State ranking.Click here to see the full State ranking.
Staffing Info Measures average nursing staff hours per resident per day, including Registered Nurses (RNs) and total nursing staff. Ratings are adjusted based on the level of care residents require and are compared to state and national benchmarks.
▼ 15.3% Below AL avg. ▼ 15.3% Below AL avg.Click the badge to see the full State ranking.Click here to see the full State ranking.
Quality Measures Info Based on clinical and physical health indicators reported to CMS, such as hospital readmissions, falls, pressure ulcers, and improvements in mobility. These measures reflect how well residents' health needs are being managed.
At AL avg. At AL avg.Click the badge to see the full State ranking.Click here to see the full State ranking.

Staffing hours breakdown

Info Daily nursing hours per resident by staff type, reported to CMS. Higher is generally better — compare this facility to state and national averages to see where staffing stands.

Hours per resident per day — compared to Alabama state averages

Total nursing care / resident Info This home is ranked 126th out of 130 homes in Alabama. Total adjusted nursing hours per resident per day, combining RN, LPN, and aide time. CMS adjusts this for case-mix so facilities can be fairly compared.
3h 7m per day
Rank #126 / 130Nurse hours — State benchmarkedThis home is ranked 126th out of 130 homes in Alabama. Shows adjusted nurse hours per resident per day benchmarked to the Alabama average, with a ranking across 130 Alabama SNFs. More hours mean more direct care. The national average is about 3.5 hrs; below 3.0 is a red flag.Click the rank badge to see the full State ranking.Click here to see the full State ranking.
This facility Alabama avg (4h 22m per day)
vs Alabama avg
-29%

5 of 6 metrics below state avg

Standout metric Registered Nurse (RN) is +21% above state avg
Staff typeHours / Day / Residentvs state avg
Registered Nurse (RN) Info RNs hold the highest nursing license and can assess residents, interpret test results, and direct care plans. More RN hours per day often signals stronger clinical oversight and faster response to health changes. 46m per day ▲ 21% State avg: 38m per day · National avg: 41m per day
LPN / LVN Info Licensed Practical Nurses (LPNs) or Licensed Vocational Nurses (LVNs) deliver routine hands-on care — medication administration, wound dressing, and monitoring vital signs. They work under RN supervision and make up a large share of daily bedside care. 34m per day ▼ 28% State avg: 47m per day · National avg: 52m per day
Nurse Aide Info Certified Nurse Aides (CNAs) provide the most direct day-to-day assistance: bathing, dressing, feeding, and mobility. Nurse aide hours are typically the largest staffing category and directly affect residents' quality of life. 1h 48m per day ▼ 28% State avg: 2h 30m per day · National avg: 2h 21m per day
Weekend Total Nursing Info Combined nursing hours (RN + LPN + Nurse Aide) per resident per day on weekends. Staffing often drops on weekends — this figure reveals whether the facility maintains adequate coverage outside of weekday hours. 2h 41m per day ▼ 18% State avg: 3h 17m per day · National avg: 3h 26m per day
Physical Therapist Info Hours per resident per day provided by licensed Physical Therapists (PTs) or PT Assistants. PT services help residents recover mobility after injury or illness and are especially important for post-acute (short-stay) rehabilitation. 1m per day ▼ 50% State avg: 2m per day · National avg: 4m per day
Weekend RN Info Registered nurse hours specifically on weekends. Facilities sometimes reduce RN presence on Saturdays and Sundays — a low weekend RN figure compared to weekday hours can indicate reduced clinical oversight when most administrative staff are absent. 20m per day ▼ 9% State avg: 22m per day · National avg: 29m per day

Types of Care at Glenwood Center

Skilled Nursing Memory Care

Capacity and availability

This home usually has limited availability

Occupancy between 85% and 95% suggests balanced demand.

Higher occupancy than the Alabama average: 80.8%
Occupancy rate 85.5% Rank #62 / 132Occupancy rate — State benchmarkedThis home is ranked 62nd out of 132 homes in Alabama. Shows this facility's occupancy rate versus the Alabama average, with its Statewide rank out of 132. Higher occupancy signals strong local demand and financial stability.Click the rank badge to see the full State ranking.Click here to see the full State ranking.
Avg. Length of Stay 89 days
Occupancy rate
85.5% Rank #62 / 132Occupancy rate — State benchmarkedThis home is ranked 62nd out of 132 homes in Alabama. Shows this facility's occupancy rate versus the Alabama average, with its Statewide rank out of 132. Higher occupancy signals strong local demand and financial stability.Click the rank badge to see the full State ranking.Click here to see the full State ranking.
Avg. Length of Stay
89 days
Walk Score
Walk Score: 56 / 100 Rank #82 / 419Walk Score — State benchmarkedThis home is ranked 82nd out of 419 homes in Alabama. Shows how walkable this facility's neighborhood is compared to the average Walk Score across Alabama SNFs. Higher scores benefit residents, families, and staff.Click the rank badge to see the full State ranking.Click here to see the full State ranking.
Moderately walkable. Some errands can be accomplished on foot, with a mix of nearby amenities.

Contact Glenwood Center

Staffing Data

Reporting period: October 1 – December 31, 2025 (Q4 2025). Source: CMS Payroll-Based Journal report.

Total staff 121
Employees 113
Contractors 8
Staff to resident ratio 1.02:1
35% worse than Alabama average
Alabama average ratio: 1.56:1 Alabama average ratio: 1.56:1See full Alabama ranking
Avg staff/day 46
Average shift 8.3 hours
5% better than Alabama average
Alabama average: 7.9 hours Alabama average shift: 7.9 hoursSee full Alabama ranking
Total staff hours (quarter) 35,005

Nursing staff breakdown

Q4 2025 · Oct 1 – Dec 31 More info This data comes from the CMS Payroll-Based Journal report covering October 1 – December 31, 2025.
Registered Nurse

Manages medical care and health needs.

RN Staff 23
Average shift length Info Average shift length. Calculated as total hours divided by days worked and average staff per day. 8.4 hours

This role is partially covered by contractors.

Licensed Practical Nurse

Assists with medical care and medications.

LPN Staff 18
Average shift length Info Average shift length. Calculated as total hours divided by days worked and average staff per day. 9.5 hours

This role is partially covered by contractors.

Certified Nursing Assistant

Helps with daily care and mobility.

CNA Staff 44
Average shift length Info Average shift length. Calculated as total hours divided by days worked and average staff per day. 8.9 hours

No contractors work on this role.

Contractor staffing

Q4 2025 · Oct 1 – Dec 31 More info This data comes from the CMS Payroll-Based Journal report covering October 1 – December 31, 2025.

Total hours from contractors

2%

695 contractor hours this quarter

Occupational Therapy Aide: 2 Licensed Practical Nurse: 2 Occupational Therapy Assistant: 2 Registered Nurse: 1 Medical Director: 1

Staff by category

Q4 2025 · Oct 1 – Dec 31 More info This data comes from the CMS Payroll-Based Journal report covering October 1 – December 31, 2025.
Certified Nursing Assistant4404415,51192100%8.9
Licensed Practical Nurse162185,52392100%9.5
Registered Nurse221234,74092100%8.4
Medication Aide/Technician3031,4889199%10.6
Clinical Nurse Specialist5051,2806874%7.7
Physical Therapy Aide4041,0467480%6.4
Speech Language Pathologist3039987076%6.4
Mental Health Service Worker2029806975%7.7
Administrator1014555762%8
RN Director of Nursing1014485762%7.9
Other Social Services Staff1014476065%7.5
Nurse Practitioner2024405560%8
Other Dietary Services Staff1013945762%6.9
Qualified Social Worker3033526672%5.2
Physical Therapy Assistant2023097177%4.4
Occupational Therapy Aide0222974145%7.3
Respiratory Therapy Technician2022026874%3
Occupational Therapy Assistant022521415%3.7
Medical Director011382325%1.7
Nurse Aide in Training101511%4.5
44 Certified Nursing Assistant
% of Days 100%
18 Licensed Practical Nurse
% of Days 100%
23 Registered Nurse
% of Days 100%
3 Medication Aide/Technician
% of Days 99%
5 Clinical Nurse Specialist
% of Days 74%
4 Physical Therapy Aide
% of Days 80%
3 Speech Language Pathologist
% of Days 76%
2 Mental Health Service Worker
% of Days 75%
1 Administrator
% of Days 62%
1 RN Director of Nursing
% of Days 62%
1 Other Social Services Staff
% of Days 65%
2 Nurse Practitioner
% of Days 60%
1 Other Dietary Services Staff
% of Days 62%
3 Qualified Social Worker
% of Days 72%
2 Physical Therapy Assistant
% of Days 77%
2 Occupational Therapy Aide
% of Days 45%
2 Respiratory Therapy Technician
% of Days 74%
2 Occupational Therapy Assistant
% of Days 15%
1 Medical Director
% of Days 25%
1 Nurse Aide in Training
% of Days 1%

Penalties and fines

Federal penalties imposed by CMS for regulatory violations, including civil money penalties (fines) and denials of payment for new Medicare/Medicaid admissions.

Source: CMS Penalties Database

No penalties in the past 3 years

No civil money penalties or payment denials were reported in the last 3 years.

Quality of care over time

These measures show how residents usually do over time at this home, based on health outcomes and preventive care.

High-risk clinical events score Info A composite score based on pressure ulcers, falls with injury, weight loss, walking ability decline, and activities of daily living decline. 6.2
30% better than Alabama average

Alabama average: 8.9

Functional decline score Info A composite score based on activities of daily living decline, walking ability decline, and incontinence. 10.6
27% better than Alabama average

Alabama average: 14.5

Long-stay resident measures
Significantly above average Info CMS star rating based on long-stay quality measure performance. 5 stars = significantly above average, 1 star = significantly below average.
Need for Help with Daily Activities Increased Info Percent of long-stay residents whose need for help with daily activities has increased 7.9%
43% better than Alabama average

Alabama average: 13.9%

Walking Ability Worsened Info Percent of long-stay residents whose ability to move independently worsened 8.0%
51% better than Alabama average

Alabama average: 16.1%

Low Risk Residents with Bowel/Bladder Incontinence Info Percent of low risk long-stay residents who lose control of their bowels or bladder 16.0%
18% worse than Alabama average

Alabama average: 13.6%

Falls with Major Injury Info Percent of long-stay residents experiencing one or more falls with major injury 2.1%
37% better than Alabama average

Alabama average: 3.4%

High Risk Residents with Pressure Ulcers Info Percent of long-stay high risk residents with pressure ulcers 10.1%
70% worse than Alabama average

Alabama average: 5.9%

Urinary Tract Infection Info Percent of long-stay residents with a urinary tract infection 2.5%
8% better than Alabama average

Alabama average: 2.7%

Lost Too Much Weight Info Percent of long-stay residents who lose too much weight 3.1%
42% better than Alabama average

Alabama average: 5.4%

Depressive Symptoms Info Percent of long-stay residents who have depressive symptoms 20.9%
1604% worse than Alabama average

Alabama average: 1.2%

Antipsychotic Use Info Percent of long-stay residents who received an antipsychotic medication 10.0%
52% better than Alabama average

Alabama average: 20.7%

Pneumococcal Vaccine Info Percent of long-stay residents assessed and appropriately given the pneumococcal vaccine 99.2%
8% better than Alabama average

Alabama average: 91.5%

Influenza Vaccine Info Percent of long-stay residents assessed and appropriately given the seasonal influenza vaccine 100.0%
6% better than Alabama average

Alabama average: 94.8%

Hospitalizations per 1,000 days Info Number of hospitalizations per 1,000 long-stay resident days. 1.45
28% better than Alabama average

Alabama average: 2.00

ED visits per 1,000 days Info Number of outpatient emergency department visits per 1,000 long-stay resident days. 0.73
59% better than Alabama average

Alabama average: 1.79

Short-stay resident measures
Significantly below average Info CMS star rating based on short-stay quality measure performance. 5 stars = much above average, 1 star = much below average.
Pneumococcal Vaccine Info Percent of short-stay residents assessed and appropriately given the pneumococcal vaccine 94.2%
12% better than Alabama average

Alabama average: 83.7%

Antipsychotic medication increase Info Percent of short-stay residents who newly received an antipsychotic medication 2.1%
In line with Alabama average

Alabama average: 2.1%

Influenza Vaccine Info Percent of short-stay residents assessed and appropriately given the seasonal influenza vaccine 91.1%
13% better than Alabama average

Alabama average: 80.3%

Re-hospitalized after SNF stay Info Percentage of short-stay residents who were re-hospitalized after their nursing home admission. 24.2%
In line with Alabama average

Alabama average: 24.5%

Emergency department visits Info Percentage of short-stay residents who had an outpatient emergency department visit. 11.1%
In line with Alabama average

Alabama average: 11.5%

Falls with major injury Info Percentage of SNF residents who experience falls with major injury during their stay. 2.9%
271% worse than Alabama average

Alabama average: 0.8%

Ability to care for self at discharge Info Percentage of residents at or above expected ability to care for themselves at discharge. 38.2%
29% worse than Alabama average

Alabama average: 53.7%

Successful return to home or community Info Rate of successful return to home or community from a skilled nursing facility. 47.4%
6% worse than Alabama average

Alabama average: 50.6%

Breakdown by payment type

Medicare

36% of new residents, usually for short-term rehab.

Typical stay 29 days

Private pay

51% of new residents, often for short stays.

Typical stay 26 days

Medicaid

12% of new residents, often for long-term daily care.

Typical stay 1 - 2 years

Facility Characteristics

Source: CMS Long-Term Care Facility Characteristics (Data as of Jan 2026)

Total residents 119
Medicare
9
7.6% of residents
Medicaid
84
70.6% of residents
Private pay or other
26
21.8% of residents
Programs & Services
Residents Group

Residents meet regularly to discuss policies, care quality, and activities

Family Member Group

Family members meet regularly to discuss policies, care quality, and activities

Nurse Aide Training

State-approved Nurse Aide Training and Competency Evaluation Program on-site

Active Family Council

Organized group of family members that meets regularly to discuss facility policies, resident care, and activities.

Active Resident Council

Organized group of residents that meets regularly to discuss facility policies, quality of life, and activities.

Finances and operations

Privately-owned community
Operated by a business corporation.
Home revenue
$13.2M
Profit
$760.2K
Privately-owned community Operated by a business corporation.
Home revenue
$13.2M Rank #46 / 129Revenue — State benchmarkedThis home is ranked 46th out of 129 homes in Alabama. Shows this facility's annual revenue compared to the Alabama SNF average. Higher revenue generally means more resources for staffing and capital — read alongside Payroll %.Click the rank badge to see the full State ranking.Click here to see the full State ranking.
Profit
$760.2K
Payroll costs Info The portion of the home's budget spent on staff, including nurses, caregivers, and other employees who support care and operations. Rank #35 / 129Payroll — State benchmarkedThis home is ranked 35th out of 129 homes in Alabama. Shows total annual staff payroll benchmarked to the Alabama average. Higher payroll investment relative to peers often signals better staffing and less reliance on cheaper contract labor.Click the rank badge to see the full State ranking.Click here to see the full State ranking.
$7.2M
54.5% of revenue Rank #41 / 127Payroll % — State benchmarkedThis home is ranked 41st out of 127 homes in Alabama. Shows payroll as a percentage of revenue versus the Alabama average. Well-run Alabama SNFs typically land around 54–69% — the top third Statewide. Below 25% may signal understaffing or heavy agency use — read with Staffing ratings.Click the rank badge to see the full State ranking.Click here to see the full State ranking.
Other operating costs Info All remaining costs needed to run the home, such as food, utilities, building maintenance, supplies and administrative expenses.
$5.2M
Total costs $12.4M

What does this home offer?

Housing options icon

Housing Options: Private / Semi-Private Rooms

Building type icon
Building type icon

Building Type: Single-story

Dining services icon

Dining Services

Beauty services icon

Beauty Services

Housekeeping icon
Housekeeping icon

Housekeeping Services

Social and recreational activities icon

Social and Recreational Activities

Exercise program icon

Exercise Programs

Who this home usually serves

TYPE OF STAY

Mix of rehab and long-term care

This home supports both short-term rehab and long-term care, with residents staying for a wide range of durations.

Places of interest near Glenwood Center

Address 4.2 miles from city center Info Estimated distance in miles from Florence's city center to Glenwood Center's address, calculated via Google Maps.

Calculate Travel Distance to Glenwood Center

Add your location

Address

Financial Assistance for
Nursing Home in Alabama

Glenwood Center is located in Florence, Alabama.
Here are the financial assistance programs available to residents in Alabama.

Get Financial aid guidance

Elderly and Disabled Waiver

Alabama Medicaid E&D Waiver

Age 65+ or disabled
General Alabama resident, Medicaid-eligible, requires nursing home-level care but can live in community with support.
Income Limits (2025) ~$2,829/month 300% FBR, individual
Asset Limits $2,000 (individual), $3,000 (couple) (excludes home, car).
AL

Must be assessed by a nurse for nursing home-level care need.

Benefits
In-home personal care (4-6 hours/day, e.g., bathing, dressing) Respite care (up to 240 hours/year) Adult day care (~$50/day avg.) Home-delivered meals Case management

Alabama Respite for Caregivers Program

Alabama Respite (via NFCSP)

Age Caregiver of someone 60+ (or with dementia)
General Alabama resident.
Income Limits No strict limit; prioritizes low-income.
Asset Limits Not applicable.
AL

Focus on rural caregivers; limited funding.

Benefits
In-home respite (4-6 hours/day) Adult day care (~$50/day) Short-term facility care (up to 5 days)

SenioRx Prescription Assistance Program

AL SenioRx

Age 55+
General Alabama resident, chronic illness requiring daily medication, not fully covered by other drug plans.
Income Limits ~$3,000/month individual, varies by AAA
Asset Limits Not strictly enforced; income-focused.
AL

High ROI; saved $43.5M for 6,825 participants in FY 2022.

Benefits
Prescription cost reduction (avg. $6,300/year savings per participant) Medication management support

Weatherization Assistance Program (WAP)

AL WAP

Age 60+ priority
General Alabama resident, own or rent home, low-income status.
Income Limits (2025) ~$2,510/month 200% of poverty level, individual
Asset Limits Not applicable; income-driven.
AL

Prioritizes seniors and disabled; limited annual funding.

Benefits
Insulation Weather stripping HVAC repairs (avg. $500-$1,000 in annual energy savings)

Section 202 Supportive Housing for the Elderly

AL Section 202

Age 62+
General Alabama resident, very low income, able to live independently with support.
Income Limits (2025) ~$1,500/month 50% of area median income, individual, varies by county
Asset Limits $10,000 individual, excludes home if owned
AL

High demand in urban areas like Birmingham; limited units statewide.

Benefits
Subsidized rent (30% of income, e.g., $300-$500/month) On-site services (housekeeping, transportation, ~$200/month value)

Alabama CARES Program

AL CARES

Age
General Caregivers of Alabama residents aged 60+ needing assistance with 3+ daily activities; no age limit for caregivers.
Income Limits No strict limit; cost-sharing based on recipient’s income e.g., ~$2,500/month threshold
Asset Limits Not applicable; focus on need.
AL

Prioritizes caregivers with greatest economic/social need; complements respite programs like AL Lifespan Respite.

Benefits
Respite care (up to 10 days/year) Counseling (4-6 sessions/year) Training (2-3 workshops/year) Supplemental supplies (e.g., $200/year avg.)

Compare Nursing Home around Colbert County

The information below is reported by the Alabama Department of Public Health, Bureau of Health Provider Standards.

4 facilities compared · CMS & AL Dept. of Health data

Filter by care type
Keller Landing
NH

Nursing Home Licensed facility providing 24/7 skilled nursing care for residents with complex, ongoing medical needs. Staffed by RNs, LPNs, and CNAs. Inspected and star-rated annually by CMS. Accepts Medicare (short-term rehab) and Medicaid (long-term care).

MC

Memory Care Secured, specialized care for people living with Alzheimer's or dementia. Staff trained in cognitive impairment, with higher staff-to-resident ratios and an environment designed to reduce confusion and wandering risk.

Tuscumbia (South Sheffield)109 70.4% -13%3.52 +82%-20%$031.5-72 48 Christine Davis$8.9M$4.7M53.1%15028
Cypress Cove Center
NH

Nursing Home Licensed facility providing 24/7 skilled nursing care for residents with complex, ongoing medical needs. Staffed by RNs, LPNs, and CNAs. Inspected and star-rated annually by CMS. Accepts Medicare (short-term rehab) and Medicaid (long-term care).

MC

Memory Care Secured, specialized care for people living with Alzheimer's or dementia. Staff trained in cognitive impairment, with higher staff-to-resident ratios and an environment designed to reduce confusion and wandering risk.

Muscle Shoals (Jackson Heights)90 87.8% +9%3.49 +121%-20%$062.0-74 50 Bardya Mostafavi Naein$11.2M$4.9M43.9%15392
Brentwood Retirement Community
NH

Nursing Home Licensed facility providing 24/7 skilled nursing care for residents with complex, ongoing medical needs. Staffed by RNs, LPNs, and CNAs. Inspected and star-rated annually by CMS. Accepts Medicare (short-term rehab) and Medicaid (long-term care).

AL

Assisted Living A licensed, long-term care setting for seniors or individuals with disabilities who need help with daily activities — like bathing, dressing, and medication management — but not 24-hour skilled nursing. Offers housing, meals, and around-the-clock support while aiming to maximize resident independence.

MC

Memory Care Secured, specialized care for people living with Alzheimer's or dementia. Staff trained in cognitive impairment, with higher staff-to-resident ratios and an environment designed to reduce confusion and wandering risk.

Muscle Shoals (Jackson Heights)123 59.8% -26%4.82 +46%+10%$0103.3-71 49 Jonathan Traylor$8.1M$3.9M48.5%15126
Glenwood Center
NH

Nursing Home Licensed facility providing 24/7 skilled nursing care for residents with complex, ongoing medical needs. Staffed by RNs, LPNs, and CNAs. Inspected and star-rated annually by CMS. Accepts Medicare (short-term rehab) and Medicaid (long-term care).

MC

Memory Care Secured, specialized care for people living with Alzheimer's or dementia. Staff trained in cognitive impairment, with higher staff-to-resident ratios and an environment designed to reduce confusion and wandering risk.

Florence (Ana Drive)125 85.5% +6%3.12 +86%-29%$0155.0-100 56 Genesis Operations Vi LLC$13.2M$7.2M54.5%15147

Frequently Asked Questions about Glenwood Center

What neighborhood is Glenwood Center in?

Glenwood Center is in the Ana Drive neighborhood.

Is Glenwood Center in a walkable area?

Glenwood Center has a walk score of 56. Moderately walkable. Some errands can be accomplished on foot, with a mix of nearby amenities.

What is the occupancy rate at Glenwood Center?

Glenwood Center's occupancy is 85.5%.

Who is the administrator of Glenwood Center?

field_administrator is the administrator of Glenwood Center.

What is the address of Glenwood Center?

Glenwood Center is located at 211 Ana Dr, Florence, AL 35630.

What is the phone number of Glenwood Center?

(256) 766-8963 will put you in contact with the team at Glenwood Center.

Is Glenwood Center Medicare or Medicaid certified?

Yes — Glenwood Center is a CMS-certified provider of Medicare and Medicaid.

Guides for Better Senior Living

Care Cost Calculator: See Prices in Your Area

Nursing Home Data Explorer

Don’t Wait Too Long: 7 Red Flag Signs Your Parent Needs Assisted Living Now

The True Cost of Assisted Living in 2025 – And How Families Are Paying For It

Understanding Senior Living Costs: Pricing Models, Discounts & Financial Assistance

Explore Open Rooms
1 Contact details
2 What type of senior care service are you looking for?
3 What budget do you have in mind for senior care?
4 How soon do you need to find care?
5 Additional details

Thank you for your interest!

Our team will be in touch shortly to help with next steps.