Ascension Living Franciscan Place
Nursing Home, Adult Day Care, Assisted Living, Home Care, Independent Living, Memory Care & Nursing Care · Brookfield, WI
CMS overall rating Info CMS (the Centers for Medicare & Medicaid Services) is the federal agency that rates nursing home quality. Its Overall Rating runs from 1 to 5 stars, combining health inspections, staffing, and quality measures, with inspections weighted most heavily.

Ascension Living Franciscan Place

Nursing Home, Adult Day Care, Assisted Living, Home Care, Independent Living, Memory Care & Nursing Care · Brookfield, WI
CMS overall rating Info CMS (the Centers for Medicare & Medicaid Services) is the federal agency that rates nursing home quality. Its Overall Rating runs from 1 to 5 stars, combining health inspections, staffing, and quality measures, with inspections weighted most heavily.
Calculator: See prices in your area
Ascension Living Franciscan Place accepts Medicare and private pay.

Overview of Ascension Living Franciscan Place

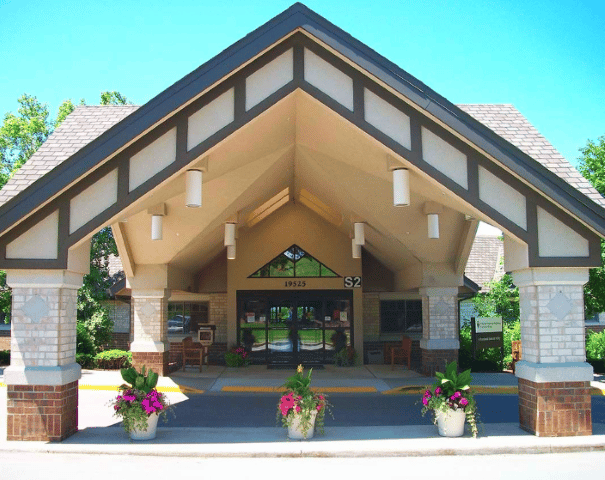
Ascension Living Franciscan Place is a nursing home in Brookfield, WI, that offers rehabilitation and skilled nursing. The community ensures older adults are well-cared for with a nurturing and welcoming environment. With 24-hour care, well-balanced meals, and recreational programs, residents are guaranteed the utmost attention and care. Through personalized care plans, the community also strives to improve residents’ holistic well-being.

Educational programs, social events, and spiritual opportunities foster interactions and allow residents to continue learning. Residents can also connect with their surroundings and lounge in the spacious dining room and beautiful outdoor gardens. Set near Elmbrook Memorial Hospital and serene green spaces in Brookfield, the community guarantees accessibility and convenience. This nursing home has high standards of care and a clean setting, making it a great choice for senior living in Wisconsin.

Quality ratings

Measured by Centers for Medicare & Medicaid Services (CMS)

Overall rating Info The Overall CMS Rating combines results from health inspections, staffing levels and quality measures. Health inspections carry the most weight. Staffing and quality scores can increase or decrease the final rating based on performance compared to state and national standards.
▼ 33.4% Below WI avg. ▼ 33.4% Below WI avg.WI average: 3.0Click the badge to see the full State ranking.Click here to see the full State ranking.
Health Inspection Info Based on the results of the facility's three most recent standard inspections and any complaint investigations. CMS reviews the number, scope, and severity of deficiencies, with more recent findings weighted more heavily.
▼ 28.5% Below WI avg. ▼ 28.5% Below WI avg.WI average: 2.8Click the badge to see the full State ranking.Click here to see the full State ranking.
Staffing Info Measures average nursing staff hours per resident per day, including Registered Nurses (RNs) and total nursing staff. Ratings are adjusted based on the level of care residents require and are compared to state and national benchmarks.
▼ 17.1% Below WI avg. ▼ 17.1% Below WI avg.WI average: 3.6Click the badge to see the full State ranking.Click here to see the full State ranking.
Quality Measures Info Based on clinical and physical health indicators reported to CMS, such as hospital readmissions, falls, pressure ulcers, and improvements in mobility. These measures reflect how well residents' health needs are being managed.
▼ 3.6% Below WI avg. ▼ 3.6% Below WI avg.WI average: 3.1Click the badge to see the full State ranking.Click here to see the full State ranking.

Staffing hours breakdown

Info Daily nursing hours per resident by staff type, reported to CMS. Higher is generally better — compare this facility to state and national averages to see where staffing stands.

Hours per resident per day — compared to Wisconsin state averages

Total nursing care / resident Info This home is ranked 69th out of 178 homes in Wisconsin for nurse hours. Total adjusted nursing hours per resident per day, combining RN, LPN, and aide time. CMS adjusts this for case-mix so facilities can be fairly compared.
4h 29m per day
Rank #69 / 178Nurse hours — State benchmarkedThis home is ranked 69th out of 178 homes in Wisconsin. Shows adjusted nurse hours per resident per day benchmarked to the Wisconsin average, with a ranking across 178 Wisconsin facilities. More hours mean more direct care. The national average is about 3.5 hrs; below 3.0 is a red flag.Rankings are based only on facilities in Wisconsin that report data for that category. Facilities without available data are excluded from the ranking.Click the rank badge to see the full State ranking.Click here to see the full State ranking.
This facility Wisconsin avg (4h 17m per day)
vs Wisconsin avg
+5%

4 of 6 metrics below state avg

Standout metric LPN / LVN is +65% above state avg
Staff typeHours / Day / Residentvs state avg
Registered Nurse (RN) Info RNs hold the highest nursing license and can assess residents, interpret test results, and direct care plans. More RN hours per day often signals stronger clinical oversight and faster response to health changes. 47m per day ▼ 20% State avg: 58m per day · National avg: 41m per day
LPN / LVN Info Licensed Practical Nurses (LPNs) or Licensed Vocational Nurses (LVNs) deliver routine hands-on care — medication administration, wound dressing, and monitoring vital signs. They work under RN supervision and make up a large share of daily bedside care. 1h 3m per day ▲ 65% State avg: 38m per day · National avg: 52m per day
Nurse Aide Info Certified Nurse Aides (CNAs) provide the most direct day-to-day assistance: bathing, dressing, feeding, and mobility. Nurse aide hours are typically the largest staffing category and directly affect residents' quality of life. 2h 18m per day ▼ 11% State avg: 2h 35m per day · National avg: 2h 21m per day
Weekend Total Nursing Info Combined nursing hours (RN + LPN + Nurse Aide) per resident per day on weekends. Staffing often drops on weekends — this figure reveals whether the facility maintains adequate coverage outside of weekday hours. 3h 41m per day ■ Avg State avg: 3h 43m per day · National avg: 3h 26m per day
Physical Therapist Info Hours per resident per day provided by licensed Physical Therapists (PTs) or PT Assistants. PT services help residents recover mobility after injury or illness and are especially important for post-acute (short-stay) rehabilitation. 3m per day ▼ 31% State avg: 4m per day · National avg: 4m per day
Weekend RN Info Registered nurse hours specifically on weekends. Facilities sometimes reduce RN presence on Saturdays and Sundays — a low weekend RN figure compared to weekday hours can indicate reduced clinical oversight when most administrative staff are absent. 34m per day ▼ 14% State avg: 39m per day · National avg: 29m per day

Capacity and availability

This home usually has availability

Similar occupancy to the Wisconsin average: 70%
Occupancy rate
69.7% Rank #264 / 434Occupancy rate — State benchmarkedThis home is ranked 264th out of 434 homes in Wisconsin. Shows this facility's occupancy rate versus the Wisconsin average, with its Statewide rank out of 434. Higher occupancy signals strong local demand and financial stability.Rankings are based only on facilities in Wisconsin that report data for that category. Facilities without available data are excluded from the ranking.Click the rank badge to see the full State ranking.Click here to see the full State ranking.
Avg. Length of Stay
44 days
Bed community size
110-bed community Rank #46 / 496Bed count — State benchmarkedThis home is ranked 46th out of 496 homes in Wisconsin. Shows this facility's certified or reported bed count compared to other Wisconsin facilities. Larger communities may offer more amenities, programs, and on-site services for residents and families.Rankings are based only on facilities in Wisconsin that report data for that category. Facilities without available data are excluded from the ranking.Click the rank badge to see the full State ranking.Click here to see the full State ranking.
A larger shared setting that may offer more common spaces and organized community services.
Walk Score
Walk Score: 17 / 100 Rank #458 / 580Walk Score — State benchmarkedThis home is ranked 458th out of 580 homes in Wisconsin. Shows how walkable this facility's neighborhood is compared to the average Walk Score across Wisconsin facilities. Higher scores benefit residents, families, and staff.Rankings are based only on facilities in Wisconsin that report data for that category. Facilities without available data are excluded from the ranking.Click the rank badge to see the full State ranking.Click here to see the full State ranking.
Car-dependent. Most errands require a car, with limited nearby walkable options.

Contact Ascension Living Franciscan Place

Staffing Data

Reporting period: October 1 – December 31, 2025 (Q4 2025). Source: CMS Payroll-Based Journal report.

Total staff 225
Employees 55
Contractors 170
Staff to resident ratio 2.78 : 1
12% more staff per resident than Wisconsin average
Wisconsin average ratio: 2.48 : 1 Wisconsin average ratio: 2.48 : 1See full Wisconsin ranking
Avg staff/day 39
Average shift 7.9 hours
8% better than Wisconsin average
Wisconsin average: 7.3 hours Wisconsin average shift: 7.3 hoursSee full Wisconsin ranking
Total staff hours (quarter) 28,383

Nursing staff breakdown

Q4 2025 · Oct 1 – Dec 31 More info This data comes from the CMS Payroll-Based Journal report covering October 1 – December 31, 2025.
Registered Nurse

Manages medical care and health needs.

RN Staff Info 19 total: 7 full-time employees and 12 contractors. 19
Average shift length Info Average shift length. Calculated as total hours divided by days worked and average staff per day. 8.4 hours
Licensed Practical Nurse

Assists with medical care and medications.

LPN Staff Info 50 total: 10 full-time employees and 40 contractors. 50
Average shift length Info Average shift length. Calculated as total hours divided by days worked and average staff per day. 8.3 hours
Certified Nursing Assistant

Helps with daily care and mobility.

CNA Staff Info 114 total: 29 full-time employees and 85 contractors. 114
Average shift length Info Average shift length. Calculated as total hours divided by days worked and average staff per day. 8.5 hours

Contractor staffing

Q4 2025 · Oct 1 – Dec 31 More info This data comes from the CMS Payroll-Based Journal report covering October 1 – December 31, 2025.

Total hours from contractors

58.5%

16,603 contractor hours this quarter

Certified Nursing Assistant: 85 Licensed Practical Nurse: 40 Registered Nurse: 12 Respiratory Therapy Technician: 9 Physical Therapy Assistant: 6 Speech Language Pathologist: 6 Occupational Therapy Aide: 4 Qualified Social Worker: 3 Physical Therapy Aide: 3 Clinical Nurse Specialist: 2

Staff by category

Q4 2025 · Oct 1 – Dec 31 More info This data comes from the CMS Payroll-Based Journal report covering October 1 – December 31, 2025.
Certified Nursing Assistant298511413,47492100%8.5
Licensed Practical Nurse1040505,78992100%8.3
Registered Nurse712193,56392100%8.4
Speech Language Pathologist0661,0186672%6.3
Clinical Nurse Specialist4269826874%7.9
Other Dietary Services Staff2029616773%7.7
Physical Therapy Assistant0667387177%6.3
Occupational Therapy Aide0444034751%5
Administrator1014005054%8
RN Director of Nursing1013144448%7.1
Respiratory Therapy Technician0992685762%4.1
Physical Therapy Aide0332244043%5.5
Qualified Social Worker0331773841%4.7
Dental Services Staff10172910%8
114 Certified Nursing Assistant
% of Days 100%
50 Licensed Practical Nurse
% of Days 100%
19 Registered Nurse
% of Days 100%
6 Speech Language Pathologist
% of Days 72%
6 Clinical Nurse Specialist
% of Days 74%
2 Other Dietary Services Staff
% of Days 73%
6 Physical Therapy Assistant
% of Days 77%
4 Occupational Therapy Aide
% of Days 51%
1 Administrator
% of Days 54%
1 RN Director of Nursing
% of Days 48%
9 Respiratory Therapy Technician
% of Days 62%
3 Physical Therapy Aide
% of Days 43%
3 Qualified Social Worker
% of Days 41%
1 Dental Services Staff
% of Days 10%

Penalties and fines

Includes penalties issued in 2024-2025

Federal penalties imposed by CMS for regulatory violations, including civil money penalties (fines) and denials of payment for new Medicare/Medicaid admissions.

Source: CMS Penalties Database (Data as of Jan 2026)

Total fines amount $182K Rank #160 / 180Federal fines — State benchmarkedThis home is ranked 160th out of 180 homes in Wisconsin. Shows this facility's cumulative CMS federal fine dollars versus the Wisconsin average among facilities with fines, and where it ranks among 180 facilities in the pool. Lower total dollars mean a better rank.Rankings are based only on facilities in Wisconsin that report data for that category. Facilities without available data are excluded from the ranking.Click the rank badge to see the full State ranking.Click here to see the full State ranking.
90% higher than Wisconsin average

Wisconsin average: $95K

Number of fines 1
52% fewer fines than Wisconsin average

Wisconsin average: 2.1

Payment Denials Info Serious action where Medicare and/or Medicaid temporarily stops payments for new residents until issues are fixed. 2
202% more payment denials than Wisconsin average

Wisconsin average: 0.7

Fines amount comparison
This facility $182K
Wisconsin average $95K
Penalty History

Penalties are imposed by CMS for violations of federal nursing home regulations.

3 penalties in the past 3 years

Multiple penalties were reported in the last 3 years.

Civil Money Penalty Info Fines imposed for noncompliance, which can be assessed per day or per instance of violation. Feb 11, 2025
$182K
Payment Denial Info Serious action where Medicare and/or Medicaid temporarily stops payments for new residents until issues are fixed. Feb 11, 2025
97 days
Payment Denial Info Serious action where Medicare and/or Medicaid temporarily stops payments for new residents until issues are fixed. Nov 14, 2024
31 days

Last updated: Jan 2026

Quality of care over time

These measures show how residents usually do over time at this home, based on health outcomes and preventive care.

High-risk clinical events score Info A composite score based on pressure ulcers, falls with injury, weight loss, walking ability decline, and activities of daily living decline. 12.1
15% worse than Wisconsin average

Wisconsin average: 10.5

Functional decline score Info A composite score based on activities of daily living decline, walking ability decline, and incontinence. 23.4
5% worse than Wisconsin average

Wisconsin average: 22.1

Long-stay resident measures
Below average Info CMS star rating based on long-stay quality measure performance. 5 stars = significantly above average, 1 star = significantly below average.
Need for Help with Daily Activities Increased Info Percent of long-stay residents whose need for help with daily activities has increased 19.1%
8% worse than Wisconsin average

Wisconsin average: 17.6%

Walking Ability Worsened Info Percent of long-stay residents whose ability to move independently worsened 27.8%
22% worse than Wisconsin average

Wisconsin average: 22.8%

Low Risk Residents with Bowel/Bladder Incontinence Info Percent of low risk long-stay residents who lose control of their bowels or bladder 23.2%
11% better than Wisconsin average

Wisconsin average: 26.0%

Falls with Major Injury Info Percent of long-stay residents experiencing one or more falls with major injury 1.3%
60% better than Wisconsin average

Wisconsin average: 3.2%

High Risk Residents with Pressure Ulcers Info Percent of long-stay high risk residents with pressure ulcers 9.2%
69% worse than Wisconsin average

Wisconsin average: 5.4%

Urinary Tract Infection Info Percent of long-stay residents with a urinary tract infection 1.3%
59% better than Wisconsin average

Wisconsin average: 3.2%

Lost Too Much Weight Info Percent of long-stay residents who lose too much weight 3.0%
38% better than Wisconsin average

Wisconsin average: 4.9%

Depressive Symptoms Info Percent of long-stay residents who have depressive symptoms 0.5%
91% better than Wisconsin average

Wisconsin average: 5.0%

Antipsychotic Use Info Percent of long-stay residents who received an antipsychotic medication 15.5%
In line with Wisconsin average

Wisconsin average: 16.1%

Pneumococcal Vaccine Info Percent of long-stay residents assessed and appropriately given the pneumococcal vaccine 92.0%
In line with Wisconsin average

Wisconsin average: 95.9%

Influenza Vaccine Info Percent of long-stay residents assessed and appropriately given the seasonal influenza vaccine 95.5%
In line with Wisconsin average

Wisconsin average: 95.0%

Short-stay resident measures
Average Info CMS star rating based on short-stay quality measure performance. 5 stars = much above average, 1 star = much below average.
Pneumococcal Vaccine Info Percent of short-stay residents assessed and appropriately given the pneumococcal vaccine 88.7%
In line with Wisconsin average

Wisconsin average: 87.3%

Antipsychotic medication increase Info Percent of short-stay residents who newly received an antipsychotic medication 1.2%
6% better than Wisconsin average

Wisconsin average: 1.2%

Influenza Vaccine Info Percent of short-stay residents assessed and appropriately given the seasonal influenza vaccine 85.8%
In line with Wisconsin average

Wisconsin average: 82.2%

Re-hospitalized after SNF stay Info Percentage of short-stay residents who were re-hospitalized after their nursing home admission. 24.1%
6% worse than Wisconsin average

Wisconsin average: 22.7%

Emergency department visits Info Percentage of short-stay residents who had an outpatient emergency department visit. 18.1%
21% worse than Wisconsin average

Wisconsin average: 15.0%

Falls with major injury Info Percentage of SNF residents who experience falls with major injury during their stay. 1.6%
103% worse than Wisconsin average

Wisconsin average: 0.8%

Ability to care for self at discharge Info Percentage of residents at or above expected ability to care for themselves at discharge. 50.0%
7% worse than Wisconsin average

Wisconsin average: 53.7%

Successful return to home or community Info Rate of successful return to home or community from a skilled nursing facility. 52.5%
In line with Wisconsin average

Wisconsin average: 50.6%

Breakdown by payment type

Medicare

64% of new residents, usually for short-term rehab.

Typical stay 9 days

Private pay

36% of new residents, often for short stays.

Typical stay 3 - 4 months

Facility Characteristics

Source: CMS Long-Term Care Facility Characteristics (Data as of Jan 2026)

Total residents 81
Medicare
14
17.3% of residents
Medicaid
43
53.1% of residents
Private pay or other
24
29.6% of residents
Programs & Services
Residents Group

Residents meet regularly to discuss policies, care quality, and activities

Active Resident Council

Organized group of residents that meets regularly to discuss facility policies, quality of life, and activities.

Finances and operations

Based on CMS SNF Cost Report for fiscal year ending in 06/2024.

Nonprofit
Nonprofit Corporation
Net patient revenue Info Net patient revenue — what the home actually collects for resident care, after contractual allowances, bad debt and discounts are subtracted from its gross charges (CMS cost report, Worksheet G-3). It covers resident care only; money the home earns from other sources is shown separately as "Other income."
$11.3M
Net patient income Info Net patient income: net patient revenue minus the home's total operating expenses. A positive figure means it earns more from resident care than it spends to deliver it; a negative figure means the opposite. It excludes non-operating "other income."
-$282.5K
Nonprofit Nonprofit Corporation
Net patient revenue Info Net patient revenue — what the home actually collects for resident care, after contractual allowances, bad debt and discounts are subtracted from its gross charges (CMS cost report, Worksheet G-3). It covers resident care only; money the home earns from other sources is shown separately as "Other income."
$11.3M Rank #28 / 183Revenue — State benchmarkedThis home is ranked 28th out of 183 homes in Wisconsin. Shows this facility's annual revenue compared to the Wisconsin average. Higher revenue generally means more resources for staffing and capital — read alongside Payroll %.Rankings are based only on facilities in Wisconsin that report data for that category. Facilities without available data are excluded from the ranking.Click the rank badge to see the full State ranking.Click here to see the full State ranking.
Net patient income Info Net patient income: net patient revenue minus the home's total operating expenses. A positive figure means it earns more from resident care than it spends to deliver it; a negative figure means the opposite. It excludes non-operating "other income."
-$282.5K
Other income Info Money the home earns outside of resident care — such as investments, grants, rentals and other non-operating sources (CMS cost report, Worksheet G-3). It is tracked separately from net patient revenue: it is not part of that figure, and it is not included in net patient income.
$63.4K
Payroll costs Info Staff salaries plus wage-related costs — benefits such as payroll taxes, health insurance and retirement — from the home's own accounting records (CMS cost report, Worksheet A). Contract or agency labor is counted separately, under other operating costs. Rank #109 / 183Payroll — State benchmarkedThis home is ranked 109th out of 183 homes in Wisconsin. Shows total annual staff payroll benchmarked to the Wisconsin average. Higher payroll investment relative to peers often signals better staffing and less reliance on cheaper contract labor.Rankings are based only on facilities in Wisconsin that report data for that category. Facilities without available data are excluded from the ranking.Click the rank badge to see the full State ranking.Click here to see the full State ranking.
$4.2M 37.5% of net patient revenue Info Payroll as a share of revenue: staff salaries and wage-related benefits divided by net patient revenue. A higher figure means more of each revenue dollar goes to staff pay. Rank #183 / 183Payroll % — State benchmarkedThis home is ranked 183rd out of 183 homes in Wisconsin. Shows payroll as a percentage of revenue versus the Wisconsin average. Well-run Wisconsin facilities typically land around 62–74% — the top third Statewide. Below 25% may signal understaffing or heavy agency use — read with Staffing ratings.Rankings are based only on facilities in Wisconsin that report data for that category. Facilities without available data are excluded from the ranking.Click the rank badge to see the full State ranking.Click here to see the full State ranking.
Other operating costs Info Everything it costs to run the home apart from payroll — food, utilities, supplies, maintenance, contract labor and administration. Calculated as total operating expense minus payroll (staff salaries and wage-related benefits).
$7.3M
Total costs Info The home's total operating expense for the year — all the costs of running it, salaries included (CMS cost report, Worksheet G-3).
$11.6M

What does this home offer?

Housing options icon

Housing Options: Private Rooms

Building type icon
Building type icon

Building Type: Single-story

Meal Preparation icon

Meal Preparation

Health Programs icon

Health Programs

Recreational activities icon

Recreational Activities

Wellness Programs icon

Wellness Programs

Housekeeping icon
Housekeeping icon

Housekeeping Services

Beauty services icon

Beauty Services

On-site medical care and health services icon

On-site Medical Care and Health Services

Transportation assistance icon

Transportation Assistance

Rehabilitative support icon

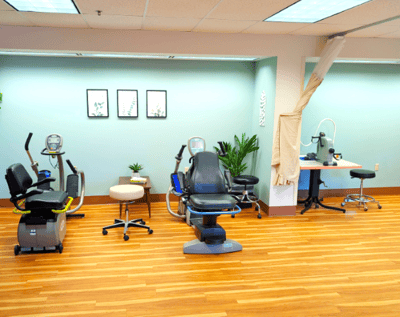
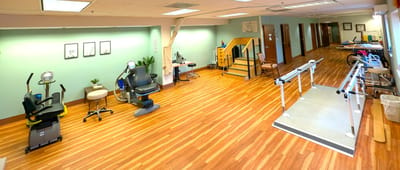
Rehabilitative Support

Post-Hospital Recovery Support icon

Post-Hospital Recovery Support

Medication Reminders icon

Medication Reminders

Who this home usually serves

TYPE OF STAY

Mostly short-term rehab stays

Most residents typically stay for a few weeks or months before returning home or moving on.

Most new residents arrive under Medicare (64% of admissions), and a typical Medicare stay runs around 9 days.

Admissions
661 total

Coverage residents most often arrive under.

Medicare 64%
Private pay 36%
Discharges
644 total

Coverage residents most often leave under.

Medicare 16%
Private pay 84%

Places of interest near Ascension Living Franciscan Place

Address 1.7 miles from city center Info Estimated distance in miles from Brookfield's city center to Ascension Living Franciscan Place's address, calculated via Google Maps.

Calculate Travel Distance to Ascension Living Franciscan Place

Add your location

Address

Compare Assisted Living around Brookfield

The information below is reported by the Wisconsin Department of Health Services, Division of Quality Assurance.

Ascension Living Franciscan Place
AL
ADC
HC
IL
MC
NC
NH
Brookfield (Glen Kerry) -
110
Facility 110
WI AVG 61
Rank #46 / 496
-
17
Facility 17
WI AVG 42
Rank #458 / 580
Private Rooms
Care-Age Of Brookfield
AL
NH
PC
Brookfield -
110
Facility 110
WI AVG 61
Rank #46 / 496
-
9
Facility 9
WI AVG 42
Rank #512 / 580
Private Rooms
Congregational Home
AL
HC
IL
MC
NH
Brookfield (Grantosa) $8,467 - $8,467
21
Facility 21
WI AVG 61
Rank #448 / 496
-
20
Facility 20
WI AVG 42
Rank #447 / 580
Private Rooms
Aria of Brookfield
AL
NH
Brookfield (Barrington Woods) -
170
Facility 170
WI AVG 61
Rank #8 / 496
-
10
Facility 10
WI AVG 42
Rank #499 / 580
-

Financial Assistance for
Assisted Living in Wisconsin

Ascension Living Franciscan Place is located in Brookfield, Wisconsin.
Here are the financial assistance programs available to residents in Wisconsin.

Get Financial aid guidance

Family Care Program

WI Medicaid Family Care

Age 65+ or disabled
General Wisconsin resident, Medicaid-eligible, long-term care need.
Income Limits (2025) ~$2,829/month 300% FBR, individual
Asset Limits $2,000 (individual), $3,000 (couple).
WI

Managed care model; rural/urban balance.

Benefits
Personal care (5-7 hours/day) Respite (240 hours/year) Adult day care ($65/day) Home modifications ($1,500 avg.)

Wisconsin Caregiver Support Program

WI NFCSP Respite

Age Caregiver of someone 60+ (or with dementia)
General Wisconsin resident.
Income Limits No strict limit; prioritizes low-income.
Asset Limits Not applicable.
WI

High rural demand; ADRC coordination.

Benefits
In-home respite (4-6 hours/day) Adult day care (~$65/day) Short-term facility care (up to 5 days)

IRIS (Include, Respect, I Self-Direct)

Wisconsin IRIS

Age 65+ (or disabled 18+)
General WI resident, Medicaid-eligible, NFLOC.
Income Limits (2025) ~$2,829/month; QIT optional.
Asset Limits $2,000 (individual), $3,000 (couple).
WI

Flexible budget; serves ~20,000; participant hires caregivers.

Benefits
Personal care (custom hours) Respite Home mods Equipment Transportation Support services

SeniorCare Prescription Drug Assistance

Wisconsin SeniorCare

Age 65+
General WI resident, US citizen/qualified immigrant, not on full Medicaid.
Income Limits (2025) ~$24,980-$34,980/year (Level 1-2B, individual); varies by level.
Asset Limits None.
WI

Four benefit levels; serves ~50,000 annually.

Benefits
$5 generic/$15 brand copays (Level 1); deductibles ($500-$850) for higher levels; covers most Rx drugs

Medicare Savings Program (MSP)

Wisconsin Medicare Savings Program

Age 65+ or disabled
General WI resident, Medicare Part A/B.
Income Limits (2025) ~$2,510/month (QMB), ~$3,380/month (SLMB), ~$3,598/month (QI)—individual.
Asset Limits $9,430 (individual), $14,130 (couple).
WI

Includes Extra Help for Part D; no waitlist.

Benefits
Covers Part B premiums ($174.70/month) Deductibles ($240/year) Copays (~20%)

Wisconsin Home Energy Assistance Program (WHEAP)

Wisconsin WHEAP

Age 60+ prioritized
General WI resident, low-income household.
Income Limits (2025) ~$3,970/month 185% FPL
Asset Limits Not assessed.
WI

Covers gas, electric, wood; crisis aid available.

Benefits
Heating/electric aid ($300-$1,000/season) Crisis aid ($500 max) Weatherization

VA Aid and Attendance (A&A) and Housebound Benefits

Wisconsin VA Aid and Attendance/Housebound

Age 65+ or disabled veteran/spouse
General WI resident, wartime service, ADL help (A&A) or homebound.
Income Limits (2025) Net income < ~$1,984/month (veteran with dependent, A&A); pension offsets income.
Asset Limits ~$155,356 net worth
WI

High rural veteran use; supports care costs.

Benefits
Cash (~$1,433-$2,642/month veteran, ~$951-$1,318 spouse) for care costs

Property Tax Deferral Loan Program

Wisconsin Property Tax Deferral Loan

Age 65+
General WI resident, homeowner, live in home 6+ months/year.
Income Limits (2025) ~$24,980/year household
Asset Limits Home equity < $500,000; limited other assets.
WI

Saves ~$500-$1,500/year; interest ~2%-3%.

Benefits
Deferred tax payment (~$500-$1,500/year avg.)

Senior Farmers’ Market Nutrition Program (SFMNP)

Wisconsin SFMNP

Age 60+
General WI resident, low-income.
Income Limits (2025) ~$2,322/month 185% FPL
Asset Limits Not assessed.
WI

Vouchers (~$45/season); serves ~15,000 annually.

Benefits
Vouchers (~$45/season) for produce at farmers’ markets

Frequently Asked Questions about Ascension Living Franciscan Place

What neighborhood is Ascension Living Franciscan Place in?

Ascension Living Franciscan Place is in the Glen Kerry neighborhood.

Is Ascension Living Franciscan Place in a walkable area?

Ascension Living Franciscan Place has a walk score of 17. Car-dependent. Most errands require a car, with limited nearby walkable options.

What is the occupancy rate at Ascension Living Franciscan Place?

Ascension Living Franciscan Place's occupancy is 69.7%.

Does Ascension Living Franciscan Place operate as a for-profit or non-profit?

Ascension Living Franciscan Place is registered as a non-profit.

Are there photos of Ascension Living Franciscan Place?

Yes — there are 3 photos of Ascension Living Franciscan Place in the photo gallery on this page.

What is the address of Ascension Living Franciscan Place?

Ascension Living Franciscan Place is located at 19525 W North Ave, Brookfield, WI 53045.

What is the phone number of Ascension Living Franciscan Place?

(414) 635-8760 will put you in contact with the team at Ascension Living Franciscan Place.

Guides for Better Senior Living

Care Cost Calculator: See Prices in Your Area

Nursing Home Data Explorer

Don’t Wait Too Long: 7 Red Flag Signs Your Parent Needs Assisted Living Now

The True Cost of Assisted Living in 2025 – And How Families Are Paying For It

Understanding Senior Living Costs: Pricing Models, Discounts & Financial Assistance