Park Manor of Conroe
CMS overall rating Info CMS (the Centers for Medicare & Medicaid Services) is the federal agency that rates nursing home quality. Its Overall Rating runs from 1 to 5 stars, combining health inspections, staffing, and quality measures, with inspections weighted most heavily.

Park Manor of Conroe

CMS overall rating Info CMS (the Centers for Medicare & Medicaid Services) is the federal agency that rates nursing home quality. Its Overall Rating runs from 1 to 5 stars, combining health inspections, staffing, and quality measures, with inspections weighted most heavily.
Calculator: See prices in your area
Park Manor of Conroe accepts Medicare, Medicaid, and private pay.

Overview of Park Manor of Conroe

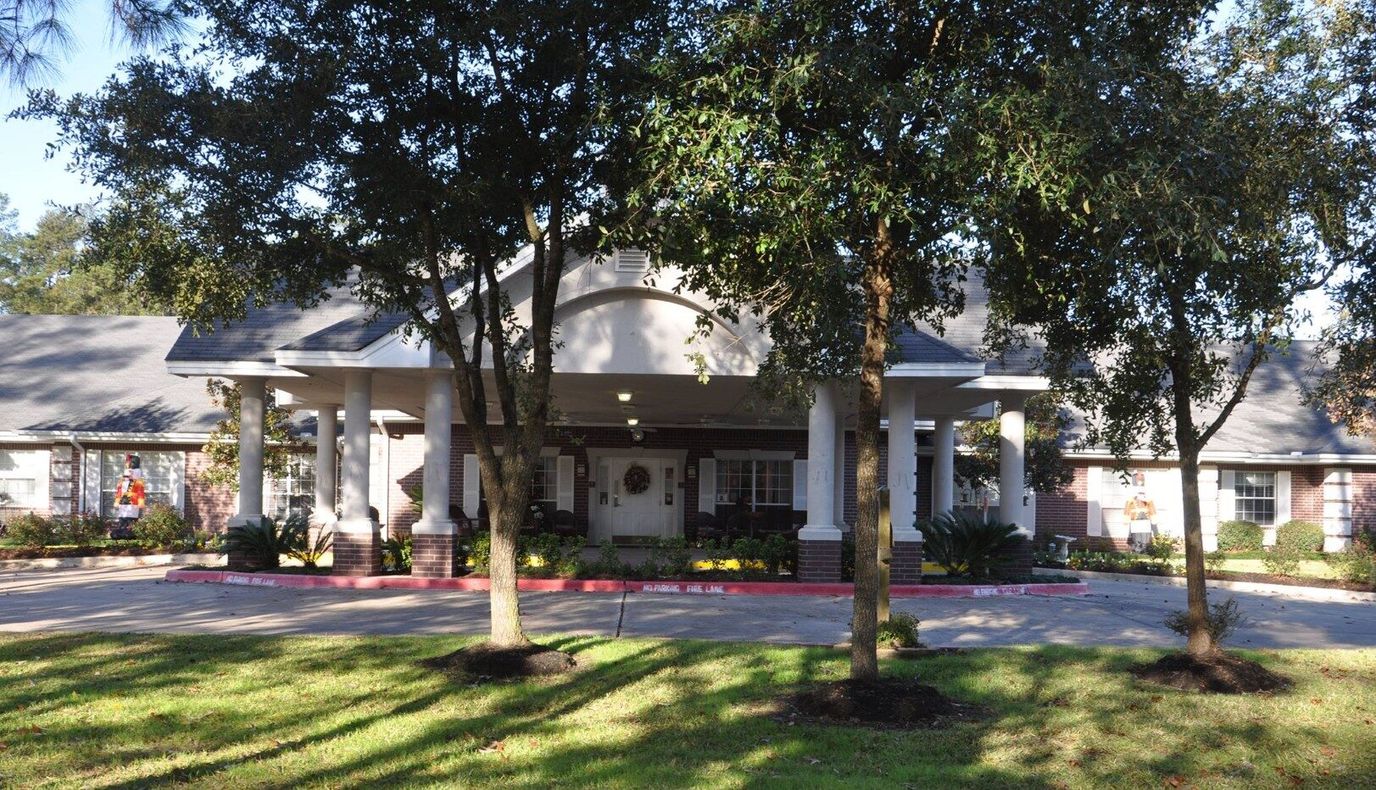
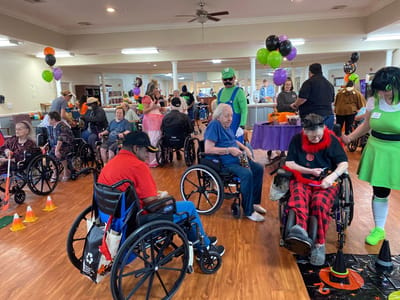
Park Manor of Conroe is a nursing home in Conroe, TX, offering long-term care, skilled nursing, and rehabilitation. Prioritizing older adults’ comfort and healing, the community ensures they are treated like family. With 24-hour care, nutritious meals, and therapy services, residents are guaranteed a maintenance-free living. The community also strives to meet residents’ unique needs and preferences through individualized care plans.

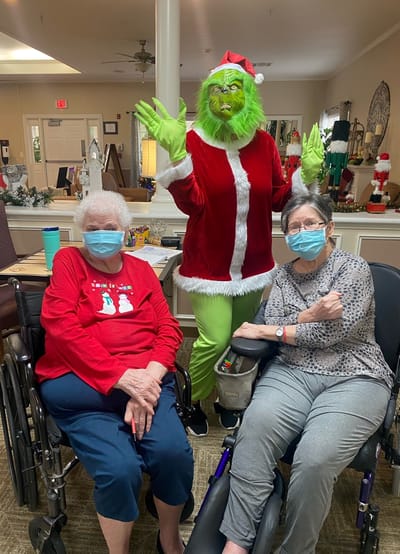
Fun gatherings, light physical activities, and recreational programs foster interactions and help residents live actively. Spacious communal spaces and cozy rooms also ensure residents can rest and move around. HCA Houston Healthcare Conroe, restaurants, and bus stops are also available in the area, providing quick access to necessities and leisure. This nursing home has high standards of care dedicated to older adults’ welfare, making it one of the trusted options for senior living in Texas.

(936) 441-8266

Quality ratings

Measured by Centers for Medicare & Medicaid Services (CMS)

Overall rating Info The Overall CMS Rating combines results from health inspections, staffing levels and quality measures. Health inspections carry the most weight. Staffing and quality scores can increase or decrease the final rating based on performance compared to state and national standards.
▲ 78.9% Above TX avg. ▲ 78.9% Above TX avg.TX average: 2.8Click the badge to see the full State ranking.Click here to see the full State ranking.
Health Inspection Info Based on the results of the facility's three most recent standard inspections and any complaint investigations. CMS reviews the number, scope, and severity of deficiencies, with more recent findings weighted more heavily.
▲ 80.9% Above TX avg. ▲ 80.9% Above TX avg.TX average: 2.8Click the badge to see the full State ranking.Click here to see the full State ranking.
Staffing Info Measures average nursing staff hours per resident per day, including Registered Nurses (RNs) and total nursing staff. Ratings are adjusted based on the level of care residents require and are compared to state and national benchmarks.
▼ 52.9% Below TX avg. ▼ 52.9% Below TX avg.TX average: 2.1Click the badge to see the full State ranking.Click here to see the full State ranking.
Quality Measures Info Based on clinical and physical health indicators reported to CMS, such as hospital readmissions, falls, pressure ulcers, and improvements in mobility. These measures reflect how well residents' health needs are being managed.
▲ 33.2% Above TX avg. ▲ 33.2% Above TX avg.TX average: 3.8Click the badge to see the full State ranking.Click here to see the full State ranking.

Staffing hours breakdown

Info Daily nursing hours per resident by staff type, reported to CMS. Higher is generally better — compare this facility to state and national averages to see where staffing stands.

Hours per resident per day — compared to Texas state averages

Total nursing care / resident Info This home is ranked 279th out of 296 homes in Texas for nurse hours. Total adjusted nursing hours per resident per day, combining RN, LPN, and aide time. CMS adjusts this for case-mix so facilities can be fairly compared.
2h 50m per day
Rank #279 / 296Nurse hours — State benchmarkedThis home is ranked 279th out of 296 homes in Texas. Shows adjusted nurse hours per resident per day benchmarked to the Texas average, with a ranking across 296 Texas facilities. More hours mean more direct care. The national average is about 3.5 hrs; below 3.0 is a red flag.Rankings are based only on facilities in Texas that report data for that category. Facilities without available data are excluded from the ranking.Click the rank badge to see the full State ranking.Click here to see the full State ranking.
This facility Texas avg (3h 38m per day)
vs Texas avg
-22%

5 of 6 metrics below state avg

Staff typeHours / Day / Residentvs state avg
Registered Nurse (RN) Info RNs hold the highest nursing license and can assess residents, interpret test results, and direct care plans. More RN hours per day often signals stronger clinical oversight and faster response to health changes. 16m per day ▼ 38% State avg: 26m per day · National avg: 41m per day
LPN / LVN Info Licensed Practical Nurses (LPNs) or Licensed Vocational Nurses (LVNs) deliver routine hands-on care — medication administration, wound dressing, and monitoring vital signs. They work under RN supervision and make up a large share of daily bedside care. 49m per day ▼ 14% State avg: 57m per day · National avg: 52m per day
Nurse Aide Info Certified Nurse Aides (CNAs) provide the most direct day-to-day assistance: bathing, dressing, feeding, and mobility. Nurse aide hours are typically the largest staffing category and directly affect residents' quality of life. 2h 4m per day ■ Avg State avg: 2h 1m per day · National avg: 2h 21m per day
Weekend Total Nursing Info Combined nursing hours (RN + LPN + Nurse Aide) per resident per day on weekends. Staffing often drops on weekends — this figure reveals whether the facility maintains adequate coverage outside of weekday hours. 2h 44m per day ▼ 9% State avg: 2h 59m per day · National avg: 3h 26m per day
Physical Therapist Info Hours per resident per day provided by licensed Physical Therapists (PTs) or PT Assistants. PT services help residents recover mobility after injury or illness and are especially important for post-acute (short-stay) rehabilitation. 4m per day ▼ 4% State avg: 4m per day · National avg: 4m per day
Weekend RN Info Registered nurse hours specifically on weekends. Facilities sometimes reduce RN presence on Saturdays and Sundays — a low weekend RN figure compared to weekday hours can indicate reduced clinical oversight when most administrative staff are absent. 13m per day ▼ 40% State avg: 21m per day · National avg: 29m per day

Capacity and availability

This home usually has availability

Higher occupancy than the Texas average: 63.5%
Occupancy rate
80.5% Rank #68 / 304Occupancy rate — State benchmarkedThis home is ranked 68th out of 304 homes in Texas. Shows this facility's occupancy rate versus the Texas average, with its Statewide rank out of 304. Higher occupancy signals strong local demand and financial stability.Rankings are based only on facilities in Texas that report data for that category. Facilities without available data are excluded from the ranking.Click the rank badge to see the full State ranking.Click here to see the full State ranking.
Avg. Length of Stay
61 days
Bed community size
125-bed community Rank #167 / 988Bed count — State benchmarkedThis home is ranked 167th out of 988 homes in Texas. Shows this facility's certified or reported bed count compared to other Texas facilities. Larger communities may offer more amenities, programs, and on-site services for residents and families.Rankings are based only on facilities in Texas that report data for that category. Facilities without available data are excluded from the ranking.Click the rank badge to see the full State ranking.Click here to see the full State ranking.
A larger shared setting that may offer more common spaces and organized community services.
Walk Score
Walk Score: 51 / 100 Rank #483 / 1391Walk Score — State benchmarkedThis home is ranked 483rd out of 1391 homes in Texas. Shows how walkable this facility's neighborhood is compared to the average Walk Score across Texas facilities. Higher scores benefit residents, families, and staff.Rankings are based only on facilities in Texas that report data for that category. Facilities without available data are excluded from the ranking.Click the rank badge to see the full State ranking.Click here to see the full State ranking.
Moderately walkable. Some errands can be accomplished on foot, with a mix of nearby amenities.

About this community

License Details

CertificationsMedicare, Medicaid

Payment & Insurance

2 services
Accept Medicaid
Accept Medicare

Therapy & Rehabilitation

3 services
Rehabilitation Services
Respite Care
Short-Term Rehab

Staffing & Medical

1 service
24-Hour Staffing

Additional Policies & Features

Visitor PolicyFamilies can stay during the day, no overnight stays after visiting hours.
Overnight GuestsOvernight stays need approval on a case by case basis.
Admission CriteriaIndividuals who can no longer live independently.

Amenities & Lifestyle

Rehabilitation Gym
24/7 Skilled Nursing And Medical Supervision
ActivitiesYes
Wellness ProgramYes
Volunteer ProgramsYes

Contact Park Manor of Conroe

Staffing Data

Reporting period: October 1 – December 31, 2025 (Q4 2025). Source: CMS Payroll-Based Journal report.

Total staff 136
Employees 119
Contractors 17
Staff to resident ratio 1.30 : 1
12% fewer staff per resident than Texas average
Texas average ratio: 1.48 : 1 Texas average ratio: 1.48 : 1See full Texas ranking
Avg staff/day 58
Average shift 7.7 hours
5% worse than Texas average
Texas average: 8.1 hours Texas average shift: 8.1 hoursSee full Texas ranking
Total staff hours (quarter) 41,096

Nursing staff breakdown

Q4 2025 · Oct 1 – Dec 31 More info This data comes from the CMS Payroll-Based Journal report covering October 1 – December 31, 2025.
Registered Nurse

Manages medical care and health needs.

RN Staff Info All 7 RN Staff are full-time employees. No contractors work on this role. 7
Average shift length Info Average shift length. Calculated as total hours divided by days worked and average staff per day. 9.3 hours
Licensed Practical Nurse

Assists with medical care and medications.

LPN Staff Info All 26 LPN Staff are full-time employees. No contractors work on this role. 26
Average shift length Info Average shift length. Calculated as total hours divided by days worked and average staff per day. 9 hours
Certified Nursing Assistant

Helps with daily care and mobility.

CNA Staff Info All 69 CNA Staff are full-time employees. No contractors work on this role. 69
Average shift length Info Average shift length. Calculated as total hours divided by days worked and average staff per day. 7.3 hours

Contractor staffing

Q4 2025 · Oct 1 – Dec 31 More info This data comes from the CMS Payroll-Based Journal report covering October 1 – December 31, 2025.

Total hours from contractors

9.7%

3,978 contractor hours this quarter

Speech Language Pathologist: 4 Physical Therapy Assistant: 4 Physical Therapy Aide: 3 Respiratory Therapy Technician: 2 Qualified Social Worker: 2 Occupational Therapy Aide: 1 Medical Director: 1

Staff by category

Q4 2025 · Oct 1 – Dec 31 More info This data comes from the CMS Payroll-Based Journal report covering October 1 – December 31, 2025.
Certified Nursing Assistant6906919,63692100%7.3
Licensed Practical Nurse260268,79592100%9
Medication Aide/Technician8082,54992100%7.6
Registered Nurse7072,2459199%9.3
Physical Therapy Aide0331,2768997%7.8
Speech Language Pathologist0449967177%7.5
Other Dietary Services Staff2029207885%7.5
Respiratory Therapy Technician0226897480%7.6
Nurse Practitioner2026346470%7.5
Physical Therapy Assistant0445037177%6.9
Dietitian1014876571%7.5
Administrator1014806470%7.5
Qualified Activities Professional1014806065%8
Dental Services Staff1014645964%7.9
Mental Health Service Worker1014285762%7.5
Qualified Social Worker0224135560%7.5
Occupational Therapy Aide011651718%3.8
Medical Director011361213%3
69 Certified Nursing Assistant
% of Days 100%
26 Licensed Practical Nurse
% of Days 100%
8 Medication Aide/Technician
% of Days 100%
7 Registered Nurse
% of Days 99%
3 Physical Therapy Aide
% of Days 97%
4 Speech Language Pathologist
% of Days 77%
2 Other Dietary Services Staff
% of Days 85%
2 Respiratory Therapy Technician
% of Days 80%
2 Nurse Practitioner
% of Days 70%
4 Physical Therapy Assistant
% of Days 77%
1 Dietitian
% of Days 71%
1 Administrator
% of Days 70%
1 Qualified Activities Professional
% of Days 65%
1 Dental Services Staff
% of Days 64%
1 Mental Health Service Worker
% of Days 62%
2 Qualified Social Worker
% of Days 60%
1 Occupational Therapy Aide
% of Days 18%
1 Medical Director
% of Days 13%

Penalties and fines

Includes penalties issued in 2024

Federal penalties imposed by CMS for regulatory violations, including civil money penalties (fines) and denials of payment for new Medicare/Medicaid admissions.

Source: CMS Penalties Database (Data as of Jan 2026)

Total fines amount $14K Rank #106 / 301Federal fines — State benchmarkedThis home is ranked 106th out of 301 homes in Texas. Shows this facility's cumulative CMS federal fine dollars versus the Texas average among facilities with fines, and where it ranks among 301 facilities in the pool. Lower total dollars mean a better rank.Rankings are based only on facilities in Texas that report data for that category. Facilities without available data are excluded from the ranking.Click the rank badge to see the full State ranking.Click here to see the full State ranking.
83% lower than Texas average

Texas average: $80K

Number of fines 1
60% fewer fines than Texas average

Texas average: 2.5

Payment Denials Info Serious action where Medicare and/or Medicaid temporarily stops payments for new residents until issues are fixed. 0
100% fewer payment denials than Texas average

Texas average: 0.2

Fines amount comparison
This facility $14K
Texas average $80K
Penalty History

Penalties are imposed by CMS for violations of federal nursing home regulations.

1 penalty in the past 3 years

Sep 5, 2024 · $14K

Civil Money Penalty Info Fines imposed for noncompliance, which can be assessed per day or per instance of violation. Sep 5, 2024
$14K

Last updated: Jan 2026

Quality of care over time

These measures show how residents usually do over time at this home, based on health outcomes and preventive care.

High-risk clinical events score Info A composite score based on pressure ulcers, falls with injury, weight loss, walking ability decline, and activities of daily living decline. 3.1
64% better than Texas average

Texas average: 8.6

Functional decline score Info A composite score based on activities of daily living decline, walking ability decline, and incontinence. 4.9
69% better than Texas average

Texas average: 16.0

Long-stay resident measures
Significantly above average Info CMS star rating based on long-stay quality measure performance. 5 stars = significantly above average, 1 star = significantly below average.
Need for Help with Daily Activities Increased Info Percent of long-stay residents whose need for help with daily activities has increased 4.7%
71% better than Texas average

Texas average: 16.2%

Walking Ability Worsened Info Percent of long-stay residents whose ability to move independently worsened 8.7%
46% better than Texas average

Texas average: 16.2%

Low Risk Residents with Bowel/Bladder Incontinence Info Percent of low risk long-stay residents who lose control of their bowels or bladder 1.3%
92% better than Texas average

Texas average: 15.7%

Falls with Major Injury Info Percent of long-stay residents experiencing one or more falls with major injury 0.9%
71% better than Texas average

Texas average: 3.2%

High Risk Residents with Pressure Ulcers Info Percent of long-stay high risk residents with pressure ulcers 1.2%
72% better than Texas average

Texas average: 4.4%

Urinary Tract Infection Info Percent of long-stay residents with a urinary tract infection 0.0%
100% better than Texas average

Texas average: 0.8%

Lost Too Much Weight Info Percent of long-stay residents who lose too much weight 0.0%
100% better than Texas average

Texas average: 3.5%

Depressive Symptoms Info Percent of long-stay residents who have depressive symptoms 0.0%
100% better than Texas average

Texas average: 2.9%

Antipsychotic Use Info Percent of long-stay residents who received an antipsychotic medication 1.0%
87% better than Texas average

Texas average: 7.9%

Pneumococcal Vaccine Info Percent of long-stay residents assessed and appropriately given the pneumococcal vaccine 100.0%
In line with Texas average

Texas average: 97.3%

Influenza Vaccine Info Percent of long-stay residents assessed and appropriately given the seasonal influenza vaccine 100.0%
In line with Texas average

Texas average: 97.9%

Hospitalizations per 1,000 days Info Number of hospitalizations per 1,000 long-stay resident days. 2.06
In line with Texas average

Texas average: 2.13

ED visits per 1,000 days Info Number of outpatient emergency department visits per 1,000 long-stay resident days. 1.93
7% better than Texas average

Texas average: 2.07

Short-stay resident measures
Above average Info CMS star rating based on short-stay quality measure performance. 5 stars = much above average, 1 star = much below average.
Pneumococcal Vaccine Info Percent of short-stay residents assessed and appropriately given the pneumococcal vaccine 100.0%
11% better than Texas average

Texas average: 90.4%

Antipsychotic medication increase Info Percent of short-stay residents who newly received an antipsychotic medication 0.0%
100% better than Texas average

Texas average: 1.4%

Influenza Vaccine Info Percent of short-stay residents assessed and appropriately given the seasonal influenza vaccine 100.0%
14% better than Texas average

Texas average: 88.0%

Re-hospitalized after SNF stay Info Percentage of short-stay residents who were re-hospitalized after their nursing home admission. 37.0%
43% worse than Texas average

Texas average: 25.9%

Emergency department visits Info Percentage of short-stay residents who had an outpatient emergency department visit. 7.8%
35% better than Texas average

Texas average: 12.0%

Falls with major injury Info Percentage of SNF residents who experience falls with major injury during their stay. 0.0%
100% better than Texas average

Texas average: 0.8%

Ability to care for self at discharge Info Percentage of residents at or above expected ability to care for themselves at discharge. 66.7%
24% better than Texas average

Texas average: 53.7%

Successful return to home or community Info Rate of successful return to home or community from a skilled nursing facility. 45.1%
11% worse than Texas average

Texas average: 50.6%

Breakdown by payment type

Medicare

19% of new residents, usually for short-term rehab.

Typical stay 27 days

Private pay

76% of new residents, often for short stays.

Typical stay 20 days

Medicaid

4% of new residents, often for long-term daily care.

Typical stay 2 - 3 years

Facility Characteristics

Source: CMS Long-Term Care Facility Characteristics (Data as of Jan 2026)

Total residents 105
Medicare
10
9.5% of residents
Medicaid
62
59% of residents
Private pay or other
33
31.4% of residents
Programs & Services
Residents Group

Residents meet regularly to discuss policies, care quality, and activities

Active Resident Council

Organized group of residents that meets regularly to discuss facility policies, quality of life, and activities.

Finances and operations

Based on CMS SNF Cost Report for fiscal year ending in 08/2024.

Privately-owned community
Operated by a single business entity.
Net patient revenue Info Net patient revenue — what the home actually collects for resident care, after contractual allowances, bad debt and discounts are subtracted from its gross charges (CMS cost report, Worksheet G-3). It covers resident care only; money the home earns from other sources is shown separately as "Other income."
$12.1M
Net patient income Info Net patient income: net patient revenue minus the home's total operating expenses. A positive figure means it earns more from resident care than it spends to deliver it; a negative figure means the opposite. It excludes non-operating "other income."
$511.8K
Privately-owned community Operated by a single business entity.
Net patient revenue Info Net patient revenue — what the home actually collects for resident care, after contractual allowances, bad debt and discounts are subtracted from its gross charges (CMS cost report, Worksheet G-3). It covers resident care only; money the home earns from other sources is shown separately as "Other income."
$12.1M Rank #57 / 304Revenue — State benchmarkedThis home is ranked 57th out of 304 homes in Texas. Shows this facility's annual revenue compared to the Texas average. Higher revenue generally means more resources for staffing and capital — read alongside Payroll %.Rankings are based only on facilities in Texas that report data for that category. Facilities without available data are excluded from the ranking.Click the rank badge to see the full State ranking.Click here to see the full State ranking.
Net patient income Info Net patient income: net patient revenue minus the home's total operating expenses. A positive figure means it earns more from resident care than it spends to deliver it; a negative figure means the opposite. It excludes non-operating "other income."
$511.8K
Other income Info Money the home earns outside of resident care — such as investments, grants, rentals and other non-operating sources (CMS cost report, Worksheet G-3). It is tracked separately from net patient revenue: it is not part of that figure, and it is not included in net patient income.
$6.5K
Payroll costs Info Staff salaries plus wage-related costs — benefits such as payroll taxes, health insurance and retirement — from the home's own accounting records (CMS cost report, Worksheet A). Contract or agency labor is counted separately, under other operating costs. Rank #121 / 304Payroll — State benchmarkedThis home is ranked 121st out of 304 homes in Texas. Shows total annual staff payroll benchmarked to the Texas average. Higher payroll investment relative to peers often signals better staffing and less reliance on cheaper contract labor.Rankings are based only on facilities in Texas that report data for that category. Facilities without available data are excluded from the ranking.Click the rank badge to see the full State ranking.Click here to see the full State ranking.
$4.7M 38.6% of net patient revenue Info Payroll as a share of revenue: staff salaries and wage-related benefits divided by net patient revenue. A higher figure means more of each revenue dollar goes to staff pay. Rank #271 / 304Payroll % — State benchmarkedThis home is ranked 271st out of 304 homes in Texas. Shows payroll as a percentage of revenue versus the Texas average. Well-run Texas facilities typically land around 51–63% — the top third Statewide. Below 25% may signal understaffing or heavy agency use — read with Staffing ratings.Rankings are based only on facilities in Texas that report data for that category. Facilities without available data are excluded from the ranking.Click the rank badge to see the full State ranking.Click here to see the full State ranking.
Other operating costs Info Everything it costs to run the home apart from payroll — food, utilities, supplies, maintenance, contract labor and administration. Calculated as total operating expense minus payroll (staff salaries and wage-related benefits).
$6.9M
Total costs Info The home's total operating expense for the year — all the costs of running it, salaries included (CMS cost report, Worksheet G-3).
$11.6M

What does this home offer?

Building type icon
Building type icon

Building Type: Single-story

Housekeeping icon
Housekeeping icon

Housekeeping Services

Social and recreational activities icon

Social and Recreational Activities

On-site medical care and health services icon

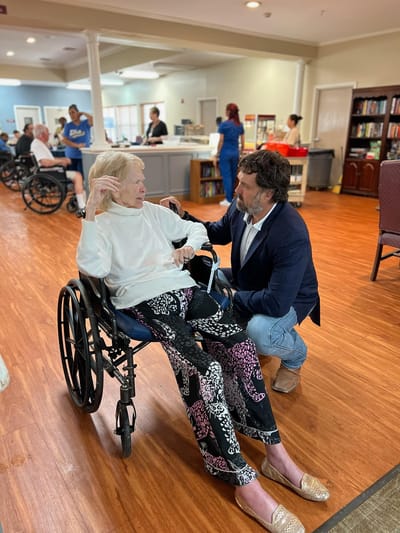
On-site Medical Care and Health Services

Rehabilitative support icon

Rehabilitative Support

Who this home usually serves

TYPE OF STAY

Primarily short stays

Residents typically stay for brief periods, with frequent admissions and discharges throughout the year.

Most new residents arrive under private pay (76% of admissions), and a typical private pay stay runs around 20 days.

Admissions
636 total

Coverage residents most often arrive under.

Medicare 19%
Private pay 76%
Medicaid 4%
Discharges
603 total

Coverage residents most often leave under.

Medicare 14%
Private pay 77%
Medicaid 9%

Places of interest near Park Manor of Conroe

Address 3.0 miles from city center Info Estimated distance in miles from Conroe's city center to Park Manor of Conroe's address, calculated via Google Maps.

Calculate Travel Distance to Park Manor of Conroe

Add your location

Address

Compare Nursing Homes around Conroe

The information below is reported by the Texas Health and Human Services Commission.

3 facilities compared · CMS & TX Dept. of Health data

Park Manor of Conroe
NH
Conroe
125
Facility 125
TX AVG 80
Rank #167 / 988
80.5%
Facility 80.5%
TX AVG 63.5%
Rank #68 / 304
+27%
2.84
Facility 2.84
TX AVG 3.63
Rank #279 / 296
-33%-22%
$13.6k
Facility $13.6k
TX AVG $81.8k
Rank #106 / 301
4
Facility 4
TX AVG 25.9
Rank #2 / 299
1.3
Facility 1.3
TX AVG 3.7
Rank #2 / 299
1117-
51
Facility 51
TX AVG 41
Rank #483 / 1391
Hmg Park Manor Of Conroe, L.l.c
$12.1M
Facility $12.1M
TX AVG $8.4M
Rank #57 / 304
$4.7M
Facility $4.7M
TX AVG $3.5M
Rank #121 / 304
38.6%
Facility 38.6%
TX AVG 47%
Rank #271 / 304
675894
The Brightpointe
NH
Conroe
150
Facility 150
TX AVG 80
Rank #63 / 988
40.9%
Facility 40.9%
TX AVG 63.5%
Rank #271 / 304
-36%
4.20
Facility 4.20
TX AVG 3.63
Rank #62 / 296
+62%+16%
$21.0k
Facility $21.0k
TX AVG $81.8k
Rank #138 / 301
14
Facility 14
TX AVG 25.9
Rank #58 / 299
2.8
Facility 2.8
TX AVG 3.7
Rank #94 / 299
378-
36
Facility 36
TX AVG 41
Rank #832 / 1391
-
$10.7M
Facility $10.7M
TX AVG $8.4M
Rank #227 / 304
$6.1M
Facility $6.1M
TX AVG $3.5M
Rank #95 / 304
57.3%
Facility 57.3%
TX AVG 47%
Rank #12 / 304
676420
Conroe Health Care Center
NH
NC
Conroe
108
Facility 108
TX AVG 80
Rank #321 / 988
71.0%
Facility 71.0%
TX AVG 63.5%
Rank #126 / 304
+12%
3.99
Facility 3.99
TX AVG 3.63
Rank #73 / 296
+33%+10%
$12.9k
Facility $12.9k
TX AVG $81.8k
Rank #104 / 301
20
Facility 20
TX AVG 25.9
Rank #139 / 299
5.0
Facility 5.0
TX AVG 3.7
Rank #264 / 299
282-
68
Facility 68
TX AVG 41
Rank #158 / 1391
Hsmtx/Conroe, LLC
$7.4M
Facility $7.4M
TX AVG $8.4M
Rank #177 / 304
$3.8M
Facility $3.8M
TX AVG $3.5M
Rank #160 / 304
50.9%
Facility 50.9%
TX AVG 47%
Rank #125 / 304
675648

Financial Assistance for
Nursing Home in Texas

Park Manor of Conroe is located in Conroe, Texas.
Here are the financial assistance programs available to residents in Texas.

Get Financial aid guidance

Community Care for the Aged and Disabled (CCAD)

TX Medicaid CCAD

Age 65+ or disabled
General Texas resident, Medicaid-eligible, care need (not always nursing home level).
Income Limits (2025) ~$2,829/month 300% FBR, individual
Asset Limits $2,000 (individual), $3,000 (couple).
TX

Large state; rural access challenges.

Benefits
Personal care (5-7 hours/day) Respite (240 hours/year) Adult day care (~$60/day) Home aides

Texas Community Care Services

TX CCS

Age 60+
General Texas resident, at risk of decline.
Income Limits ~$2,000/month individual, varies
Asset Limits $5,000 individual
TX

Limited funding; high demand in urban areas.

Benefits
In-home care (3-5 hours/week) Respite (up to 10 days/year) Transportation (~5 trips/month)

Area Agency on Aging (AAA) Services

Texas AAA Services

Age 60+
General TX resident; no income/asset limits.
Income Limits (2025) None; donations encouraged.
Asset Limits Not assessed.
TX

28 AAAs; includes Meals on Wheels in some areas.

Benefits
Meals (~$5-$7/meal) Transportation Homemaker services (~4 hours/week) Respite (~5 days/year) Legal aid

Medicare Savings Program (MSP)

Texas Medicare Savings Program

Age 65+ or disabled
General TX resident, Medicare Part A/B.
Income Limits (2025) ~$2,510/month (QMB), ~$3,380/month (SLMB), ~$3,598/month (QI)—individual.
Asset Limits $9,430 (individual), $14,130 (couple).
TX

Includes Extra Help for Part D; no waitlist.

Benefits
Covers Part B premiums ($174.70/month) Deductibles ($240/year) Copays (~20%)

Family Caregiver Support Program (FCSP)

Texas Family Caregiver Support Program

Age
General Caregivers of 60+ needing care or 55+ caregivers of others; TX resident; 2+ ADLs.
Income Limits (2025) No strict cap; prioritizes low-income ~$24,980/year
Asset Limits Not assessed.
TX

High rural demand; includes grandparent caregivers.

Benefits
Respite (4-6 hours/week or 5 days/year) Adult day care ($60/day) Training Supplies (~$500/year)

VA Aid and Attendance (A&A) and Housebound Benefits

Texas VA Aid and Attendance/Housebound

Age 65+ or disabled veteran/spouse
General TX resident, wartime service, ADL help (A&A) or homebound.
Income Limits (2025) Net income < ~$1,984/month (veteran with dependent, A&A); pension offsets income.
Asset Limits ~$155,356 net worth
TX

High veteran population; supports rural/urban needs.

Benefits
Cash (~$1,433-$2,642/month veteran, ~$951-$1,318 spouse) for care costs

Property Tax Exemption for Seniors

Texas Senior Property Tax Exemption

Age 65+
General TX resident, homeowner (homestead).
Income Limits (2025) None; tax-based eligibility.
Asset Limits Not assessed.
TX

$25,000+ exemption; optional freeze in some counties; saves ~$500-$1,000/year.

Benefits
Tax exemption or freeze (~$500-$1,000/year savings)

Senior Farmers’ Market Nutrition Program (SFMNP)

Texas SFMNP

Age 60+
General TX resident, low-income.
Income Limits (2025) ~$2,322/month 185% FPL
Asset Limits Not assessed.
TX

Vouchers (~$50/season); serves ~20,000 via 28 AAAs.

Benefits
Vouchers (~$50/season) for produce at farmers’ markets

Frequently Asked Questions about Park Manor of Conroe

Is Park Manor of Conroe in a walkable area?

Park Manor of Conroe has a walk score of 51. Moderately walkable. Some errands can be accomplished on foot, with a mix of nearby amenities.

What is the occupancy rate at Park Manor of Conroe?

Park Manor of Conroe's occupancy is 80.5%.

Are there photos of Park Manor of Conroe?

Yes — there are 18 photos of Park Manor of Conroe in the photo gallery on this page.

What is the address of Park Manor of Conroe?

Park Manor of Conroe is located at 1600 Grand Lake Dr, Conroe, TX 77304.

What is the phone number of Park Manor of Conroe?

(936) 441-8266 will put you in contact with the team at Park Manor of Conroe.

Is Park Manor of Conroe Medicare or Medicaid certified?

Yes — Park Manor of Conroe is a CMS-certified provider of Medicare and Medicaid.

Guides for Better Senior Living

Care Cost Calculator: See Prices in Your Area

Nursing Home Data Explorer

Don’t Wait Too Long: 7 Red Flag Signs Your Parent Needs Assisted Living Now

The True Cost of Assisted Living in 2025 – And How Families Are Paying For It

Understanding Senior Living Costs: Pricing Models, Discounts & Financial Assistance