TN State Veterans Home
Nursing Home & Nursing Care · Murfreesboro, TN
CMS overall rating Info CMS (the Centers for Medicare & Medicaid Services) is the federal agency that rates nursing home quality. Its Overall Rating runs from 1 to 5 stars, combining health inspections, staffing, and quality measures, with inspections weighted most heavily.

TN State Veterans Home

Nursing Home & Nursing Care · Murfreesboro, TN
CMS overall rating Info CMS (the Centers for Medicare & Medicaid Services) is the federal agency that rates nursing home quality. Its Overall Rating runs from 1 to 5 stars, combining health inspections, staffing, and quality measures, with inspections weighted most heavily.
Calculator: See prices in your area
TN State Veterans Home accepts Medicare, Medicaid, and private pay.

Overview of Tn State Veterans Home

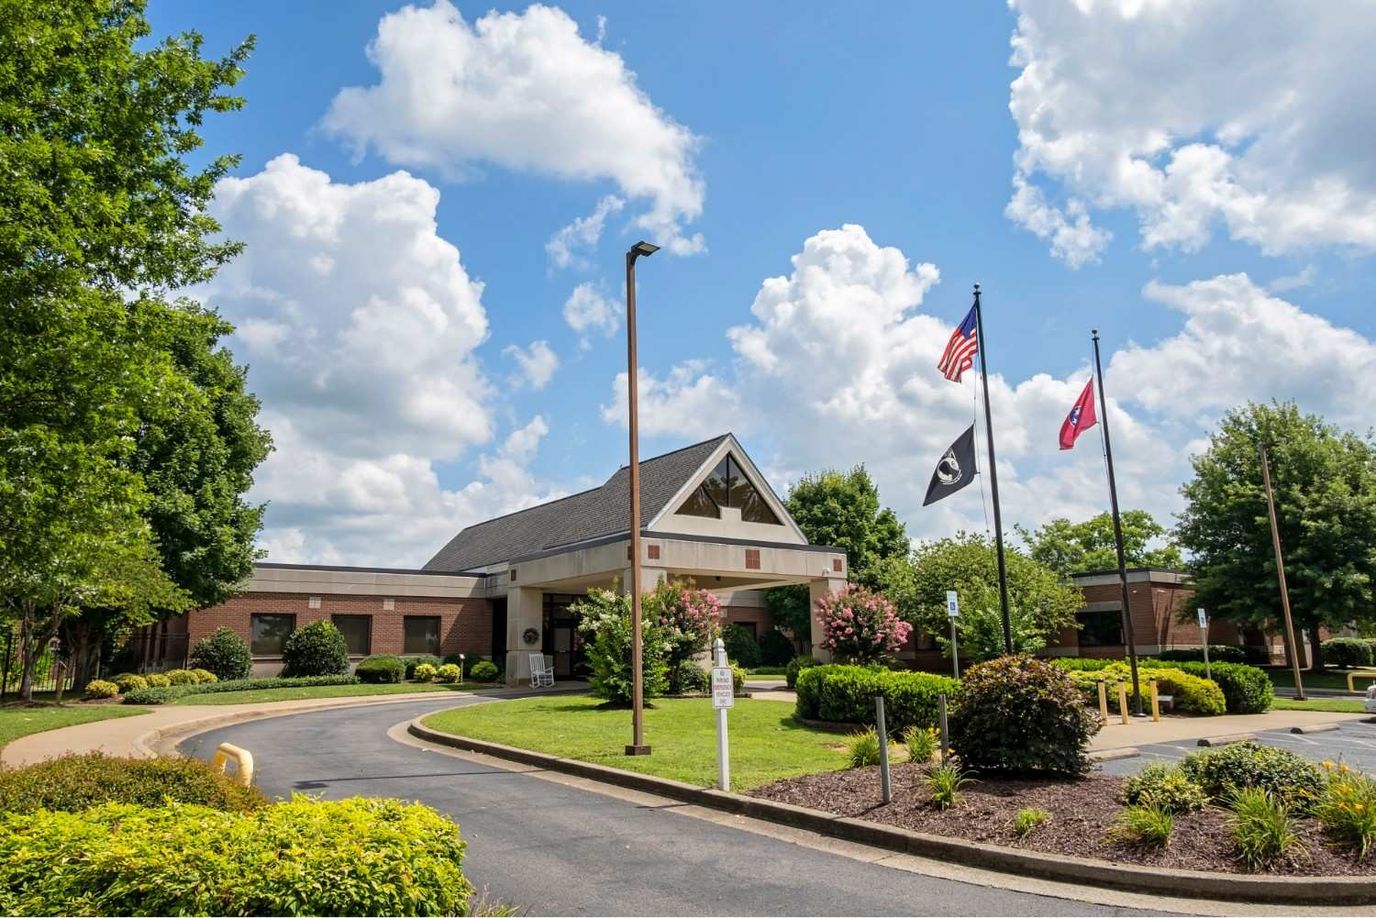
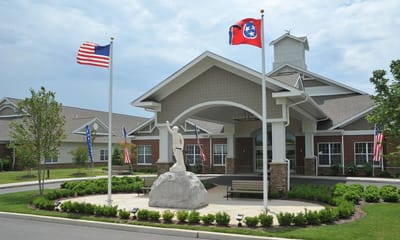
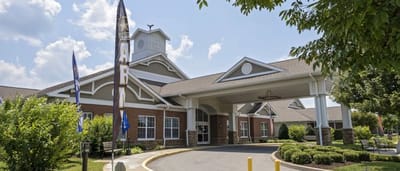
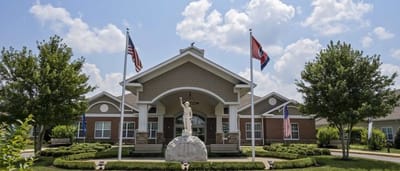
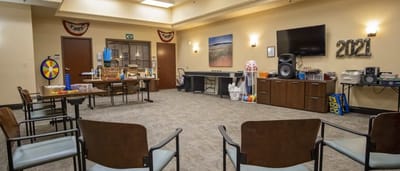
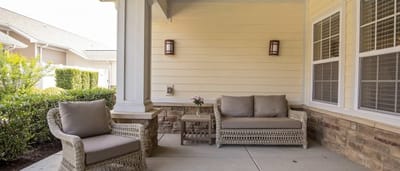
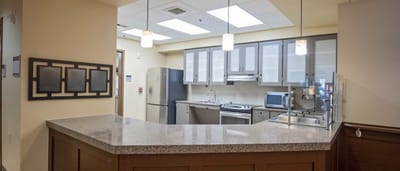
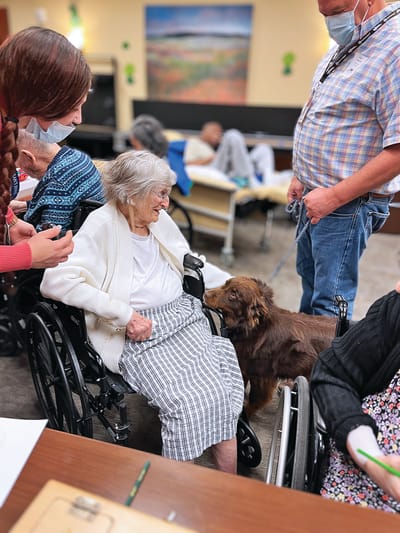
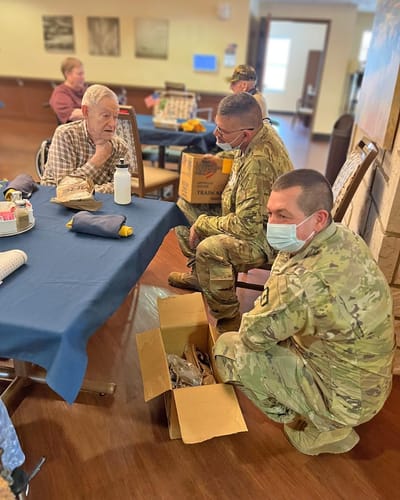
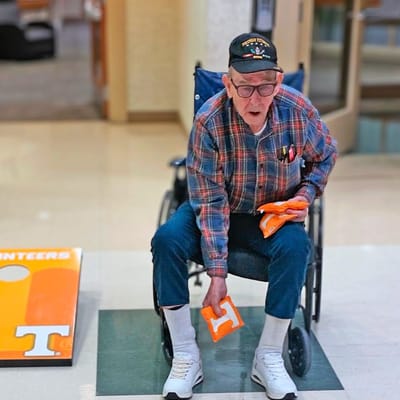
Tn State Veterans Home is a dedicated nursing home in Murfreesboro, TN, offering long-term care, skilled nursing, and rehabilitation for Veterans. The community continuously promotes a compassionate and welcoming environment, ensuring older adults can keep their peace of mind in retirement. With daily housekeeping, 24-hour RN coverage, and restaurant-style dining, residents can maintain their independence without worries. Alongside a multidisciplinary team, personalized care plans are also provided to help veterans live with dignity in their later years.

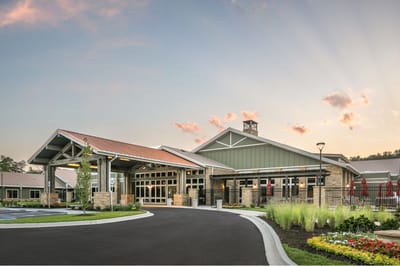
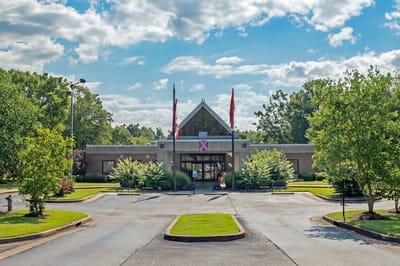
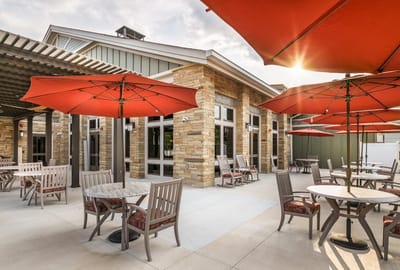
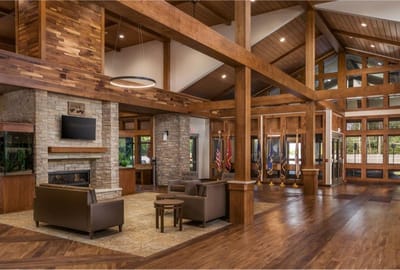
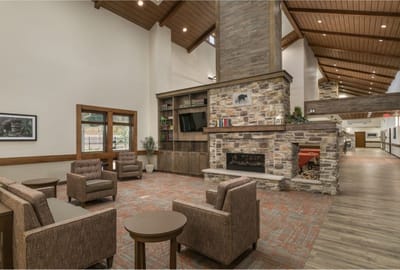
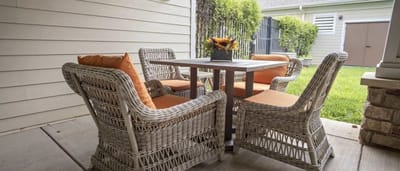
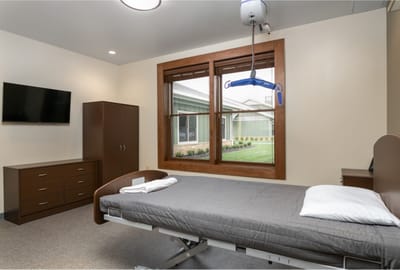
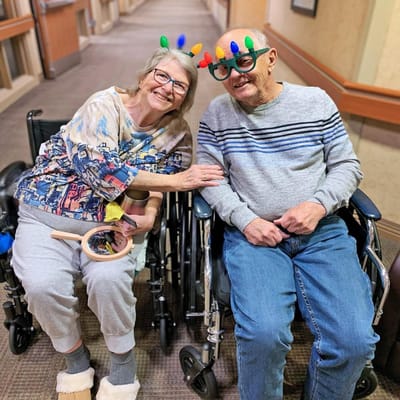
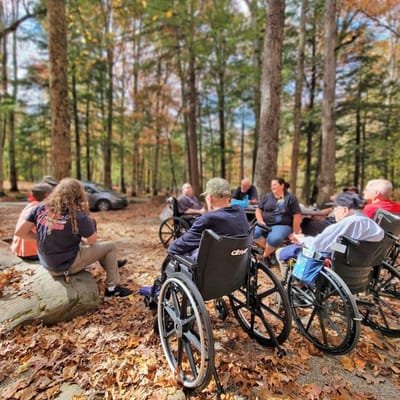
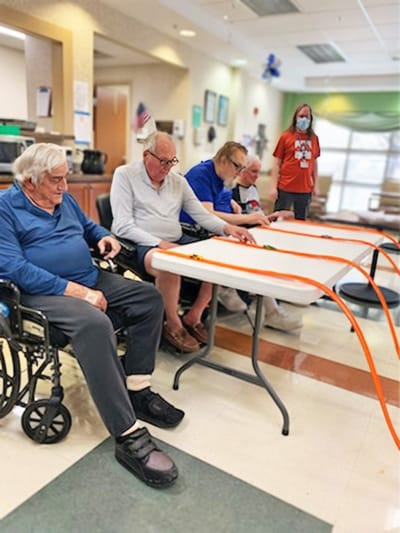
Off-site trips, assistance with shopping, and recreational opportunities foster camaraderie and encourage residents to create meaningful memories. Thoughtfully furnished rooms, spacious lounges, and outdoor patio areas are also available, so residents can relax and focus on their wellness. The Tennessee Valley Healthcare system and a variety of restaurants are located in the area, providing quick access to necessities. This nursing home strives to help older adults thrive in retirement, making it one of the best options for senior living in Tennessee.

Quality ratings

Measured by Centers for Medicare & Medicaid Services (CMS)

Overall rating Info The Overall CMS Rating combines results from health inspections, staffing levels and quality measures. Health inspections carry the most weight. Staffing and quality scores can increase or decrease the final rating based on performance compared to state and national standards.
▼ 64.7% Below TN avg. ▼ 64.7% Below TN avg.TN average: 2.8Click the badge to see the full State ranking.Click here to see the full State ranking.
Health Inspection Info Based on the results of the facility's three most recent standard inspections and any complaint investigations. CMS reviews the number, scope, and severity of deficiencies, with more recent findings weighted more heavily.
▼ 64.1% Below TN avg. ▼ 64.1% Below TN avg.TN average: 2.8Click the badge to see the full State ranking.Click here to see the full State ranking.
Staffing Info Measures average nursing staff hours per resident per day, including Registered Nurses (RNs) and total nursing staff. Ratings are adjusted based on the level of care residents require and are compared to state and national benchmarks.
▲ 24.2% Above TN avg. ▲ 24.2% Above TN avg.TN average: 2.4Click the badge to see the full State ranking.Click here to see the full State ranking.
Quality Measures Info Based on clinical and physical health indicators reported to CMS, such as hospital readmissions, falls, pressure ulcers, and improvements in mobility. These measures reflect how well residents' health needs are being managed.
▲ 16.3% Above TN avg. ▲ 16.3% Above TN avg.TN average: 3.4Click the badge to see the full State ranking.Click here to see the full State ranking.

Staffing hours breakdown

Info Daily nursing hours per resident by staff type, reported to CMS. Higher is generally better — compare this facility to state and national averages to see where staffing stands.

Hours per resident per day — compared to Tennessee state averages

Total nursing care / resident Info This home is ranked 18th out of 192 homes in Tennessee for nurse hours. Total adjusted nursing hours per resident per day, combining RN, LPN, and aide time. CMS adjusts this for case-mix so facilities can be fairly compared.
4h 42m per day
Rank #18 / 192Nurse hours — State benchmarkedThis home is ranked 18th out of 192 homes in Tennessee. Shows adjusted nurse hours per resident per day benchmarked to the Tennessee average, with a ranking across 192 Tennessee facilities. More hours mean more direct care. The national average is about 3.5 hrs; below 3.0 is a red flag.Rankings are based only on facilities in Tennessee that report data for that category. Facilities without available data are excluded from the ranking.Click the rank badge to see the full State ranking.Click here to see the full State ranking.
This facility Tennessee avg (3h 38m per day)
vs Tennessee avg
+30%

3 of 6 metrics below state avg

Standout metric LPN / LVN is +24% above state avg
Staff typeHours / Day / Residentvs state avg
Registered Nurse (RN) Info RNs hold the highest nursing license and can assess residents, interpret test results, and direct care plans. More RN hours per day often signals stronger clinical oversight and faster response to health changes. 32m per day ▼ 13% State avg: 37m per day · National avg: 41m per day
LPN / LVN Info Licensed Practical Nurses (LPNs) or Licensed Vocational Nurses (LVNs) deliver routine hands-on care — medication administration, wound dressing, and monitoring vital signs. They work under RN supervision and make up a large share of daily bedside care. 1h 22m per day ▲ 24% State avg: 1h 6m per day · National avg: 52m per day
Nurse Aide Info Certified Nurse Aides (CNAs) provide the most direct day-to-day assistance: bathing, dressing, feeding, and mobility. Nurse aide hours are typically the largest staffing category and directly affect residents' quality of life. 2h 22m per day ▲ 10% State avg: 2h 9m per day · National avg: 2h 21m per day
Weekend Total Nursing Info Combined nursing hours (RN + LPN + Nurse Aide) per resident per day on weekends. Staffing often drops on weekends — this figure reveals whether the facility maintains adequate coverage outside of weekday hours. 3h 19m per day ■ Avg State avg: 3h 21m per day · National avg: 3h 26m per day
Physical Therapist Info Hours per resident per day provided by licensed Physical Therapists (PTs) or PT Assistants. PT services help residents recover mobility after injury or illness and are especially important for post-acute (short-stay) rehabilitation. 2m per day ▼ 52% State avg: 5m per day · National avg: 4m per day
Weekend RN Info Registered nurse hours specifically on weekends. Facilities sometimes reduce RN presence on Saturdays and Sundays — a low weekend RN figure compared to weekday hours can indicate reduced clinical oversight when most administrative staff are absent. 16m per day ▼ 37% State avg: 25m per day · National avg: 29m per day

Capacity and availability

This home usually has availability

Similar occupancy to the Tennessee average: 73%
Occupancy rate
73.1% Rank #185 / 319Occupancy rate — State benchmarkedThis home is ranked 185th out of 319 homes in Tennessee. Shows this facility's occupancy rate versus the Tennessee average, with its Statewide rank out of 319. Higher occupancy signals strong local demand and financial stability.Rankings are based only on facilities in Tennessee that report data for that category. Facilities without available data are excluded from the ranking.Click the rank badge to see the full State ranking.Click here to see the full State ranking.
Avg. Length of Stay
106 days
Bed community size
140-bed community Rank #47 / 426Bed count — State benchmarkedThis home is ranked 47th out of 426 homes in Tennessee. Shows this facility's certified or reported bed count compared to other Tennessee facilities. Larger communities may offer more amenities, programs, and on-site services for residents and families.Rankings are based only on facilities in Tennessee that report data for that category. Facilities without available data are excluded from the ranking.Click the rank badge to see the full State ranking.Click here to see the full State ranking.
A larger shared setting that may offer more common spaces and organized community services.
Walk Score
Walk Score: 15 / 100 Rank #422 / 553Walk Score — State benchmarkedThis home is ranked 422nd out of 553 homes in Tennessee. Shows how walkable this facility's neighborhood is compared to the average Walk Score across Tennessee facilities. Higher scores benefit residents, families, and staff.Rankings are based only on facilities in Tennessee that report data for that category. Facilities without available data are excluded from the ranking.Click the rank badge to see the full State ranking.Click here to see the full State ranking.
Car-dependent. Most errands require a car, with limited nearby walkable options.

Safety & Compliance

Wheelchair Accessible

Payment & Insurance

1 service
Accept Medicare

Therapy & Rehabilitation

1 service
Rehabilitation Services

Additional Services

1 service
Home Care

Additional Policies & Features

Admission CriteriaHonorably discharged veterans, spouses, widows or widowers, and Gold-Star parents.
HousekeepingYes
Linen ServiceYes

Amenities & Lifestyle

Gym
Barber
Restaurant
Bistro
Patio
Housekeeping
Laundry
Linen Service
Specific Programsmultiple types of therapies and various forms of nursing

Contact TN State Veterans Home

Staffing Data

Reporting period: October 1 – December 31, 2025 (Q4 2025). Source: CMS Payroll-Based Journal report.

Total staff 132
Employees 105
Contractors 27
Staff to resident ratio 1.27 : 1
27% fewer staff per resident than Tennessee average
Tennessee average ratio: 1.75 : 1 Tennessee average ratio: 1.75 : 1See full Tennessee ranking
Avg staff/day 56
Average shift 8.6 hours
0% compared with Tennessee average
Tennessee average: 8.3 hours Tennessee average shift: 8.3 hoursSee full Tennessee ranking
Total staff hours (quarter) 44,487

Nursing staff breakdown

Q4 2025 · Oct 1 – Dec 31 More info This data comes from the CMS Payroll-Based Journal report covering October 1 – December 31, 2025.
Registered Nurse

Manages medical care and health needs.

RN Staff Info All 7 RN Staff are full-time employees. No contractors work on this role. 7
Average shift length Info Average shift length. Calculated as total hours divided by days worked and average staff per day. 10.1 hours
Licensed Practical Nurse

Assists with medical care and medications.

LPN Staff Info 34 total: 25 full-time employees and 9 contractors. 34
Average shift length Info Average shift length. Calculated as total hours divided by days worked and average staff per day. 9.2 hours
Certified Nursing Assistant

Helps with daily care and mobility.

CNA Staff Info 66 total: 58 full-time employees and 8 contractors. 66
Average shift length Info Average shift length. Calculated as total hours divided by days worked and average staff per day. 8.9 hours

Contractor staffing

Q4 2025 · Oct 1 – Dec 31 More info This data comes from the CMS Payroll-Based Journal report covering October 1 – December 31, 2025.

Total hours from contractors

16.4%

7,278 contractor hours this quarter

Licensed Practical Nurse: 9 Certified Nursing Assistant: 8 Speech Language Pathologist: 2 Physical Therapy Aide: 2 Physical Therapy Assistant: 2 Respiratory Therapy Technician: 2 Qualified Social Worker: 1 Medical Director: 1

Staff by category

Q4 2025 · Oct 1 – Dec 31 More info This data comes from the CMS Payroll-Based Journal report covering October 1 – December 31, 2025.
Certified Nursing Assistant5886621,25692100%8.9
Licensed Practical Nurse2593411,02692100%9.2
Registered Nurse7073,16492100%10.1
RN Director of Nursing3031,3096874%8
Clinical Nurse Specialist3031,1347177%6.4
Other Dietary Services Staff2028658491%7.5
Dental Services Staff2028606267%7.9
Speech Language Pathologist0228096470%7.1
Physical Therapy Aide0226966470%6.4
Nurse Practitioner1015126470%8
Dietitian1015126470%8
Administrator1014966267%8
Physical Therapy Assistant0224256267%4.8
Qualified Social Worker0114136065%6.9
Other Social Services Staff1013945964%6.7
Respiratory Therapy Technician0223615560%6
Occupational Therapy Aide1011521516%10.1
Medical Director0111041314%8
66 Certified Nursing Assistant
% of Days 100%
34 Licensed Practical Nurse
% of Days 100%
7 Registered Nurse
% of Days 100%
3 RN Director of Nursing
% of Days 74%
3 Clinical Nurse Specialist
% of Days 77%
2 Other Dietary Services Staff
% of Days 91%
2 Dental Services Staff
% of Days 67%
2 Speech Language Pathologist
% of Days 70%
2 Physical Therapy Aide
% of Days 70%
1 Nurse Practitioner
% of Days 70%
1 Dietitian
% of Days 70%
1 Administrator
% of Days 67%
2 Physical Therapy Assistant
% of Days 67%
1 Qualified Social Worker
% of Days 65%
1 Other Social Services Staff
% of Days 64%
2 Respiratory Therapy Technician
% of Days 60%
1 Occupational Therapy Aide
% of Days 16%
1 Medical Director
% of Days 14%

Penalties and fines

Includes penalties issued in 2024

Federal penalties imposed by CMS for regulatory violations, including civil money penalties (fines) and denials of payment for new Medicare/Medicaid admissions.

Source: CMS Penalties Database (Data as of Jan 2026)

Total fines amount $193K Rank #190 / 198Federal fines — State benchmarkedThis home is ranked 190th out of 198 homes in Tennessee. Shows this facility's cumulative CMS federal fine dollars versus the Tennessee average among facilities with fines, and where it ranks among 198 facilities in the pool. Lower total dollars mean a better rank.Rankings are based only on facilities in Tennessee that report data for that category. Facilities without available data are excluded from the ranking.Click the rank badge to see the full State ranking.Click here to see the full State ranking.
124% higher than Tennessee average

Tennessee average: $86K

Number of fines 1
43% fewer fines than Tennessee average

Tennessee average: 1.7

Payment Denials Info Serious action where Medicare and/or Medicaid temporarily stops payments for new residents until issues are fixed. 1
96% more payment denials than Tennessee average

Tennessee average: 0.5

Fines amount comparison
This facility $193K
Tennessee average $86K
Penalty History

Penalties are imposed by CMS for violations of federal nursing home regulations.

2 penalties in the past 3 years

Multiple penalties were reported in the last 3 years.

Civil Money Penalty Info Fines imposed for noncompliance, which can be assessed per day or per instance of violation. May 30, 2024
$193K
Payment Denial Info Serious action where Medicare and/or Medicaid temporarily stops payments for new residents until issues are fixed. May 30, 2024
24 days

Last updated: Jan 2026

Quality of care over time

These measures show how residents usually do over time at this home, based on health outcomes and preventive care.

High-risk clinical events score Info A composite score based on pressure ulcers, falls with injury, weight loss, walking ability decline, and activities of daily living decline. 13.9
33% worse than Tennessee average

Tennessee average: 10.5

Functional decline score Info A composite score based on activities of daily living decline, walking ability decline, and incontinence. 28.0
44% worse than Tennessee average

Tennessee average: 19.5

Long-stay resident measures
Average Info CMS star rating based on long-stay quality measure performance. 5 stars = significantly above average, 1 star = significantly below average.
Need for Help with Daily Activities Increased Info Percent of long-stay residents whose need for help with daily activities has increased 20.8%
30% worse than Tennessee average

Tennessee average: 16.0%

Walking Ability Worsened Info Percent of long-stay residents whose ability to move independently worsened 32.6%
50% worse than Tennessee average

Tennessee average: 21.7%

Low Risk Residents with Bowel/Bladder Incontinence Info Percent of low risk long-stay residents who lose control of their bowels or bladder 30.7%
48% worse than Tennessee average

Tennessee average: 20.7%

Falls with Major Injury Info Percent of long-stay residents experiencing one or more falls with major injury 2.7%
27% better than Tennessee average

Tennessee average: 3.7%

High Risk Residents with Pressure Ulcers Info Percent of long-stay high risk residents with pressure ulcers 5.5%
In line with Tennessee average

Tennessee average: 5.4%

Urinary Tract Infection Info Percent of long-stay residents with a urinary tract infection 3.7%
80% worse than Tennessee average

Tennessee average: 2.1%

Lost Too Much Weight Info Percent of long-stay residents who lose too much weight 7.9%
26% worse than Tennessee average

Tennessee average: 6.3%

Depressive Symptoms Info Percent of long-stay residents who have depressive symptoms 3.2%
71% better than Tennessee average

Tennessee average: 11.0%

Antipsychotic Use Info Percent of long-stay residents who received an antipsychotic medication 12.8%
23% better than Tennessee average

Tennessee average: 16.5%

Pneumococcal Vaccine Info Percent of long-stay residents assessed and appropriately given the pneumococcal vaccine 95.6%
6% better than Tennessee average

Tennessee average: 89.9%

Influenza Vaccine Info Percent of long-stay residents assessed and appropriately given the seasonal influenza vaccine 98.3%
In line with Tennessee average

Tennessee average: 94.5%

Hospitalizations per 1,000 days Info Number of hospitalizations per 1,000 long-stay resident days. 1.33
16% better than Tennessee average

Tennessee average: 1.58

ED visits per 1,000 days Info Number of outpatient emergency department visits per 1,000 long-stay resident days. 1.49
5% better than Tennessee average

Tennessee average: 1.57

Short-stay resident measures
Below average Info CMS star rating based on short-stay quality measure performance. 5 stars = much above average, 1 star = much below average.
Pneumococcal Vaccine Info Percent of short-stay residents assessed and appropriately given the pneumococcal vaccine 74.3%
7% worse than Tennessee average

Tennessee average: 79.7%

Antipsychotic medication increase Info Percent of short-stay residents who newly received an antipsychotic medication 0.0%
100% better than Tennessee average

Tennessee average: 1.7%

Influenza Vaccine Info Percent of short-stay residents assessed and appropriately given the seasonal influenza vaccine 79.3%
In line with Tennessee average

Tennessee average: 79.8%

Re-hospitalized after SNF stay Info Percentage of short-stay residents who were re-hospitalized after their nursing home admission. 27.7%
25% worse than Tennessee average

Tennessee average: 22.2%

Emergency department visits Info Percentage of short-stay residents who had an outpatient emergency department visit. 0.0%
100% better than Tennessee average

Tennessee average: 11.2%

Breakdown by payment type

Medicare

4% of new residents, usually for short-term rehab.

Typical stay 1 - 2 months

Private pay

95% of new residents, often for short stays.

Typical stay 2 - 3 months

Medicaid

1% of new residents, often for long-term daily care.

Typical stay 7 years

Facility Characteristics

Source: CMS Long-Term Care Facility Characteristics (Data as of Jan 2026)

Total residents 104
Medicare
12
11.5% of residents
Medicaid
17
16.3% of residents
Private pay or other
75
72.1% of residents
Programs & Services
Residents Group

Residents meet regularly to discuss policies, care quality, and activities

Active Resident Council

Organized group of residents that meets regularly to discuss facility policies, quality of life, and activities.

Finances and operations

Based on CMS SNF Cost Report for fiscal year ending in 06/2024.

For-profit
Corporation
Net patient revenue Info Net patient revenue — what the home actually collects for resident care, after contractual allowances, bad debt and discounts are subtracted from its gross charges (CMS cost report, Worksheet G-3). It covers resident care only; money the home earns from other sources is shown separately as "Other income."
$16.8M
Net patient income Info Net patient income: net patient revenue minus the home's total operating expenses. A positive figure means it earns more from resident care than it spends to deliver it; a negative figure means the opposite. It excludes non-operating "other income."
$5.6M
For-profit Corporation
Net patient revenue Info Net patient revenue — what the home actually collects for resident care, after contractual allowances, bad debt and discounts are subtracted from its gross charges (CMS cost report, Worksheet G-3). It covers resident care only; money the home earns from other sources is shown separately as "Other income."
$16.8M Rank #76 / 196Revenue — State benchmarkedThis home is ranked 76th out of 196 homes in Tennessee. Shows this facility's annual revenue compared to the Tennessee average. Higher revenue generally means more resources for staffing and capital — read alongside Payroll %.Rankings are based only on facilities in Tennessee that report data for that category. Facilities without available data are excluded from the ranking.Click the rank badge to see the full State ranking.Click here to see the full State ranking.
Net patient income Info Net patient income: net patient revenue minus the home's total operating expenses. A positive figure means it earns more from resident care than it spends to deliver it; a negative figure means the opposite. It excludes non-operating "other income."
$5.6M
Other income Info Money the home earns outside of resident care — such as investments, grants, rentals and other non-operating sources (CMS cost report, Worksheet G-3). It is tracked separately from net patient revenue: it is not part of that figure, and it is not included in net patient income.
$102.8K
Payroll costs Info Staff salaries plus wage-related costs — benefits such as payroll taxes, health insurance and retirement — from the home's own accounting records (CMS cost report, Worksheet A). Contract or agency labor is counted separately, under other operating costs. Rank #96 / 196Payroll — State benchmarkedThis home is ranked 96th out of 196 homes in Tennessee. Shows total annual staff payroll benchmarked to the Tennessee average. Higher payroll investment relative to peers often signals better staffing and less reliance on cheaper contract labor.Rankings are based only on facilities in Tennessee that report data for that category. Facilities without available data are excluded from the ranking.Click the rank badge to see the full State ranking.Click here to see the full State ranking.
$5.7M 34% of net patient revenue Info Payroll as a share of revenue: staff salaries and wage-related benefits divided by net patient revenue. A higher figure means more of each revenue dollar goes to staff pay. Rank #134 / 196Payroll % — State benchmarkedThis home is ranked 134th out of 196 homes in Tennessee. Shows payroll as a percentage of revenue versus the Tennessee average. Well-run Tennessee facilities typically land around 50–60% — the top third Statewide. Below 25% may signal understaffing or heavy agency use — read with Staffing ratings.Rankings are based only on facilities in Tennessee that report data for that category. Facilities without available data are excluded from the ranking.Click the rank badge to see the full State ranking.Click here to see the full State ranking.
Other operating costs Info Everything it costs to run the home apart from payroll — food, utilities, supplies, maintenance, contract labor and administration. Calculated as total operating expense minus payroll (staff salaries and wage-related benefits).
$5.5M
Total costs Info The home's total operating expense for the year — all the costs of running it, salaries included (CMS cost report, Worksheet G-3).
$11.2M

What does this home offer?

Housekeeping icon
Housekeeping icon

Housekeeping Services

Social and recreational activities icon

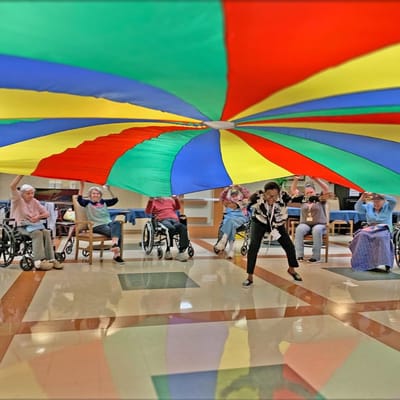
Social and Recreational Activities

On-site medical care and health services icon

On-site Medical Care and Health Services

Rehabilitative support icon

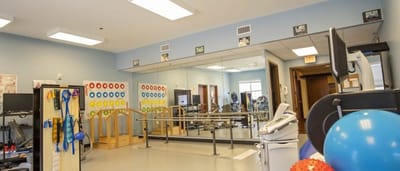
Rehabilitative Support

Who this home usually serves

TYPE OF STAY

Primarily short stays

Residents typically stay for brief periods, with frequent admissions and discharges throughout the year.

Most new residents arrive under private pay (95% of admissions), and a typical private pay stay runs around 2 - 3 months.

Admissions
353 total

Coverage residents most often arrive under.

Medicare 4%
Private pay 95%
Medicaid 1%
Discharges
353 total

Coverage residents most often leave under.

Medicare 3%
Private pay 85%
Medicaid 13%

Places of interest near TN State Veterans Home

Address 5.4 miles from city center Info Estimated distance in miles from Murfreesboro's city center to TN State Veterans Home's address, calculated via Google Maps.

Calculate Travel Distance to TN State Veterans Home

Add your location

Address

Compare Nursing Homes around Murfreesboro

The information below is reported by the Tennessee Department of Health, Division of Health Care Facilities.

4 facilities compared · CMS & TN Dept. of Health data

NHC HealthCare Murfreesboro
NH
HC
NC
Murfreesboro
181
Facility 181
TN AVG 88
Rank #13 / 426
27.6%
Facility 27.6%
TN AVG 73%
Rank #316 / 319
-62%
3.61
Facility 3.61
TN AVG 3.63
Rank #70 / 192
+40%0%
$0
Facility $0
TN AVG $90.9k
Rank #1 / 198
16
Facility 16
TN AVG 15.4
Rank #103 / 196
5.3
Facility 5.3
TN AVG 4.4
Rank #140 / 196
250A+
0
Facility 0
TN AVG 34
Rank #531 / 553
Lynn Foster
$14.3M
Facility $14.3M
TN AVG $11.5M
Rank #60 / 196
$7.8M
Facility $7.8M
TN AVG $4.6M
Rank #38 / 196
54.5%
Facility 54.5%
TN AVG 41%
Rank #51 / 196
445108
Stones River Manor, Inc.
NH
ADC
AL
IL
MC
RC
Murfreesboro
30
Facility 30
TN AVG 88
Rank #411 / 426
91.9%
Facility 91.9%
TN AVG 73%
Rank #47 / 319
+26%
6.09
Facility 6.09
TN AVG 3.63
Rank #3 / 192
-59%+68%
$0
Facility $0
TN AVG $90.9k
Rank #1 / 198
17
Facility 17
TN AVG 15.4
Rank #117 / 196
3.4
Facility 3.4
TN AVG 4.4
Rank #66 / 196
-26-
5
Facility 5
TN AVG 34
Rank #480 / 553
Jeffrey Adcock
$4.7M
Facility $4.7M
TN AVG $11.5M
Rank #184 / 196
$2.6M
Facility $2.6M
TN AVG $4.6M
Rank #184 / 196
55%
Facility 55%
TN AVG 41%
Rank #67 / 196
445534
AdamsPlace
NH
AL
IL
MC
Murfreesboro (Haynes Haven)
149
Facility 149
TN AVG 88
Rank #39 / 426
67.8%
Facility 67.8%
TN AVG 73%
Rank #23 / 319
-7%
3.71
Facility 3.71
TN AVG 3.63
Rank #61 / 192
+33%+2%
$0
Facility $0
TN AVG $90.9k
Rank #1 / 198
3
Facility 3
TN AVG 15.4
Rank #11 / 196
3.0
Facility 3.0
TN AVG 4.4
Rank #48 / 196
-40-
49
Facility 49
TN AVG 34
Rank #149 / 553
John Winfree
$14.1M
Facility $14.1M
TN AVG $11.5M
Rank #55 / 196
$8.3M
Facility $8.3M
TN AVG $4.6M
Rank #39 / 196
58.9%
Facility 58.9%
TN AVG 41%
Rank #62 / 196
445392
TN State Veterans Home
NH
NC
Murfreesboro (Esquire Estates)
140
Facility 140
TN AVG 88
Rank #47 / 426
73.1%
Facility 73.1%
TN AVG 73%
Rank #185 / 319
0%
4.71
Facility 4.71
TN AVG 3.63
Rank #18 / 192
-40%+30%
$193.2k
Facility $193.2k
TN AVG $90.9k
Rank #190 / 198
21
Facility 21
TN AVG 15.4
Rank #143 / 196
7.0
Facility 7.0
TN AVG 4.4
Rank #173 / 196
598-
15
Facility 15
TN AVG 34
Rank #422 / 553
Tennessee State Veterans Home Board
$16.8M
Facility $16.8M
TN AVG $11.5M
Rank #76 / 196
$5.7M
Facility $5.7M
TN AVG $4.6M
Rank #96 / 196
34%
Facility 34%
TN AVG 41%
Rank #134 / 196
445270

Financial Assistance for
Nursing Home in Tennessee

TN State Veterans Home is located in Murfreesboro, Tennessee.
Here are the financial assistance programs available to residents in Tennessee.

Get Financial aid guidance

CHOICES Program

TN Medicaid CHOICES

Age 65+ or disabled
General Tennessee resident, Medicaid-eligible, nursing home-level care need.
Income Limits (2025) ~$2,829/month 300% FBR, individual
Asset Limits $2,000 (individual), $3,000 (couple).
TN

Managed care model; high rural demand.

Benefits
Personal care (5-7 hours/day) Respite (240 hours/year) Adult day care ($65/day) Home modifications ($1,500 avg.)

Tennessee Options for Community Living

TN Options

Age 60+
General Tennessee resident, at risk of nursing home.
Income Limits ~$2,000/month individual, varies
Asset Limits $5,000 individual
TN

Limited funding; rural/urban balance.

Benefits
In-home care (3-5 hours/week) Respite (up to 10 days/year) Transportation (~5 trips/month)

Medicare Savings Program (MSP)

Tennessee Medicare Savings Program

Age 65+ or disabled
General TN resident, Medicare Part A/B.
Income Limits (2025) ~$2,510/month (QMB), ~$3,380/month (SLMB), ~$3,598/month (QI)—individual.
Asset Limits $9,430 (individual), $14,130 (couple).
TN

Three tiers; includes Extra Help for Part D; no waitlist.

Benefits
Covers Part B premiums ($174.70/month) Deductibles ($240/year) Copays (~20%)

Family Caregiver Support Program (FCSP)

Tennessee Family Caregiver Support Program

Age
General Caregivers of 60+ needing care or 55+ caregivers of others; TN resident; functional needs (2+ ADLs).
Income Limits (2025) No strict cap; prioritizes low-income ~$24,980/year
Asset Limits Not assessed; need-based.
TN

Includes grandparent caregivers; high rural demand.

Benefits
Respite (4-6 hours/week or 5 days/year) Adult day care ($60/day) Training Supplies (~$500/year)

VA Aid and Attendance (A&A) and Housebound Benefits

Tennessee VA Aid and Attendance/Housebound

Age 65+ or disabled veteran/spouse
General TN resident, wartime service, need for ADL help (A&A) or homebound.
Income Limits (2025) Net income < ~$1,984/month (veteran with dependent, A&A); pension offsets income.
Asset Limits ~$155,356 net worth limit
TN

High veteran population; supports rural/urban care needs.

Benefits
Cash (~$1,433-$2,642/month veteran, ~$951-$1,318 spouse) for care costs (e.g., in-home, assisted living)

Elderly Nutrition Program

Tennessee Elderly Nutrition Program

Age 60+
General TN resident; no income limit but prioritizes low-income.
Income Limits (2025) None; donations encouraged.
Asset Limits Not assessed.
TN

Serves ~50,000 annually; 200+ congregate sites plus Meals on Wheels.

Benefits
Congregate meals ($5-$7/meal value) at senior centers Home-delivered meals ($5-$7/meal)

Property Tax Relief Program

Tennessee Property Tax Relief Program

Age 65+
General TN resident, homeowner/renter (or widow/er 50+, disabled 18+).
Income Limits (2025) ~$45,000/year household, excludes half of Social Security
Asset Limits Not assessed; income-focused.
TN

Rebates up to $1,000; serves ~100,000 annually.

Benefits
Tax rebates (~$250-$1,000 based on income; e.g., $1,000 if income < $8,000)

Frequently Asked Questions about TN State Veterans Home

What neighborhood is TN State Veterans Home in?

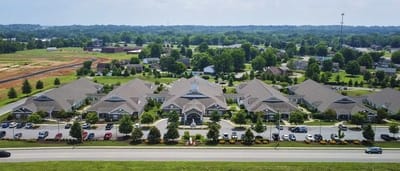
TN State Veterans Home is in the Esquire Estates neighborhood.

Is TN State Veterans Home in a walkable area?

TN State Veterans Home has a walk score of 15. Car-dependent. Most errands require a car, with limited nearby walkable options.

What is the occupancy rate at TN State Veterans Home?

TN State Veterans Home's occupancy is 73.1%.

Does TN State Veterans Home operate as a for-profit or non-profit?

TN State Veterans Home is registered as a for-profit.

Are there photos of TN State Veterans Home?

Yes — there are 82 photos of TN State Veterans Home in the photo gallery on this page.

What is the address of TN State Veterans Home?

TN State Veterans Home is located at 345 Compton Rd, Murfreesboro, TN 37130.

What is the phone number of TN State Veterans Home?

(615) 895-8850 will put you in contact with the team at TN State Veterans Home.

Guides for Better Senior Living

Care Cost Calculator: See Prices in Your Area

Nursing Home Data Explorer

Don’t Wait Too Long: 7 Red Flag Signs Your Parent Needs Assisted Living Now

The True Cost of Assisted Living in 2025 – And How Families Are Paying For It

Understanding Senior Living Costs: Pricing Models, Discounts & Financial Assistance