Meadowview Rehabilitation And Nursing Center
Nursing Home, Hospice Care, Memory Care & Respite Care · Philadelphia, PA
CMS overall rating Info CMS (the Centers for Medicare & Medicaid Services) is the federal agency that rates nursing home quality. Its Overall Rating runs from 1 to 5 stars, combining health inspections, staffing, and quality measures, with inspections weighted most heavily.

Meadowview Rehabilitation And Nursing Center

Nursing Home, Hospice Care, Memory Care & Respite Care · Philadelphia, PA
CMS overall rating Info CMS (the Centers for Medicare & Medicaid Services) is the federal agency that rates nursing home quality. Its Overall Rating runs from 1 to 5 stars, combining health inspections, staffing, and quality measures, with inspections weighted most heavily.
Calculator: See prices in your area
Meadowview Rehabilitation And Nursing Center accepts Medicare, Medicaid, and private pay.

Overview of Meadowview Rehabilitation and Nursing Center

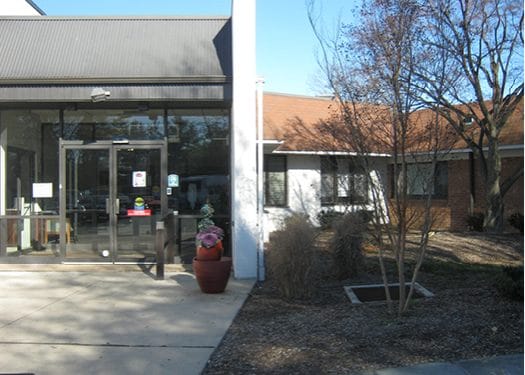
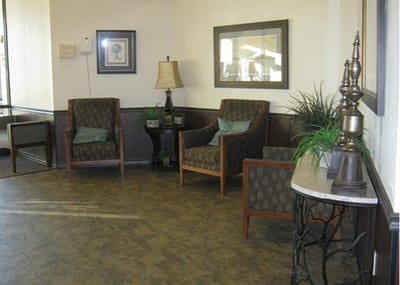
Meadowview Rehabilitation and Nursing Center is a top-rated nursing home in Philadelphia, PA, offering memory care, skilled nursing, rehabilitation, and hospice. Dedicated to older adults’ comfort and healing, the community continuously promotes a compassionate and welcoming environment. Chef-prepared meals, 24-hour care, and recreational opportunities are also offered to enrich residents’ living experiences. Through personalized care plans, residents receive exceptional care dedicated to their recovery and well-being.

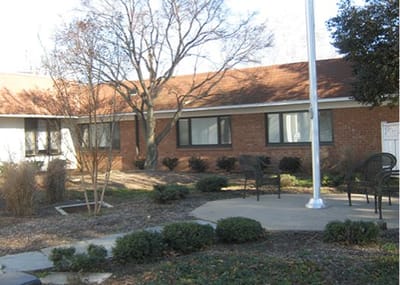
Educational programs, social gatherings, and fitness activities foster social engagement and encourage residents to continue learning. Lively common areas and accessible living spaces are also available, so residents can rest and move around comfortably. Residents also experience a stress-free retirement, as it is beautifully located in the tree-lined neighborhood of Philadelphia. As one of the trusted options for senior living in Pennsylvania, this nursing home strives to help older adults thrive in retirement.

Quality ratings

Measured by Centers for Medicare & Medicaid Services (CMS)

Overall rating Info The Overall CMS Rating combines results from health inspections, staffing levels and quality measures. Health inspections carry the most weight. Staffing and quality scores can increase or decrease the final rating based on performance compared to state and national standards.
▼ 33.3% Below PA avg. ▼ 33.3% Below PA avg.PA average: 3.0Click the badge to see the full State ranking.Click here to see the full State ranking.
Health Inspection Info Based on the results of the facility's three most recent standard inspections and any complaint investigations. CMS reviews the number, scope, and severity of deficiencies, with more recent findings weighted more heavily.
▼ 28.5% Below PA avg. ▼ 28.5% Below PA avg.PA average: 2.8Click the badge to see the full State ranking.Click here to see the full State ranking.
Staffing Info Measures average nursing staff hours per resident per day, including Registered Nurses (RNs) and total nursing staff. Ratings are adjusted based on the level of care residents require and are compared to state and national benchmarks.
▼ 11.5% Below PA avg. ▼ 11.5% Below PA avg.PA average: 3.4Click the badge to see the full State ranking.Click here to see the full State ranking.
Quality Measures Info Based on clinical and physical health indicators reported to CMS, such as hospital readmissions, falls, pressure ulcers, and improvements in mobility. These measures reflect how well residents' health needs are being managed.
▲ 17.9% Above PA avg. ▲ 17.9% Above PA avg.PA average: 3.4Click the badge to see the full State ranking.Click here to see the full State ranking.

Staffing hours breakdown

Info Daily nursing hours per resident by staff type, reported to CMS. Higher is generally better — compare this facility to state and national averages to see where staffing stands.

Hours per resident per day — compared to Pennsylvania state averages

Total nursing care / resident Info This home is ranked 99th out of 207 homes in Pennsylvania for nurse hours. Total adjusted nursing hours per resident per day, combining RN, LPN, and aide time. CMS adjusts this for case-mix so facilities can be fairly compared.
4h 9m per day
Rank #99 / 207Nurse hours — State benchmarkedThis home is ranked 99th out of 207 homes in Pennsylvania. Shows adjusted nurse hours per resident per day benchmarked to the Pennsylvania average, with a ranking across 207 Pennsylvania facilities. More hours mean more direct care. The national average is about 3.5 hrs; below 3.0 is a red flag.Rankings are based only on facilities in Pennsylvania that report data for that category. Facilities without available data are excluded from the ranking.Click the rank badge to see the full State ranking.Click here to see the full State ranking.
This facility Pennsylvania avg (4h 9m per day)
vs Pennsylvania avg
+0%

5 of 6 metrics below state avg

Standout metric LPN / LVN is +15% above state avg
Staff typeHours / Day / Residentvs state avg
Registered Nurse (RN) Info RNs hold the highest nursing license and can assess residents, interpret test results, and direct care plans. More RN hours per day often signals stronger clinical oversight and faster response to health changes. 22m per day ▼ 54% State avg: 47m per day · National avg: 41m per day
LPN / LVN Info Licensed Practical Nurses (LPNs) or Licensed Vocational Nurses (LVNs) deliver routine hands-on care — medication administration, wound dressing, and monitoring vital signs. They work under RN supervision and make up a large share of daily bedside care. 1h 3m per day ▲ 15% State avg: 55m per day · National avg: 52m per day
Nurse Aide Info Certified Nurse Aides (CNAs) provide the most direct day-to-day assistance: bathing, dressing, feeding, and mobility. Nurse aide hours are typically the largest staffing category and directly affect residents' quality of life. 2h 6m per day ▼ 5% State avg: 2h 12m per day · National avg: 2h 21m per day
Weekend Total Nursing Info Combined nursing hours (RN + LPN + Nurse Aide) per resident per day on weekends. Staffing often drops on weekends — this figure reveals whether the facility maintains adequate coverage outside of weekday hours. 3h 19m per day ▼ 5% State avg: 3h 31m per day · National avg: 3h 26m per day
Physical Therapist Info Hours per resident per day provided by licensed Physical Therapists (PTs) or PT Assistants. PT services help residents recover mobility after injury or illness and are especially important for post-acute (short-stay) rehabilitation. 3m per day ▼ 44% State avg: 6m per day · National avg: 4m per day
Weekend RN Info Registered nurse hours specifically on weekends. Facilities sometimes reduce RN presence on Saturdays and Sundays — a low weekend RN figure compared to weekday hours can indicate reduced clinical oversight when most administrative staff are absent. 16m per day ▼ 53% State avg: 33m per day · National avg: 29m per day

Capacity and availability

This home usually has limited availability

Higher occupancy than the Pennsylvania average: 78.7%
Occupancy rate
90.9% Rank #48 / 518Occupancy rate — State benchmarkedThis home is ranked 48th out of 518 homes in Pennsylvania. Shows this facility's occupancy rate versus the Pennsylvania average, with its Statewide rank out of 518. Higher occupancy signals strong local demand and financial stability.Rankings are based only on facilities in Pennsylvania that report data for that category. Facilities without available data are excluded from the ranking.Click the rank badge to see the full State ranking.Click here to see the full State ranking.
Avg. Length of Stay
150 days
Bed community size
244-bed community Rank #12 / 555Bed count — State benchmarkedThis home is ranked 12th out of 555 homes in Pennsylvania. Shows this facility's certified or reported bed count compared to other Pennsylvania facilities. Larger communities may offer more amenities, programs, and on-site services for residents and families.Rankings are based only on facilities in Pennsylvania that report data for that category. Facilities without available data are excluded from the ranking.Click the rank badge to see the full State ranking.Click here to see the full State ranking.
A large-scale community that may provide a wide range of amenities, services, and structured programs.
Walk Score
Walk Score: 23 / 100 Rank #514 / 668Walk Score — State benchmarkedThis home is ranked 514th out of 668 homes in Pennsylvania. Shows how walkable this facility's neighborhood is compared to the average Walk Score across Pennsylvania facilities. Higher scores benefit residents, families, and staff.Rankings are based only on facilities in Pennsylvania that report data for that category. Facilities without available data are excluded from the ranking.Click the rank badge to see the full State ranking.Click here to see the full State ranking.
Car-dependent. Most errands require a car, with limited nearby walkable options.

Contact Meadowview Rehabilitation And Nursing Center

Staffing Data

Reporting period: October 1 – December 31, 2025 (Q4 2025). Source: CMS Payroll-Based Journal report.

Total staff 378
Employees 156
Contractors 222
Staff to resident ratio 1.69 : 1
8% fewer staff per resident than Pennsylvania average
Pennsylvania average ratio: 1.83 : 1 Pennsylvania average ratio: 1.83 : 1See full Pennsylvania ranking
Avg staff/day 95
Average shift 9.2 hours
18% better than Pennsylvania average
Pennsylvania average: 7.8 hours Pennsylvania average shift: 7.8 hoursSee full Pennsylvania ranking
Total staff hours (quarter) 80,110

Nursing staff breakdown

Q4 2025 · Oct 1 – Dec 31 More info This data comes from the CMS Payroll-Based Journal report covering October 1 – December 31, 2025.
Registered Nurse

Manages medical care and health needs.

RN Staff Info All 14 RN Staff are full-time employees. No contractors work on this role. 14
Average shift length Info Average shift length. Calculated as total hours divided by days worked and average staff per day. 9.6 hours
Licensed Practical Nurse

Assists with medical care and medications.

LPN Staff Info 115 total: 41 full-time employees and 74 contractors. 115
Average shift length Info Average shift length. Calculated as total hours divided by days worked and average staff per day. 8.8 hours
Certified Nursing Assistant

Helps with daily care and mobility.

CNA Staff Info 218 total: 72 full-time employees and 146 contractors. 218
Average shift length Info Average shift length. Calculated as total hours divided by days worked and average staff per day. 9.8 hours

Contractor staffing

Q4 2025 · Oct 1 – Dec 31 More info This data comes from the CMS Payroll-Based Journal report covering October 1 – December 31, 2025.

Total hours from contractors

17.2%

13,762 contractor hours this quarter

Certified Nursing Assistant: 146 Licensed Practical Nurse: 74 Medical Director: 1 Occupational Therapy Assistant: 1

Staff by category

Q4 2025 · Oct 1 – Dec 31 More info This data comes from the CMS Payroll-Based Journal report covering October 1 – December 31, 2025.
Certified Nursing Assistant7214621842,57692100%9.8
Licensed Practical Nurse417411521,00592100%8.8
Registered Nurse140146,89492100%9.6
Other Dietary Services Staff4041,5039098%7.5
Respiratory Therapy Technician5051,1426874%7.7
Dental Services Staff2029716975%7.8
Speech Language Pathologist2028906773%7.9
Dietitian2027736267%7.8
Occupational Therapy Aide2026926672%6.2
RN Director of Nursing2026006368%8.7
Mental Health Service Worker1014886267%7.9
Administrator1014725964%8
Physical Therapy Assistant2024655661%7.6
Qualified Social Worker2024525762%7.8
Nurse Practitioner1014325560%7.9
Physical Therapy Aide1014245358%8
Nurse Aide in Training2022001617%7.2
Occupational Therapy Assistant011781415%5.5
Medical Director01154910%6
218 Certified Nursing Assistant
% of Days 100%
115 Licensed Practical Nurse
% of Days 100%
14 Registered Nurse
% of Days 100%
4 Other Dietary Services Staff
% of Days 98%
5 Respiratory Therapy Technician
% of Days 74%
2 Dental Services Staff
% of Days 75%
2 Speech Language Pathologist
% of Days 73%
2 Dietitian
% of Days 67%
2 Occupational Therapy Aide
% of Days 72%
2 RN Director of Nursing
% of Days 68%
1 Mental Health Service Worker
% of Days 67%
1 Administrator
% of Days 64%
2 Physical Therapy Assistant
% of Days 61%
2 Qualified Social Worker
% of Days 62%
1 Nurse Practitioner
% of Days 60%
1 Physical Therapy Aide
% of Days 58%
2 Nurse Aide in Training
% of Days 17%
1 Occupational Therapy Assistant
% of Days 15%
1 Medical Director
% of Days 10%

Penalties and fines

Includes penalties issued in 2024

Federal penalties imposed by CMS for regulatory violations, including civil money penalties (fines) and denials of payment for new Medicare/Medicaid admissions.

Source: CMS Penalties Database (Data as of Jan 2026)

Total fines amount $79K Rank #199 / 210Federal fines — State benchmarkedThis home is ranked 199th out of 210 homes in Pennsylvania. Shows this facility's cumulative CMS federal fine dollars versus the Pennsylvania average among facilities with fines, and where it ranks among 210 facilities in the pool. Lower total dollars mean a better rank.Rankings are based only on facilities in Pennsylvania that report data for that category. Facilities without available data are excluded from the ranking.Click the rank badge to see the full State ranking.Click here to see the full State ranking.
34% higher than Pennsylvania average

Pennsylvania average: $59K

Number of fines 1
52% fewer fines than Pennsylvania average

Pennsylvania average: 2.1

Payment Denials Info Serious action where Medicare and/or Medicaid temporarily stops payments for new residents until issues are fixed. 0
100% fewer payment denials than Pennsylvania average

Pennsylvania average: 0.2

Fines amount comparison
This facility $79K
Pennsylvania average $59K
Penalty History

Penalties are imposed by CMS for violations of federal nursing home regulations.

1 penalty in the past 3 years

Jan 5, 2024 · $79K

Civil Money Penalty Info Fines imposed for noncompliance, which can be assessed per day or per instance of violation. Jan 5, 2024
$79K

Last updated: Jan 2026

Quality of care over time

These measures show how residents usually do over time at this home, based on health outcomes and preventive care.

High-risk clinical events score Info A composite score based on pressure ulcers, falls with injury, weight loss, walking ability decline, and activities of daily living decline. 10.1
8% better than Pennsylvania average

Pennsylvania average: 11.0

Functional decline score Info A composite score based on activities of daily living decline, walking ability decline, and incontinence. 21.8
In line with Pennsylvania average

Pennsylvania average: 22.2

Long-stay resident measures
Above average Info CMS star rating based on long-stay quality measure performance. 5 stars = significantly above average, 1 star = significantly below average.
Need for Help with Daily Activities Increased Info Percent of long-stay residents whose need for help with daily activities has increased 21.2%
12% worse than Pennsylvania average

Pennsylvania average: 19.0%

Walking Ability Worsened Info Percent of long-stay residents whose ability to move independently worsened 19.0%
10% better than Pennsylvania average

Pennsylvania average: 21.1%

Low Risk Residents with Bowel/Bladder Incontinence Info Percent of low risk long-stay residents who lose control of their bowels or bladder 25.2%
5% better than Pennsylvania average

Pennsylvania average: 26.7%

Falls with Major Injury Info Percent of long-stay residents experiencing one or more falls with major injury 2.2%
30% better than Pennsylvania average

Pennsylvania average: 3.2%

High Risk Residents with Pressure Ulcers Info Percent of long-stay high risk residents with pressure ulcers 5.4%
In line with Pennsylvania average

Pennsylvania average: 5.5%

Urinary Tract Infection Info Percent of long-stay residents with a urinary tract infection 0.0%
100% better than Pennsylvania average

Pennsylvania average: 1.8%

Lost Too Much Weight Info Percent of long-stay residents who lose too much weight 2.6%
60% better than Pennsylvania average

Pennsylvania average: 6.6%

Depressive Symptoms Info Percent of long-stay residents who have depressive symptoms 1.5%
74% better than Pennsylvania average

Pennsylvania average: 5.5%

Antipsychotic Use Info Percent of long-stay residents who received an antipsychotic medication 30.4%
78% worse than Pennsylvania average

Pennsylvania average: 17.1%

Pneumococcal Vaccine Info Percent of long-stay residents assessed and appropriately given the pneumococcal vaccine 84.4%
In line with Pennsylvania average

Pennsylvania average: 86.9%

Influenza Vaccine Info Percent of long-stay residents assessed and appropriately given the seasonal influenza vaccine 90.9%
In line with Pennsylvania average

Pennsylvania average: 93.5%

Hospitalizations per 1,000 days Info Number of hospitalizations per 1,000 long-stay resident days. 0.87
48% better than Pennsylvania average

Pennsylvania average: 1.68

ED visits per 1,000 days Info Number of outpatient emergency department visits per 1,000 long-stay resident days. 1.33
11% worse than Pennsylvania average

Pennsylvania average: 1.20

Short-stay resident measures
Average Info CMS star rating based on short-stay quality measure performance. 5 stars = much above average, 1 star = much below average.
Pneumococcal Vaccine Info Percent of short-stay residents assessed and appropriately given the pneumococcal vaccine 23.9%
65% worse than Pennsylvania average

Pennsylvania average: 68.8%

Antipsychotic medication increase Info Percent of short-stay residents who newly received an antipsychotic medication 2.1%
37% worse than Pennsylvania average

Pennsylvania average: 1.5%

Influenza Vaccine Info Percent of short-stay residents assessed and appropriately given the seasonal influenza vaccine 28.0%
59% worse than Pennsylvania average

Pennsylvania average: 68.7%

Re-hospitalized after SNF stay Info Percentage of short-stay residents who were re-hospitalized after their nursing home admission. 26.1%
13% worse than Pennsylvania average

Pennsylvania average: 23.1%

Emergency department visits Info Percentage of short-stay residents who had an outpatient emergency department visit. 7.2%
27% better than Pennsylvania average

Pennsylvania average: 9.8%

Falls with major injury Info Percentage of SNF residents who experience falls with major injury during their stay. 0.7%
13% better than Pennsylvania average

Pennsylvania average: 0.8%

Ability to care for self at discharge Info Percentage of residents at or above expected ability to care for themselves at discharge. 48.6%
10% worse than Pennsylvania average

Pennsylvania average: 53.7%

Successful return to home or community Info Rate of successful return to home or community from a skilled nursing facility. 50.6%
In line with Pennsylvania average

Pennsylvania average: 50.6%

Breakdown by payment type

Medicare

34% of new residents, usually for short-term rehab.

Typical stay 21 days

Private pay

38% of new residents, often for short stays.

Typical stay 1 - 2 months

Medicaid

28% of new residents, often for long-term daily care.

Typical stay 1 years

Facility Characteristics

Source: CMS Long-Term Care Facility Characteristics (Data as of Jan 2026)

Total residents 224
Medicare
16
7.1% of residents
Medicaid
159
71% of residents
Private pay or other
49
21.9% of residents
Programs & Services
Residents Group

Residents meet regularly to discuss policies, care quality, and activities

Active Resident Council

Organized group of residents that meets regularly to discuss facility policies, quality of life, and activities.

Finances and operations

Based on CMS SNF Cost Report for fiscal year ending in 12/2023.

Voluntary non-profit community
Operated by a church.
Net patient revenue Info Net patient revenue — what the home actually collects for resident care, after contractual allowances, bad debt and discounts are subtracted from its gross charges (CMS cost report, Worksheet G-3). It covers resident care only; money the home earns from other sources is shown separately as "Other income."
$24.1M
Net patient income Info Net patient income: net patient revenue minus the home's total operating expenses. A positive figure means it earns more from resident care than it spends to deliver it; a negative figure means the opposite. It excludes non-operating "other income."
$910.6K
Voluntary non-profit community Operated by a church.
Net patient revenue Info Net patient revenue — what the home actually collects for resident care, after contractual allowances, bad debt and discounts are subtracted from its gross charges (CMS cost report, Worksheet G-3). It covers resident care only; money the home earns from other sources is shown separately as "Other income."
$24.1M Rank #83 / 209Revenue — State benchmarkedThis home is ranked 83rd out of 209 homes in Pennsylvania. Shows this facility's annual revenue compared to the Pennsylvania average. Higher revenue generally means more resources for staffing and capital — read alongside Payroll %.Rankings are based only on facilities in Pennsylvania that report data for that category. Facilities without available data are excluded from the ranking.Click the rank badge to see the full State ranking.Click here to see the full State ranking.
Net patient income Info Net patient income: net patient revenue minus the home's total operating expenses. A positive figure means it earns more from resident care than it spends to deliver it; a negative figure means the opposite. It excludes non-operating "other income."
$910.6K
Other income Info Money the home earns outside of resident care — such as investments, grants, rentals and other non-operating sources (CMS cost report, Worksheet G-3). It is tracked separately from net patient revenue: it is not part of that figure, and it is not included in net patient income.
$199.3K
Payroll costs Info Staff salaries plus wage-related costs — benefits such as payroll taxes, health insurance and retirement — from the home's own accounting records (CMS cost report, Worksheet A). Contract or agency labor is counted separately, under other operating costs. Rank #53 / 209Payroll — State benchmarkedThis home is ranked 53rd out of 209 homes in Pennsylvania. Shows total annual staff payroll benchmarked to the Pennsylvania average. Higher payroll investment relative to peers often signals better staffing and less reliance on cheaper contract labor.Rankings are based only on facilities in Pennsylvania that report data for that category. Facilities without available data are excluded from the ranking.Click the rank badge to see the full State ranking.Click here to see the full State ranking.
$11.5M 47.7% of net patient revenue Info Payroll as a share of revenue: staff salaries and wage-related benefits divided by net patient revenue. A higher figure means more of each revenue dollar goes to staff pay. Rank #37 / 209Payroll % — State benchmarkedThis home is ranked 37th out of 209 homes in Pennsylvania. Shows payroll as a percentage of revenue versus the Pennsylvania average. Well-run Pennsylvania facilities typically land around 53–61% — the top third Statewide. Below 25% may signal understaffing or heavy agency use — read with Staffing ratings.Rankings are based only on facilities in Pennsylvania that report data for that category. Facilities without available data are excluded from the ranking.Click the rank badge to see the full State ranking.Click here to see the full State ranking.
Other operating costs Info Everything it costs to run the home apart from payroll — food, utilities, supplies, maintenance, contract labor and administration. Calculated as total operating expense minus payroll (staff salaries and wage-related benefits).
$11.7M
Total costs Info The home's total operating expense for the year — all the costs of running it, salaries included (CMS cost report, Worksheet G-3).
$23.1M

What does this home offer?

Housing options icon

Housing Options: Private / Shared Rooms

Building type icon
Building type icon

Building Type: Single-story

Housekeeping icon
Housekeeping icon

Housekeeping Services

Social and recreational activities icon

Social and Recreational Activities

On-site medical care and health services icon

On-site Medical Care and Health Services

Rehabilitative support icon

Rehabilitative Support

Who this home usually serves

TYPE OF STAY

Mostly long-term care residents

Most residents stay for extended periods and receive ongoing daily care.

New residents most often arrive under private pay (38% of admissions), and a typical private pay stay runs around 1 - 2 months.

Admissions
547 total

Coverage residents most often arrive under.

Medicare 34%
Private pay 38%
Medicaid 28%
Discharges
539 total

Coverage residents most often leave under.

Medicare 16%
Private pay 32%
Medicaid 52%

Places of interest near Meadowview Rehabilitation And Nursing Center

Address 12.6 miles from city center Info Estimated distance in miles from Philadelphia's city center to Meadowview Rehabilitation And Nursing Center's address, calculated via Google Maps.

Calculate Travel Distance to Meadowview Rehabilitation And Nursing Center

Add your location

Address

Compare Nursing Homes around Philadelphia

The information below is reported by the Pennsylvania Department of Human Services and Department of Health.

5 facilities compared · CMS & PA Dept. of Health data

Paul’s Run Retirement Community
NH
AL
IL
RC
Philadelphia (Bustleton)
170
Facility 170
PA AVG 94
Rank #36 / 555
95.4%
Facility 95.4%
PA AVG 78.7%
Rank #15 / 518
+21%
3.99
Facility 3.99
PA AVG 4.15
Rank #122 / 207
+6%-4%
$0
Facility $0
PA AVG $61.2k
Rank #1 / 210
-
15
Facility 15
PA AVG 31.3
Rank #92 / 207
5.0
Facility 5.0
PA AVG 4.4
Rank #141 / 207
-111A
66
Facility 66
PA AVG 46
Rank #167 / 668
Liberty Lutheran Services
$15.5M
Facility $15.5M
PA AVG $32.8M
Rank #21 / 209
$16.6M
Facility $16.6M
PA AVG $6.7M
Rank #32 / 209
107.1%
Facility 107.1%
PA AVG 40%
Rank #173 / 209
395738
Buckingham Valley Rehabilitation and Nursing Center
NH
HC
NC
PC
RC
Newtown (Durham Road)
130
Facility 130
PA AVG 94
Rank #90 / 555
92.0%
Facility 92.0%
PA AVG 78.7%
Rank #42 / 518
+17%
3.31
Facility 3.31
PA AVG 4.15
Rank #196 / 207
-29%-20%
$0
Facility $0
PA AVG $61.2k
Rank #1 / 210
-
10
Facility 10
PA AVG 31.3
Rank #67 / 207
2.0
Facility 2.0
PA AVG 4.4
Rank #31 / 207
-124A+
15
Facility 15
PA AVG 46
Rank #568 / 668
Bpsh Holdings LLC
$17.1M
Facility $17.1M
PA AVG $32.8M
Rank #44 / 209
$6.8M
Facility $6.8M
PA AVG $6.7M
Rank #124 / 209
39.6%
Facility 39.6%
PA AVG 40%
Rank #206 / 209
395188
Fountain View at Logan Square
NH
IL
MC
RC
Philadelphia (Center City)
101
Facility 101
PA AVG 94
Rank #201 / 555
63.4%
Facility 63.4%
PA AVG 78.7%
Rank #327 / 518
-19%
3.14
Facility 3.14
PA AVG 4.15
Rank #204 / 207
+20%-24%
$43.2k
Facility $43.2k
PA AVG $61.2k
Rank #190 / 210
77
Facility 77
PA AVG 83
Rank #315 / 460
50
Facility 50
PA AVG 31.3
Rank #181 / 207
3.6
Facility 3.6
PA AVG 4.4
Rank #103 / 207
164-
95
Facility 95
PA AVG 46
Rank #6 / 668
Steven Stefanelli
$17.4M
Facility $17.4M
PA AVG $32.8M
Rank #53 / 209
$6.4M
Facility $6.4M
PA AVG $6.7M
Rank #67 / 209
36.6%
Facility 36.6%
PA AVG 40%
Rank #167 / 209
395662
Wesley Enhanced Living at Stapeley
NH
AL
IL
MC
Philadelphia (Northwest Philadelphia)
79
Facility 79
PA AVG 94
Rank #306 / 555
67.1%
Facility 67.1%
PA AVG 78.7%
Rank #296 / 518
-15%
3.78
Facility 3.78
PA AVG 4.15
Rank #148 / 207
+6%-9%
$8.8k
Facility $8.8k
PA AVG $61.2k
Rank #151 / 210
72
Facility 72
PA AVG 83
Rank #362 / 460
35
Facility 35
PA AVG 31.3
Rank #152 / 207
5.0
Facility 5.0
PA AVG 4.4
Rank #141 / 207
153-
81
Facility 81
PA AVG 46
Rank #73 / 668
Kenneth Beiler
$19.4M
Facility $19.4M
PA AVG $32.8M
Rank #76 / 209
$13.1M
Facility $13.1M
PA AVG $6.7M
Rank #69 / 209
67.4%
Facility 67.4%
PA AVG 40%
Rank #105 / 209
395715
Meadowview Rehabilitation And Nursing Center
NH
HC
MC
RC
Philadelphia
244
Facility 244
PA AVG 94
Rank #12 / 555
90.9%
Facility 90.9%
PA AVG 78.7%
Rank #48 / 518
+15%
4.15
Facility 4.15
PA AVG 4.15
Rank #99 / 207
-69%0%
$79.4k
Facility $79.4k
PA AVG $61.2k
Rank #199 / 210
-
41
Facility 41
PA AVG 31.3
Rank #161 / 207
5.1
Facility 5.1
PA AVG 4.4
Rank #152 / 207
1222-
23
Facility 23
PA AVG 46
Rank #514 / 668
Wm Holdings LLC
$24.1M
Facility $24.1M
PA AVG $32.8M
Rank #83 / 209
$11.5M
Facility $11.5M
PA AVG $6.7M
Rank #53 / 209
47.7%
Facility 47.7%
PA AVG 40%
Rank #37 / 209
395296

Financial Assistance for
Nursing Home in Pennsylvania

Meadowview Rehabilitation And Nursing Center is located in Philadelphia, Pennsylvania.
Here are the financial assistance programs available to residents in Pennsylvania.

Get Financial aid guidance

Community HealthChoices (CHC)

PA Medicaid CHC

Age 65+ or disabled
General Pennsylvania resident, Medicaid-eligible, nursing home-level care need.
Income Limits (2025) ~$2,829/month 300% FBR, individual
Asset Limits $2,000 (individual), $3,000 (couple) (excludes home, car).
PA

Managed care model; high urban demand (e.g., Philadelphia, Pittsburgh).

Benefits
Personal care (5-7 hours/day, e.g., bathing, dressing) Respite care (up to 240 hours/year) Adult day care ($70/day) Home modifications ($1,500 avg.)

Pennsylvania OPTIONS Program

PA OPTIONS

Age 60+
General Pennsylvania resident, at risk of nursing home placement.
Income Limits ~$2,000/month individual, varies by region
Asset Limits $8,000 individual
PA

Cost-sharing required above certain income; rural/urban balance.

Benefits
In-home care (3-5 hours/week) Respite (up to 10 days/year) Adult day care (~$70/day) Transportation (~5 trips/month)

Living Independence for the Elderly (LIFE)

Pennsylvania LIFE (PACE)

Age 55+
General PA resident (specific counties), NFLOC, safe with LIFE support.
Income Limits (2025) ~$2,829/month (Medicaid-eligible); private pay option available.
Asset Limits $2,000 (individual), $3,000 (couple) for Medicaid enrollees.
PA

16 providers in 25 counties (e.g., Allegheny, Luzerne); LIFE branding unique to PA.

Benefits
Personal care (5-7 hours/day) Medical care Meals Transportation Respite Therapies

Medicare Savings Program (MSP)

Pennsylvania Medicare Savings Program

Age 65+ or disabled
General PA resident, Medicare Part A/B.
Income Limits (2025) ~$2,510/month (QMB), ~$3,380/month (SLMB), ~$3,598/month (QI)—individual.
Asset Limits $9,430 (individual), $14,130 (couple).
PA

Three tiers; includes Extra Help for Part D; no waitlist.

Benefits
Covers Part B premiums ($174.70/month) Deductibles ($240/year) Copays (~20%)

Family Caregiver Support Program (FCSP)

Pennsylvania Family Caregiver Support Program

Age
General Caregivers of 60+ needing care or 55+ caregivers of others; PA resident; functional needs (2+ ADLs).
Income Limits (2025) No strict cap; reimbursements up to $600/month if care recipient income < ~$2,322/month 185% FPL
Asset Limits Not assessed; need-based.
PA

High demand; includes grandparent caregivers.

Benefits
Respite (4-6 hours/week or 5 days/year) Adult day care ($60/day) Supplies (~$2,000/year) Caregiver training

VA Aid and Attendance (A&A) and Housebound Benefits

Pennsylvania VA Aid and Attendance/Housebound

Age 65+ or disabled veteran/spouse
General PA resident, wartime service, need for ADL help (A&A) or homebound.
Income Limits (2025) Net income < ~$1,984/month (veteran with dependent, A&A); pension offsets income.
Asset Limits ~$155,356 net worth limit
PA

High veteran population; supports rural/urban care needs.

Benefits
Cash (~$1,433-$2,642/month veteran, ~$951-$1,318 spouse) for care costs (e.g., in-home, assisted living)

Property Tax/Rent Rebate Program (PTRR)

Pennsylvania Property Tax/Rent Rebate Program

Age 65+
General PA resident, homeowner/renter (or widow/er 50+, disabled 18+).
Income Limits (2025) ~$45,000/year individual or couple, excludes half of Social Security
Asset Limits Not assessed; income-focused.
PA

Rebates up to $1,000; ~600,000 eligible annually.

Benefits
Rebates ($250-$1,000 based on income; e.g., $1,000 if income < $8,000)

Senior Farmers’ Market Nutrition Program (SFMNP)

Pennsylvania SFMNP

Age 60+
General PA resident, low-income.
Income Limits (2025) ~$2,322/month individual, 185% FPL
Asset Limits Not assessed.
PA

Vouchers (~$50/season) via 52 AAAs; serves ~200,000 annually.

Benefits
Vouchers (~$50/season) for fresh produce at approved markets

Frequently Asked Questions about Meadowview Rehabilitation And Nursing Center

Is Meadowview Rehabilitation And Nursing Center in a walkable area?

Meadowview Rehabilitation And Nursing Center has a walk score of 23. Car-dependent. Most errands require a car, with limited nearby walkable options.

What is the occupancy rate at Meadowview Rehabilitation And Nursing Center?

Meadowview Rehabilitation And Nursing Center's occupancy is 90.9%.

What is the best email address for Meadowview Rehabilitation And Nursing Center?

The team at Meadowview Rehabilitation And Nursing Center can be reached at [email protected].

Are there photos of Meadowview Rehabilitation And Nursing Center?

Yes — there are 3 photos of Meadowview Rehabilitation And Nursing Center in the photo gallery on this page.

What is the address of Meadowview Rehabilitation And Nursing Center?

Meadowview Rehabilitation And Nursing Center is located at 9209 Ridge Pike, Philadelphia, PA 19128.

What is the phone number of Meadowview Rehabilitation And Nursing Center?

(610) 825-6560 will put you in contact with the team at Meadowview Rehabilitation And Nursing Center.

Is Meadowview Rehabilitation And Nursing Center Medicare or Medicaid certified?

Yes — Meadowview Rehabilitation And Nursing Center is a CMS-certified provider of Medicare and Medicaid.

Guides for Better Senior Living

Care Cost Calculator: See Prices in Your Area

Nursing Home Data Explorer

Don’t Wait Too Long: 7 Red Flag Signs Your Parent Needs Assisted Living Now

The True Cost of Assisted Living in 2025 – And How Families Are Paying For It

Understanding Senior Living Costs: Pricing Models, Discounts & Financial Assistance