


Parry Home Assisted Living


Parry Home Assisted Living
Parry Home Assisted Living accepts Medicaid.
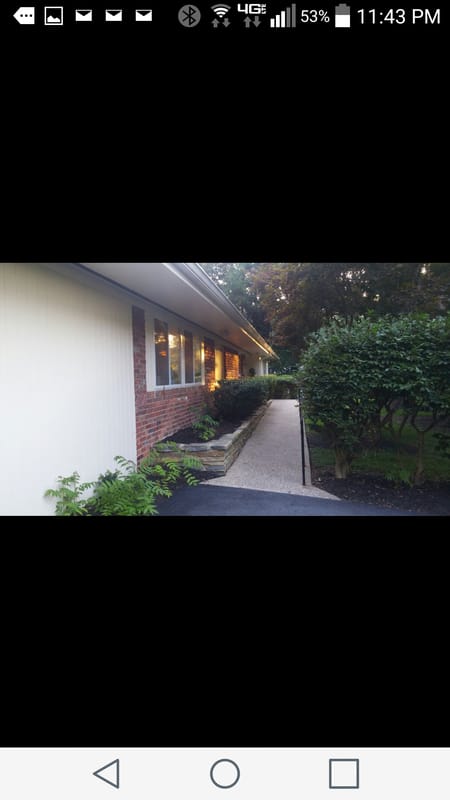
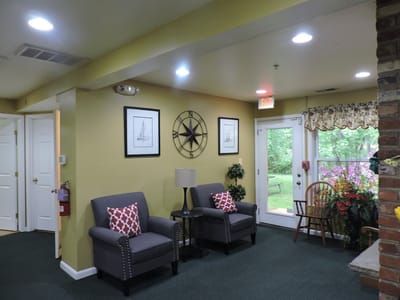
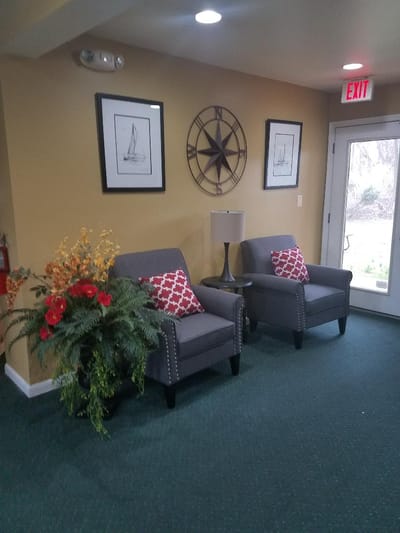
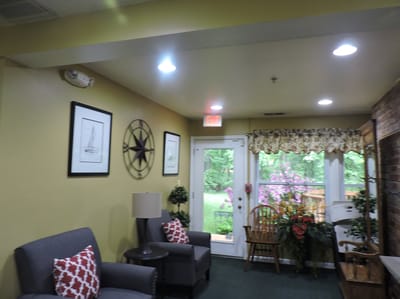
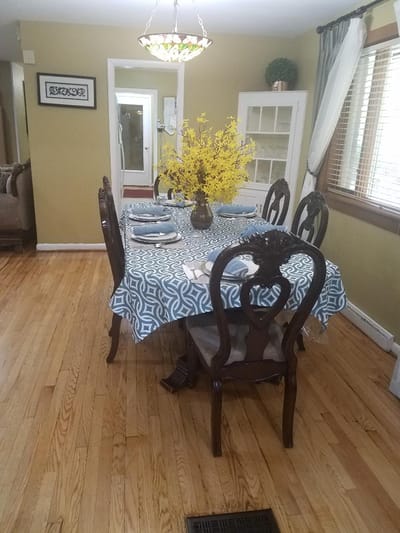
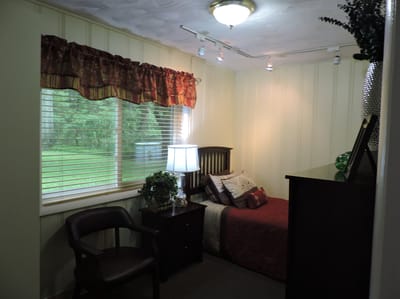
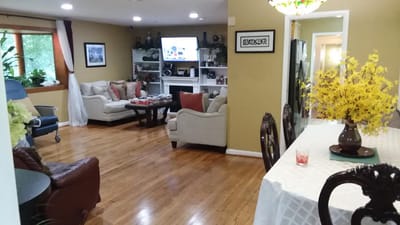
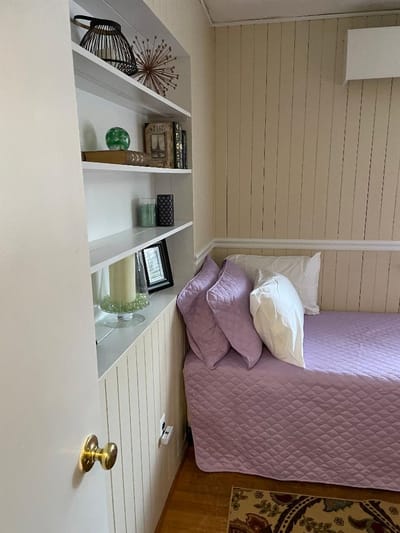
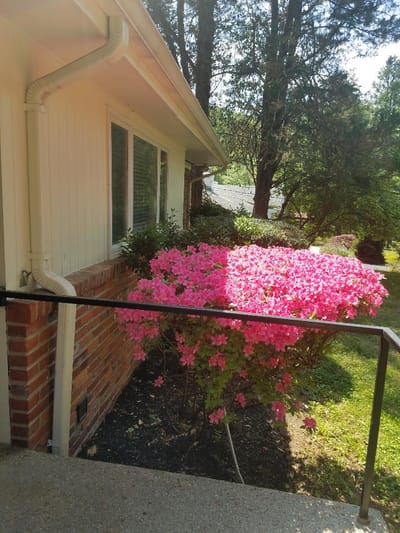
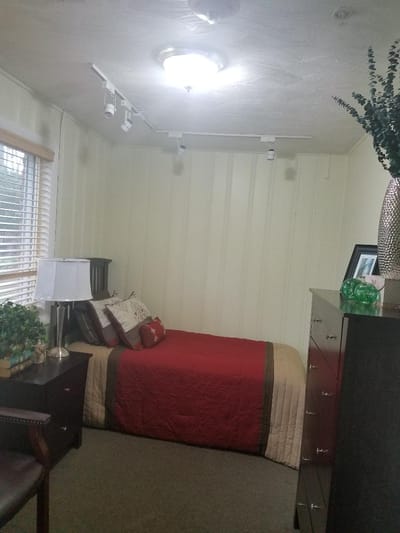
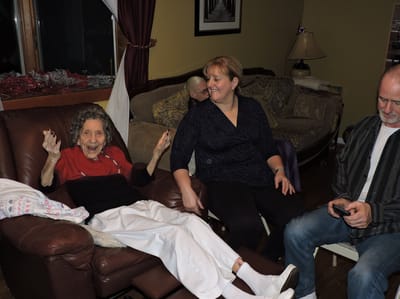
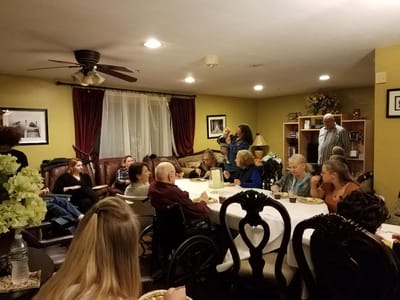
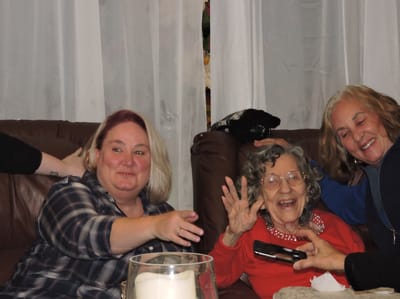
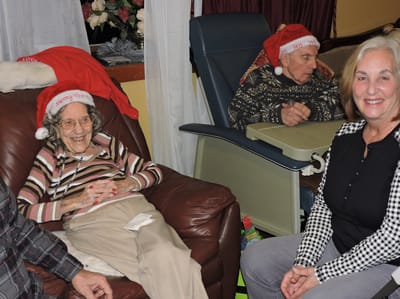
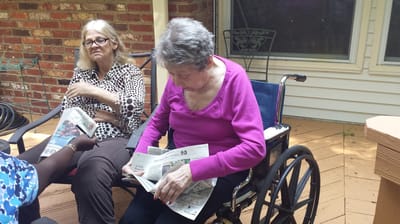
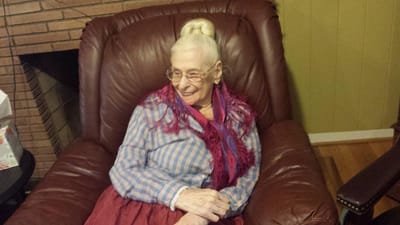
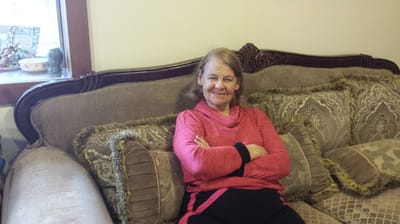
Parry Home Assisted Living is a place where family comes first. They believe in providing a warm and welcoming environment where every resident can find inner satisfaction for the soul. Round the clock care is offered by their dedicated staff, and the ranch-style life is also perfect for those looking for a lovely atmosphere and quaint interior.
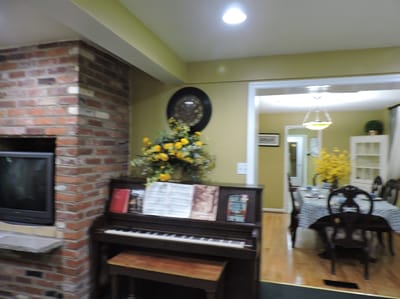
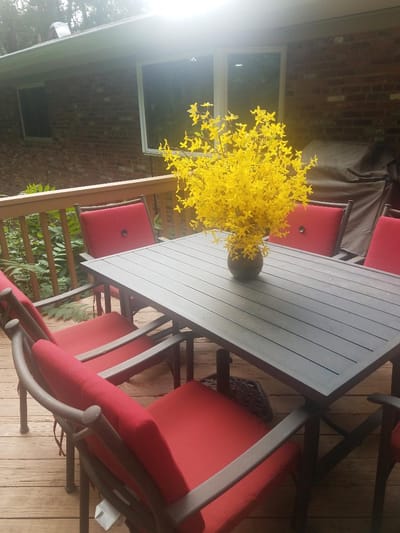
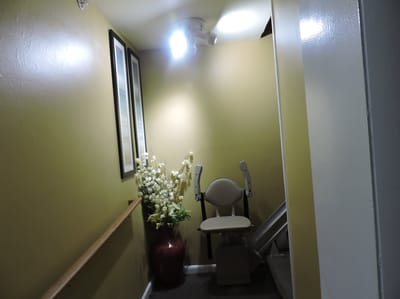
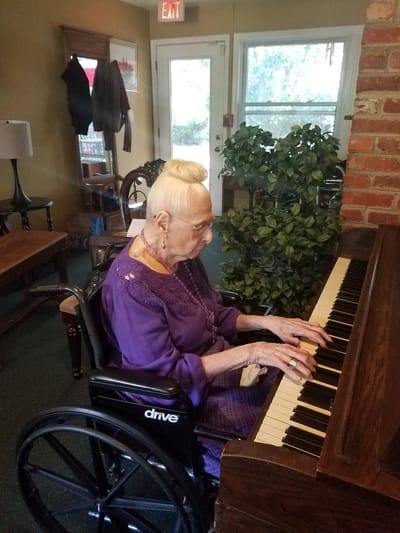
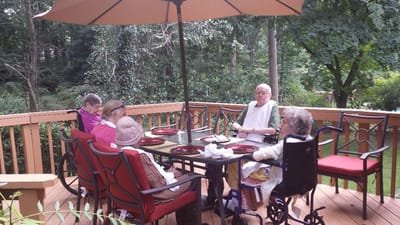
In addition to the regular services provided, Parry Home also offers respite care and podiatrist services. They specialize in Parkinson’s, diabetes care, and memory care. An in-house lab and x-ray services are also available. Housekeeping, laundry, and transportation services are provided to make life easier for their residents as well. A piano, fire alarm system, large deck, and Wi-Fi are some of the other amenities offered. The facility is also wheelchair accessible.
7-bed community Rank #393 / 697Bed count — State benchmarkedThis home is ranked 393rd out of 697 homes in Maryland. Shows this facility's certified or reported bed count compared to other Maryland facilities. Larger communities may offer more amenities, programs, and on-site services for residents and families.Rankings are based only on facilities in Maryland that report data for that category. Facilities without available data are excluded from the ranking.Click the rank badge to see the full State ranking.Click here to see the full State ranking.
A smaller, more intimate setting that may offer a quieter environment and closer staff-resident interactions.
Walk Score: 24 / 100 Rank #693 / 985Walk Score — State benchmarkedThis home is ranked 693rd out of 985 homes in Maryland. Shows how walkable this facility's neighborhood is compared to the average Walk Score across Maryland facilities. Higher scores benefit residents, families, and staff.Rankings are based only on facilities in Maryland that report data for that category. Facilities without available data are excluded from the ranking.Click the rank badge to see the full State ranking.Click here to see the full State ranking.
Car-dependent. Most errands require a car, with limited nearby walkable options.
About this community
Facility TypeAssisted Living
CountyBaltimore City
Wheelchair Accessible
Safety FeaturesFire alarm system, Round-the-clock monitored security system, 24-Hour CCTV/video surveillance system, Sprinkler system, Smoke alarm
Rehabilitation Services
Respite Care
Doctor on Staff
Nursing Services
24-Hour Staffing
Staff-to-Resident Ratio:
1 caregiver to 4 residents
No mild Alzheimer's level
No moderate Alzheimer's level
No severe Alzheimer's level
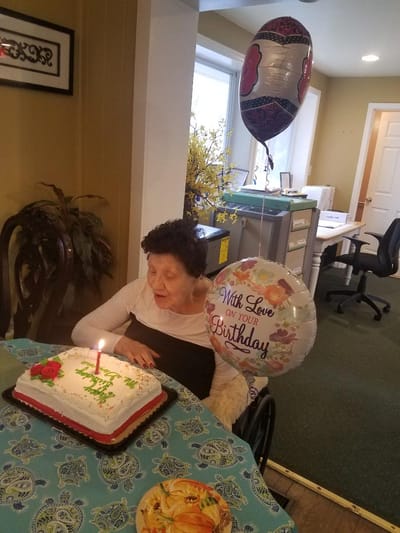
ActivitiesDaily social activities including live guest entertainment, family events, walking groups, arts & crafts, and more
Specific ProgramsIndividualized service plans, Special dietary plans, Grooming and ADLs, Mobility management, Pharmacy delivery services, Podiatrist services, Diabetes care, Parkinson's Management, Falls prevention, Medication administration and management, 24-hour staff, Daily social activities, Daily Home Cooked Meals, Housekeeping, Laundry Services, Transportation Service, Unisex beautician services
Volunteer Program
Operating Hours24 hours a day, 7 days a week
What does this home offer?
Housing Options: Private Rooms
Building Type: Single-story
Transportation Services
Places of interest near Parry Home Assisted Living
![]() 3.8 miles from city center
3.8 miles from city center
![]() Estimated distance in miles from Silver Spring's city center to Parry Home Assisted Living's address, calculated via Google Maps.
— 6.76 miles to nearest hospital (UM Laurel Medical Center)
Estimated distance in miles from Silver Spring's city center to Parry Home Assisted Living's address, calculated via Google Maps.
— 6.76 miles to nearest hospital (UM Laurel Medical Center)
Calculate Travel Distance to Parry Home Assisted Living
Add your location
Compare Assisted Living around Silver Spring
The information below is reported by the Maryland Department of Health, Office of Health Care Quality.
| Sunrise of Chevy Chase | AL MC | Silver Spring (Rock Creek Gardens) | 196
Facility
196
MD AVG
43
Rank
#10 / 697 | No |
71
Facility
71
MD AVG
43
Rank
#175 / 985 | Studio / 1 Bed / 2 Bed | 8
Facility
8
MD AVG
21
Rank
#162 / 208 |
58% Male Residents — State Benchmarked 58% of residents are male, compared to the Maryland average of 31%. An unusually high male share for assisted living, where most facilities skew heavily female. |
42% Female Residents — State Benchmarked 42% of residents are female, compared to the Maryland average of 69%. An unusually low female share — most assisted living facilities have 65–75% female residents. |
69% White Residents — State Benchmarked 69% of residents are reported as White, compared to the Maryland average of 81%. A lower White share than the Maryland average — the community may draw a more diverse resident mix relative to other facilities in Maryland. |
28% African American Residents — State Benchmarked 28% of residents are reported as African American or Black, compared to the Maryland average of 13%. A higher African American share than the typical Maryland average — useful context when comparing cultural fit and community composition. |
3% Other Ethnicity Residents — State Benchmarked 3% of residents fall into categories other than White or African American (combined), compared to the Maryland average of 6%. This column aggregates Hispanic, Asian, multiracial, and any other labeled groups that are not classified as White or African American. Reported subgroups in this total: Hispanic (2%), Asian (1%). |
12% Residents Age 65–74 — State Benchmarked 12% of residents are 65–74, compared to the Maryland average of 13%. In line with the statewide profile for this youngest senior bracket in assisted living. |
39% Residents Age 75–84 — State Benchmarked 39% of residents are 75–84, compared to the Maryland average of 31%. A high concentration in this mid-range bracket, where residents typically need moderate support with daily activities. |
42% Residents Age 85–94 — State Benchmarked 42% of residents are 85–94, compared to the Maryland average of 44%. This is typically the most common age bracket in assisted living — this facility is in line with the statewide norm. |
6% Residents Age 95+ — State Benchmarked 6% of residents are 95 or older, compared to the Maryland average of 16%. Most residents here have not yet reached the oldest-old bracket, suggesting a younger overall community. |
| Brightview Crofton Riverwalk | AL IL MC | Crofton | 92
Facility
92
MD AVG
43
Rank
#155 / 697 | Yes |
45
Facility
45
MD AVG
43
Rank
#475 / 985 | Studio / 1 Bed / 2 Bed | 6
Facility
6
MD AVG
21
Rank
#176 / 208 |
27% Male Residents — State Benchmarked 27% of residents are male, compared to the Maryland average of 31%. This facility caters to a majority female resident pool (73% female), consistent with the broader assisted living trend where women significantly outnumber men. |
73% Female Residents — State Benchmarked 73% of residents are female, compared to the Maryland average of 69%. Women comprise the large majority, consistent with national assisted living demographics where women live longer and enter care facilities at higher rates. |
0% White Residents — State Benchmarked 0% of residents are reported as White, compared to the Maryland average of 81%. A lower White share than the Maryland average — the community may draw a more diverse resident mix relative to other facilities in Maryland. |
0% African American Residents — State Benchmarked 0% of residents are reported as African American or Black, compared to the Maryland average of 13%. A lower African American share than is typical in Maryland; local markets still vary widely. |
100% Other Ethnicity Residents — State Benchmarked 100% of residents fall into categories other than White or African American (combined), compared to the Maryland average of 6%. This column aggregates Hispanic, Asian, multiracial, and any other labeled groups that are not classified as White or African American. Reported subgroups in this total: Other (100%). | - | - | - | - |
| Bedford Court, a CCRC | AL HOS IL MC NH RC SNF | Silver Spring (International Drive) | 76
Facility
76
MD AVG
43
Rank
#184 / 697 | Yes |
64
Facility
64
MD AVG
43
Rank
#261 / 985 | Studio / 1 Bed | 34
Facility
34
MD AVG
21
Rank
#22 / 208 |
15% Male Residents — State Benchmarked 15% of residents are male, compared to the Maryland average of 31%. This facility caters to a majority female resident pool (85% female), consistent with the broader assisted living trend where women significantly outnumber men. |
85% Female Residents — State Benchmarked 85% of residents are female, compared to the Maryland average of 69%. Women comprise the large majority, consistent with national assisted living demographics where women live longer and enter care facilities at higher rates. |
95% White Residents — State Benchmarked 95% of residents are reported as White, compared to the Maryland average of 81%. A higher White share than is typical for assisted living in Maryland in this dataset — compare with peer facilities for local context. |
3% African American Residents — State Benchmarked 3% of residents are reported as African American or Black, compared to the Maryland average of 13%. A lower African American share than is typical in Maryland; local markets still vary widely. |
2% Other Ethnicity Residents — State Benchmarked 2% of residents fall into categories other than White or African American (combined), compared to the Maryland average of 6%. This column aggregates Hispanic, Asian, multiracial, and any other labeled groups that are not classified as White or African American. Reported subgroups in this total: Asian (2%). |
2% Residents Age 65–74 — State Benchmarked 2% of residents are 65–74, compared to the Maryland average of 13%. Fewer younger seniors suggests the resident population skews older, likely requiring higher acuity care and more hands-on support. |
8% Residents Age 75–84 — State Benchmarked 8% of residents are 75–84, compared to the Maryland average of 31%. Below the state norm — the resident mix may skew either younger or older than this typical middle bracket. |
65% Residents Age 85–94 — State Benchmarked 65% of residents are 85–94, compared to the Maryland average of 44%. A high concentration of very elderly residents signals a higher-acuity facility with experience caring for advanced age-related needs. |
26% Residents Age 95+ — State Benchmarked 26% of residents are 95 or older, compared to the Maryland average of 16%. A high proportion of the oldest-old suggests strong end-of-life care experience and very-high-acuity capabilities. |
| Bedford Court | AL HOS IL MC NH RC SNF | Silver Spring (International Drive) | 76
Facility
76
MD AVG
43
Rank
#184 / 697 | Yes |
66
Facility
66
MD AVG
43
Rank
#240 / 985 | Studio / 1 Bed / 2 Bed | 34
Facility
34
MD AVG
21
Rank
#22 / 208 |
15% Male Residents — State Benchmarked 15% of residents are male, compared to the Maryland average of 31%. This facility caters to a majority female resident pool (85% female), consistent with the broader assisted living trend where women significantly outnumber men. |
85% Female Residents — State Benchmarked 85% of residents are female, compared to the Maryland average of 69%. Women comprise the large majority, consistent with national assisted living demographics where women live longer and enter care facilities at higher rates. |
95% White Residents — State Benchmarked 95% of residents are reported as White, compared to the Maryland average of 81%. A higher White share than is typical for assisted living in Maryland in this dataset — compare with peer facilities for local context. |
3% African American Residents — State Benchmarked 3% of residents are reported as African American or Black, compared to the Maryland average of 13%. A lower African American share than is typical in Maryland; local markets still vary widely. |
2% Other Ethnicity Residents — State Benchmarked 2% of residents fall into categories other than White or African American (combined), compared to the Maryland average of 6%. This column aggregates Hispanic, Asian, multiracial, and any other labeled groups that are not classified as White or African American. Reported subgroups in this total: Asian (2%). |
2% Residents Age 65–74 — State Benchmarked 2% of residents are 65–74, compared to the Maryland average of 13%. Fewer younger seniors suggests the resident population skews older, likely requiring higher acuity care and more hands-on support. |
8% Residents Age 75–84 — State Benchmarked 8% of residents are 75–84, compared to the Maryland average of 31%. Below the state norm — the resident mix may skew either younger or older than this typical middle bracket. |
65% Residents Age 85–94 — State Benchmarked 65% of residents are 85–94, compared to the Maryland average of 44%. A high concentration of very elderly residents signals a higher-acuity facility with experience caring for advanced age-related needs. |
26% Residents Age 95+ — State Benchmarked 26% of residents are 95 or older, compared to the Maryland average of 16%. A high proportion of the oldest-old suggests strong end-of-life care experience and very-high-acuity capabilities. |
| Parry Home Assisted Living | AL | Silver Spring | 7
Facility
7
MD AVG
43
Rank
#393 / 697 | No |
24
Facility
24
MD AVG
43
Rank
#693 / 985 | Private Rooms | - | - | - | - | - | - | - | - | - | - |
Financial Assistance for
Assisted Living in Maryland
Parry Home Assisted Living is located in Silver Spring, Maryland.
Here are the financial assistance programs available to residents in Maryland.
Frequently Asked Questions about Parry Home Assisted Living
Is Parry Home Assisted Living in a walkable area?
Parry Home Assisted Living has a walk score of 24. Car-dependent. Most errands require a car, with limited nearby walkable options.
How many beds does Parry Home Assisted Living have?
Parry Home Assisted Living has 7 beds.
Are there photos of Parry Home Assisted Living?
Yes — there are 29 photos of Parry Home Assisted Living in the photo gallery on this page.
What is the address of Parry Home Assisted Living?
Parry Home Assisted Living is located at 515 Apple Grove Rd, Silver Spring, MD 20904.
What is the phone number of Parry Home Assisted Living?
(301) 592-8681 will put you in contact with the team at Parry Home Assisted Living.
What county is Parry Home Assisted Living located in?
Parry Home Assisted Living is in Baltimore City County.
Guides for Better Senior Living
Care Cost Calculator: See Prices in Your Area
Assisted Living Explorer
Don’t Wait Too Long: 7 Red Flag Signs Your Parent Needs Assisted Living Now
The True Cost of Assisted Living in 2025 – And How Families Are Paying For It
Understanding Senior Living Costs: Pricing Models, Discounts & Financial Assistance
Updated on
