Colonel Glenn Health and Rehab, LLC
Nursing Home & Respite Care · Little Rock, AR
CMS overall rating Info CMS (the Centers for Medicare & Medicaid Services) is the federal agency that rates nursing home quality. Its Overall Rating runs from 1 to 5 stars, combining health inspections, staffing, and quality measures, with inspections weighted most heavily.

Colonel Glenn Health and Rehab, LLC

Nursing Home & Respite Care · Little Rock, AR
CMS overall rating Info CMS (the Centers for Medicare & Medicaid Services) is the federal agency that rates nursing home quality. Its Overall Rating runs from 1 to 5 stars, combining health inspections, staffing, and quality measures, with inspections weighted most heavily.
Calculator: See prices in your area
Colonel Glenn Health and Rehab, LLC accepts Medicaid, Medicare, and private pay.

Overview of Colonel Glenn Health and Rehab, LLC

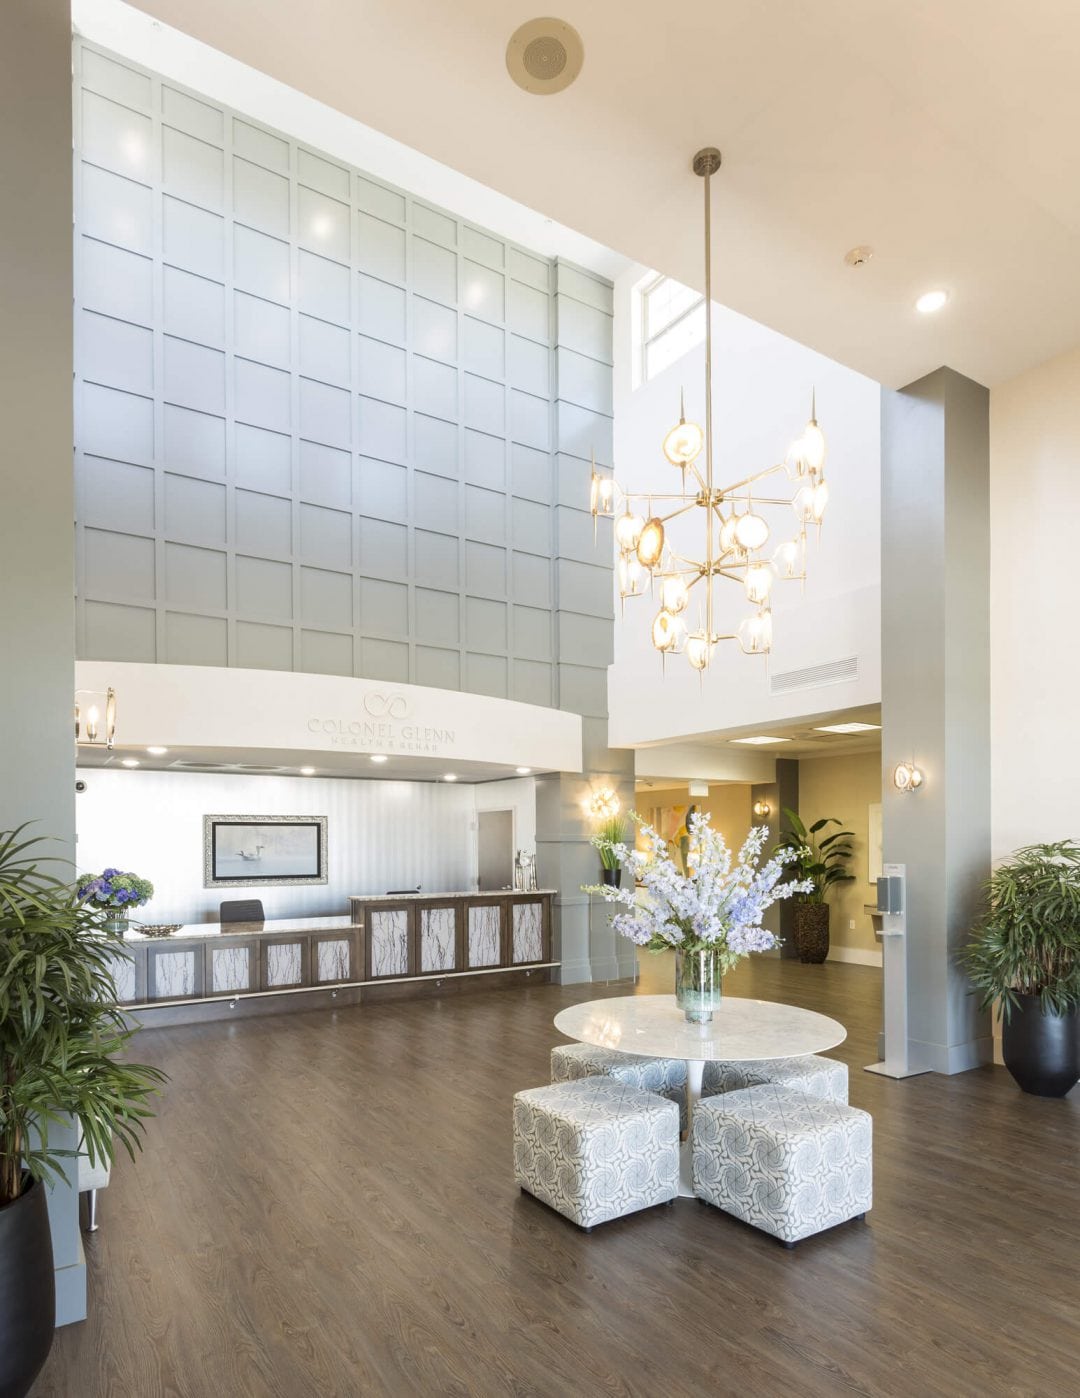
Sheri McGraw owns and Shari McGraw administers Colonel Glenn Health and Rehab, LLC, a 120-bed skilled nursing community located on David O. Dodd Road in Little Rock, Arkansas. Right now, the building fills about 90 percent of its beds, meaning it stays mostly full but leaves occasional spots open for new admissions. Residents typically remain at the facility for about 190 days on average, a timeframe showing the floor staff manages a steady blend of short-term rehabilitation therapies and extended long-term nursing stays.

A 24-hour medical team drives the everyday care schedule, providing an average of 4 hours and 48 minutes of direct, hands-on attention per resident each day. Registered nurses, practical nurses, and aides use this shift time to run basic clinical treatments, physical rehabilitation programs, and temporary respite care for visiting families. If you plan to drop by, keep in mind that this suburban neighborhood is entirely car-dependent, so visitors and families will need a vehicle for any errands outside the property.

State health surveys have previously flagged compliance issues here concerning basic infection control protocols, fall prevention practices, medication notification processes, and catheter care routines. Looking over these past regulatory survey records with the administrative team will help you see exactly how the current staff tracks daily quality control and implements medical safety corrections.

Prospective residents can call the intake department to check on current room vacancies, ask about standard application timelines, or set up payment plans using traditional Medicare, state Medicaid, and private funds. The office staff can also walk you through available daily setups, including wireless internet access, television hookups, housekeeping services, and a beauty salon.

Quality ratings

Measured by Centers for Medicare & Medicaid Services (CMS)

Overall rating Info The Overall CMS Rating combines results from health inspections, staffing levels and quality measures. Health inspections carry the most weight. Staffing and quality scores can increase or decrease the final rating based on performance compared to state and national standards.
▼ 36.3% Below AR avg. ▼ 36.3% Below AR avg.AR average: 3.1Click the badge to see the full State ranking.Click here to see the full State ranking.
Health Inspection Info Based on the results of the facility's three most recent standard inspections and any complaint investigations. CMS reviews the number, scope, and severity of deficiencies, with more recent findings weighted more heavily.
▼ 65.4% Below AR avg. ▼ 65.4% Below AR avg.AR average: 2.9Click the badge to see the full State ranking.Click here to see the full State ranking.
Staffing Info Measures average nursing staff hours per resident per day, including Registered Nurses (RNs) and total nursing staff. Ratings are adjusted based on the level of care residents require and are compared to state and national benchmarks.
▼ 5.8% Below AR avg. ▼ 5.8% Below AR avg.AR average: 3.2Click the badge to see the full State ranking.Click here to see the full State ranking.
Quality Measures Info Based on clinical and physical health indicators reported to CMS, such as hospital readmissions, falls, pressure ulcers, and improvements in mobility. These measures reflect how well residents' health needs are being managed.
▲ 36.6% Above AR avg. ▲ 36.6% Above AR avg.AR average: 3.7Click the badge to see the full State ranking.Click here to see the full State ranking.

Staffing hours breakdown

Info Daily nursing hours per resident by staff type, reported to CMS. Higher is generally better — compare this facility to state and national averages to see where staffing stands.

Hours per resident per day — compared to Arkansas state averages

Total nursing care / resident Info Total adjusted nursing hours per resident per day, combining RN, LPN, and aide time. CMS adjusts this for case-mix so facilities can be fairly compared.
4h 48m per day
This facility Arkansas avg (4h 40m per day)
vs Arkansas avg
+3%

3 of 6 metrics below state avg

Standout metric Weekend RN is +71% above state avg
Staff typeHours / Day / Residentvs state avg
Registered Nurse (RN) Info RNs hold the highest nursing license and can assess residents, interpret test results, and direct care plans. More RN hours per day often signals stronger clinical oversight and faster response to health changes. 22m per day ▼ 7% State avg: 24m per day · National avg: 41m per day
LPN / LVN Info Licensed Practical Nurses (LPNs) or Licensed Vocational Nurses (LVNs) deliver routine hands-on care — medication administration, wound dressing, and monitoring vital signs. They work under RN supervision and make up a large share of daily bedside care. 53m per day ▼ 7% State avg: 57m per day · National avg: 52m per day
Nurse Aide Info Certified Nurse Aides (CNAs) provide the most direct day-to-day assistance: bathing, dressing, feeding, and mobility. Nurse aide hours are typically the largest staffing category and directly affect residents' quality of life. 2h 45m per day ■ Avg State avg: 2h 44m per day · National avg: 2h 21m per day
Weekend Total Nursing Info Combined nursing hours (RN + LPN + Nurse Aide) per resident per day on weekends. Staffing often drops on weekends — this figure reveals whether the facility maintains adequate coverage outside of weekday hours. 3h 41m per day ▲ 6% State avg: 3h 29m per day · National avg: 3h 26m per day
Physical Therapist Info Hours per resident per day provided by licensed Physical Therapists (PTs) or PT Assistants. PT services help residents recover mobility after injury or illness and are especially important for post-acute (short-stay) rehabilitation. 1m per day ▼ 71% State avg: 2m per day · National avg: 4m per day
Weekend RN Info Registered nurse hours specifically on weekends. Facilities sometimes reduce RN presence on Saturdays and Sundays — a low weekend RN figure compared to weekday hours can indicate reduced clinical oversight when most administrative staff are absent. 27m per day ▲ 71% State avg: 16m per day · National avg: 29m per day

Capacity and availability

Avg. Length of Stay
190 days
Bed community size
120-bed community Rank #59 / 330Bed count — State benchmarkedThis home is ranked 59th out of 330 homes in Arkansas. Shows this facility's certified or reported bed count compared to other Arkansas facilities. Larger communities may offer more amenities, programs, and on-site services for residents and families.Rankings are based only on facilities in Arkansas that report data for that category. Facilities without available data are excluded from the ranking.Click the rank badge to see the full State ranking.Click here to see the full State ranking.
A larger shared setting that may offer more common spaces and organized community services.
Walk Score
Walk Score: 0 / 100 Rank #405 / 419Walk Score — State benchmarkedThis home is ranked 405th out of 419 homes in Arkansas. Shows how walkable this facility's neighborhood is compared to the average Walk Score across Arkansas facilities. Higher scores benefit residents, families, and staff.Rankings are based only on facilities in Arkansas that report data for that category. Facilities without available data are excluded from the ranking.Click the rank badge to see the full State ranking.Click here to see the full State ranking.
Car-dependent. Most errands require a car, with limited nearby walkable options.

About this community

Occupancy

Occupancy rate
90%
Higher than the Arkansas average: 71.3%
Occupied beds
108 / 120
Average occupied beds in Arkansas homes 77 beds

License Details

Facility TypeSkilled Nursing Facility
CountyPulaski
CMS Certification Number045460

Ownership & Operating Entity

Colonel Glenn Health and Rehab, LLC is legally operated by Colonel Glenn Health and Rehab, LLC, and administered by Shari Mcgraw.

Owner NameColonel Glenn Health And Rehab, LLC
Profit StatusFor-profit

Type Of Units

Medicaid and Medicare
120 units
Total beds
120 units

Payment & Insurance

2 services
Accept Medicaid
Accept Medicare

Therapy & Rehabilitation

2 services
Rehabilitation Services
Respite Care

Staffing & Medical

1 service
24-Hour Staffing

Contact Information

Fax501-907-8205

Amenities & Lifestyle

Flat Screen Tv's
Free Wifi
Restaurant Quality Food
Nutritional Snacks
Housekeeping
Linen Service
Social & Recreational Activities
Scheduled Transportation
Specific ProgramsBarber & Beauty Services

Contact Colonel Glenn Health and Rehab, LLC

Inspection History

In Arkansas, the Department of Human Services, Office of Long Term Care is authorized to conduct unannounced inspections and issue official quality of care reports for all senior living providers.

Since 2022 · 4 years of data 61 deficiencies

Inspection Scorecard Info This scorecard compares key inspection, deficiency, and complaint metrics at this facility against the Arkansas state average. Metrics rated ≥15% worse than average are highlighted in red; those ≥15% better are highlighted in green.

Since 2022 vs. Arkansas state average
Overall vs. AR average 2 Worse Metrics worse than Arkansas average:
• Total deficiencies (190% above)
• Deficiencies per year (189% above)
0 Better No metrics in this bucket.
Latest Inspection December 4, 2025 Routine

Deficiencies Info Deficiencies are formal regulatory issues recorded during state inspections.

This FacilityAR Averagevs. AR Avg
Total deficiencies Info Formal regulatory issues recorded by inspectors across all inspection types. 6121 This facility has 190% more total deficiencies than a typical Arkansas nursing home (61 vs. AR avg 21).↑ 190% worse
Deficiencies per year Info Average deficiencies per year since 2022. 15.35.3 This facility has 189% more deficiencies per year than a typical Arkansas nursing home (15.3 vs. AR avg 5.3).↑ 189% worse

Inspection Reports Summary Info An editor-reviewed summary of the themes and findings across this facility's recent inspection reports.

  • December 4, 2025 inspection found failure to prevent scabies spread among multiple residents due to delayed isolation, treatment, and inconsistent infection control practices.
  • April 24, 2025 inspection cited six deficiencies including untimely MDS transmissions, inadequate fall prevention, improper catheter care, and multiple food safety violations.
  • October 18, 2023 complaint was substantiated for failure to notify a resident’s family about medication changes and to allow grievances regarding the issue.

Health Inspection History

Inspections since 2022
Total health inspections 5

Arkansas average 4.2


Last Health inspection on Apr 2025

Total health citations
30

Arkansas average 21.8

Citations per inspection
6

Arkansas average 5.32


Health citations are formal notices following inspections when they fail to comply with safety and care standards.

25 of 30 citations resulted from standard inspections; 4 of 30 resulted from complaint investigations; and 1 of 30 came from combined inspections (standard and complaint).

Breakdown of citation severity (last 4 years)
Critical health citations
0
100% better than Arkansas average

Arkansas average: 0.4


Serious health citations
0
100% better than Arkansas average

Arkansas average: 0.2

0 critical citations Arkansas average: 0.4

0 serious citations Arkansas average: 0.2

30 moderate citations Arkansas average: 20.9

0 minor citations Arkansas average: 0.4
Citations history (last 4 years)
Nutrition moderate citation Apr 24, 2025
Corrected

Nutrition moderate citation Apr 24, 2025
Corrected

Quality of Care moderate citation Apr 24, 2025
Corrected

Quality of Care moderate citation Apr 24, 2025
Corrected

Staffing Data

Reporting period: October 1 – December 31, 2025 (Q4 2025). Source: CMS Payroll-Based Journal report.

Total staff 191
Employees 160
Contractors 31
Staff to resident ratio 1.84 : 1
16% more staff per resident than Arkansas average
Arkansas average ratio: 1.59 : 1 Arkansas average ratio: 1.59 : 1See full Arkansas ranking
Avg staff/day 68
Average shift 8.1 hours
0% compared with Arkansas average
Arkansas average: 8 hours Arkansas average shift: 8 hoursSee full Arkansas ranking
Total staff hours (quarter) 50,831

Nursing staff breakdown

Q4 2025 · Oct 1 – Dec 31 More info This data comes from the CMS Payroll-Based Journal report covering October 1 – December 31, 2025.
Registered Nurse

Manages medical care and health needs.

RN Staff Info All 6 RN Staff are full-time employees. No contractors work on this role. 6
Average shift length Info Average shift length. Calculated as total hours divided by days worked and average staff per day. 11.4 hours
Licensed Practical Nurse

Assists with medical care and medications.

LPN Staff Info All 28 LPN Staff are full-time employees. No contractors work on this role. 28
Average shift length Info Average shift length. Calculated as total hours divided by days worked and average staff per day. 8.8 hours
Certified Nursing Assistant

Helps with daily care and mobility.

CNA Staff Info All 105 CNA Staff are full-time employees. No contractors work on this role. 105
Average shift length Info Average shift length. Calculated as total hours divided by days worked and average staff per day. 8 hours

Contractor staffing

Q4 2025 · Oct 1 – Dec 31 More info This data comes from the CMS Payroll-Based Journal report covering October 1 – December 31, 2025.

Total hours from contractors

4.3%

2,167 contractor hours this quarter

Physical Therapy Assistant: 8 Respiratory Therapy Technician: 6 Physical Therapy Aide: 6 Speech Language Pathologist: 4 Qualified Social Worker: 3 Clinical Nurse Specialist: 1 Occupational Therapy Aide: 1 Medical Director: 1 Occupational Therapy Assistant: 1

Staff by category

Q4 2025 · Oct 1 – Dec 31 More info This data comes from the CMS Payroll-Based Journal report covering October 1 – December 31, 2025.
Certified Nursing Assistant105010529,61292100%8
Licensed Practical Nurse280288,60992100%8.8
Registered Nurse6062,25392100%11.4
Medication Aide/Technician8082,22492100%9.2
RN Director of Nursing3031,6197076%8.7
Clinical Nurse Specialist3141,5259098%9.1
Occupational Therapy Aide2137006470%8.2
Dietitian1016017986%7.6
Dental Services Staff1015656975%8.2
Nurse Practitioner1015286672%8
Physical Therapy Aide0665047177%5.7
Other Dietary Services Staff1014716571%7.2
Administrator1014645863%8
Speech Language Pathologist0444306368%5.1
Qualified Social Worker0333916267%6
Physical Therapy Assistant0881935257%3.3
Respiratory Therapy Technician0661114246%2.5
Occupational Therapy Assistant0112333%7.5
Medical Director0111233%4
105 Certified Nursing Assistant
% of Days 100%
28 Licensed Practical Nurse
% of Days 100%
6 Registered Nurse
% of Days 100%
8 Medication Aide/Technician
% of Days 100%
3 RN Director of Nursing
% of Days 76%
4 Clinical Nurse Specialist
% of Days 98%
3 Occupational Therapy Aide
% of Days 70%
1 Dietitian
% of Days 86%
1 Dental Services Staff
% of Days 75%
1 Nurse Practitioner
% of Days 72%
6 Physical Therapy Aide
% of Days 77%
1 Other Dietary Services Staff
% of Days 71%
1 Administrator
% of Days 63%
4 Speech Language Pathologist
% of Days 68%
3 Qualified Social Worker
% of Days 67%
8 Physical Therapy Assistant
% of Days 57%
6 Respiratory Therapy Technician
% of Days 46%
1 Occupational Therapy Assistant
% of Days 3%
1 Medical Director
% of Days 3%

Penalties and fines

Federal penalties imposed by CMS for regulatory violations, including civil money penalties (fines) and denials of payment for new Medicare/Medicaid admissions.

Source: CMS Penalties Database

No penalties in the past 3 years

No civil money penalties or payment denials were reported in the last 3 years.

Quality of care over time

These measures show how residents usually do over time at this home, based on health outcomes and preventive care.

High-risk clinical events score Info A composite score based on pressure ulcers, falls with injury, weight loss, walking ability decline, and activities of daily living decline. 3.1
60% better than Arkansas average

Arkansas average: 7.7

Functional decline score Info A composite score based on activities of daily living decline, walking ability decline, and incontinence. 3.6
73% better than Arkansas average

Arkansas average: 13.3

Long-stay resident measures
Significantly above average Arkansas avg: 4.2 Info CMS star rating based on long-stay quality measure performance. 5 stars = significantly above average, 1 star = significantly below average.
Need for Help with Daily Activities Increased Info Percent of long-stay residents whose need for help with daily activities has increased 4.1%
64% better than Arkansas average

Arkansas average: 11.5%

Walking Ability Worsened Info Percent of long-stay residents whose ability to move independently worsened 4.3%
67% better than Arkansas average

Arkansas average: 13.4%

Low Risk Residents with Bowel/Bladder Incontinence Info Percent of low risk long-stay residents who lose control of their bowels or bladder 2.3%
85% better than Arkansas average

Arkansas average: 15.1%

Falls with Major Injury Info Percent of long-stay residents experiencing one or more falls with major injury 1.7%
58% better than Arkansas average

Arkansas average: 3.9%

High Risk Residents with Pressure Ulcers Info Percent of long-stay high risk residents with pressure ulcers 5.2%
10% worse than Arkansas average

Arkansas average: 4.7%

Urinary Tract Infection Info Percent of long-stay residents with a urinary tract infection 0.3%
78% better than Arkansas average

Arkansas average: 1.3%

Lost Too Much Weight Info Percent of long-stay residents who lose too much weight 0.0%
100% better than Arkansas average

Arkansas average: 5.0%

Depressive Symptoms Info Percent of long-stay residents who have depressive symptoms 0.0%
100% better than Arkansas average

Arkansas average: 1.5%

Antipsychotic Use Info Percent of long-stay residents who received an antipsychotic medication 5.8%
45% better than Arkansas average

Arkansas average: 10.5%

Pneumococcal Vaccine Info Percent of long-stay residents assessed and appropriately given the pneumococcal vaccine 100.0%
6% better than Arkansas average

Arkansas average: 94.4%

Influenza Vaccine Info Percent of long-stay residents assessed and appropriately given the seasonal influenza vaccine 98.0%
In line with Arkansas average

Arkansas average: 96.2%

Hospitalizations per 1,000 days Info Number of hospitalizations per 1,000 long-stay resident days. 1.74
12% better than Arkansas average

Arkansas average: 1.97

ED visits per 1,000 days Info Number of outpatient emergency department visits per 1,000 long-stay resident days. 2.13
In line with Arkansas average

Arkansas average: 2.18

Short-stay resident measures
Average Arkansas avg: 2.7 Info CMS star rating based on short-stay quality measure performance. 5 stars = much above average, 1 star = much below average.
Pneumococcal Vaccine Info Percent of short-stay residents assessed and appropriately given the pneumococcal vaccine 100.0%
24% better than Arkansas average

Arkansas average: 80.9%

Antipsychotic medication increase Info Percent of short-stay residents who newly received an antipsychotic medication 0.9%
39% better than Arkansas average

Arkansas average: 1.5%

Influenza Vaccine Info Percent of short-stay residents assessed and appropriately given the seasonal influenza vaccine 11.3%
86% worse than Arkansas average

Arkansas average: 77.7%

Re-hospitalized after SNF stay Info Percentage of short-stay residents who were re-hospitalized after their nursing home admission. 25.9%
In line with Arkansas average

Arkansas average: 25.2%

Emergency department visits Info Percentage of short-stay residents who had an outpatient emergency department visit. 8.2%
41% better than Arkansas average

Arkansas average: 13.8%

Falls with major injury Info Percentage of SNF residents who experience falls with major injury during their stay. 0.0%
100% better than Arkansas average

Arkansas average: 0.8%

Ability to care for self at discharge Info Percentage of residents at or above expected ability to care for themselves at discharge. 44.4%
17% worse than Arkansas average

Arkansas average: 53.7%

Successful return to home or community Info Rate of successful return to home or community from a skilled nursing facility. 47.4%
6% worse than Arkansas average

Arkansas average: 50.6%

Breakdown by payment type

Medicare

35% of new residents, usually for short-term rehab.

Typical stay 3 - 4 months

Private pay

52% of new residents, often for short stays.

Typical stay 3 - 4 months

Medicaid

13% of new residents, often for long-term daily care.

Typical stay 3 - 4 years

Facility Characteristics

Source: CMS Long-Term Care Facility Characteristics (Data as of Jan 2026)

Total residents 104
Medicare
8
7.7% of residents
Medicaid
87
83.7% of residents
Private pay or other
9
8.7% of residents
Programs & Services
Residents Group

Residents meet regularly to discuss policies, care quality, and activities

Active Resident Council

Organized group of residents that meets regularly to discuss facility policies, quality of life, and activities.

Finances and operations

Based on CMS SNF Cost Report for fiscal year ending in 12/2023.

For-profit
Operated by a single business entity.
Net patient revenue Info Net patient revenue — what the home actually collects for resident care, after contractual allowances, bad debt and discounts are subtracted from its gross charges (CMS cost report, Worksheet G-3). It covers resident care only; money the home earns from other sources is shown separately as "Other income."
$14.7M
Net patient income Info Net patient income: net patient revenue minus the home's total operating expenses. A positive figure means it earns more from resident care than it spends to deliver it; a negative figure means the opposite. It excludes non-operating "other income."
$1.2M
For-profit Operated by a single business entity.
Net patient revenue Info Net patient revenue — what the home actually collects for resident care, after contractual allowances, bad debt and discounts are subtracted from its gross charges (CMS cost report, Worksheet G-3). It covers resident care only; money the home earns from other sources is shown separately as "Other income."
$14.7M
Net patient income Info Net patient income: net patient revenue minus the home's total operating expenses. A positive figure means it earns more from resident care than it spends to deliver it; a negative figure means the opposite. It excludes non-operating "other income."
$1.2M
Other income Info Money the home earns outside of resident care — such as investments, grants, rentals and other non-operating sources (CMS cost report, Worksheet G-3). It is tracked separately from net patient revenue: it is not part of that figure, and it is not included in net patient income.
-$10.8K
Payroll costs Info Staff salaries plus wage-related costs — benefits such as payroll taxes, health insurance and retirement — from the home's own accounting records (CMS cost report, Worksheet A). Contract or agency labor is counted separately, under other operating costs.
$6.3M 42.9% of net patient revenue Info Payroll as a share of revenue: staff salaries and wage-related benefits divided by net patient revenue. A higher figure means more of each revenue dollar goes to staff pay.
Other operating costs Info Everything it costs to run the home apart from payroll — food, utilities, supplies, maintenance, contract labor and administration. Calculated as total operating expense minus payroll (staff salaries and wage-related benefits).
$7.2M
Total costs Info The home's total operating expense for the year — all the costs of running it, salaries included (CMS cost report, Worksheet G-3).
$13.5M

Who this home usually serves

TYPE OF STAY

Mix of rehab and long-term care

This home supports both short-term rehab and long-term care, with residents staying for a wide range of durations.

Most new residents arrive under private pay (52% of admissions), and a typical private pay stay runs around 3 - 4 months.

Admissions
151 total

Coverage residents most often arrive under.

Medicare 35%
Private pay 52%
Medicaid 13%
Discharges
209 total

Coverage residents most often leave under.

Medicare 41%
Private pay 47%
Medicaid 12%

Places of interest near Colonel Glenn Health and Rehab, LLC

Address 13700 David O. Dodd Road, Little Rock, AR 72210

Calculate Travel Distance to Colonel Glenn Health and Rehab, LLC

Add your location

Address

Compare Nursing Homes around Little Rock

The information below is reported by the Arkansas Department of Human Services, Office of Long Term Care.

5 facilities compared · CMS & AR Dept. of Health data

The Springs of Chenal
NH
HC
MC
PC
Little Rock (John Barrow)
70
Facility 70
AR AVG 84
Rank #206 / 330
57.1% -20%4.37 +28%-7%$0163.2-48A+
10
Facility 10
AR AVG 34
Rank #342 / 419
Samuel Vallery$5.6M$3.1M55.8%45288
The Green House Cottages of Poplar Grove
NH
HC
MC
RC
Little Rock (Leander)
120
Facility 120
AR AVG 84
Rank #59 / 330
89.2% +25%6.16 -32%+32%$0343.4-111A+
31
Facility 31
AR AVG 34
Rank #229 / 419
Marybret, LLC$15.4M$7.4M48%45466
Hickory Heights Health & Rehab
NH
NC
RC
Little Rock
120
Facility 120
AR AVG 84
Rank #59 / 330
99.2% +39%4.78 +47%+2%$0235.8-107-
10
Facility 10
AR AVG 34
Rank #342 / 419
Renee Phillips$14.2M$6.6M46.8%45455
The Blossoms at Midtown Rehab & Nursing Center
NH
HC
MC
PC
RC
Little Rock (Hillcrest)
154
Facility 154
AR AVG 84
Rank #7 / 330
52.6% -26%3.93 +72%-16%$0264.3-82A-
63
Facility 63
AR AVG 34
Rank #35 / 419
West Markham Street Operating LLC$12.3M$5.0M41.1%45450
Colonel Glenn Health and Rehab, LLC
NH
RC
Little Rock
120
Facility 120
AR AVG 84
Rank #59 / 330
90.4% +27%4.79 -43%+3%$78.0k306.0-126-
0
Facility 0
AR AVG 34
Rank #405 / 419
Sheri Mcgraw$14.7M$6.3M42.9%45460

Financial Assistance for
Nursing Home in Arkansas

Colonel Glenn Health and Rehab, LLC is located in Little Rock, Arkansas.
Here are the financial assistance programs available to residents in Arkansas.

Get Financial aid guidance

ARChoices

Arkansas Medicaid ARChoices

Age 65+ or 21+ with disability
General Arkansas resident, Medicaid- eligible, nursing home-level care need.
Income Limits (2025) ~$2,829/month 300% FBR, individual
Asset Limits $2,000 (individual), $3,000 (couple).
AR

Rural focus; possible waitlists.

Benefits
Personal care (5-7 hours/day) Meals ($7/meal) Respite care (240 hours/year) Adult day services ($60/day)

Choices in Living Resource Center

Arkansas Choices in Living

Age 60+
General Arkansas resident.
Income Limits No strict limit; prioritizes low-income.
Asset Limits Not applicable.
AR

Limited direct funding; mostly referral-based.

Benefits
Care coordination Limited respite (up to 5 days/year) Transportation assistance (~5 trips/month)

Living Choices Assisted Living Waiver

Arkansas Medicaid Living Choices Assisted Living Waiver

Age 65+
General Arkansas resident, requires nursing home-level care, lives in a Level II assisted living facility.
Income Limits (2025) ~$2,829/month 300% FBR, individual
Asset Limits $2,000 (individual), $3,000 (couple); spousal rules apply.
AR

Limited provider network; excludes Level I facilities (no nursing services).

Benefits
Personal care (~5 hours/day) Medication management Nursing Activities Transportation

Program of All-Inclusive Care for the Elderly (PACE)

Arkansas Medicaid PACE

Age 55+
General Arkansas resident, nursing home-level care, safe with PACE support.
Income Limits (2025) ~$2,829/month 300% FBR
Asset Limits $2,000 (individual), $3,000 (couple).
AR

Limited geographic availability.

Benefits
Primary/preventive care Personal care (5-7 hours/day) Meals Transportation Therapy

Arkansas State Plan Personal Care

Arkansas Medicaid Personal Care Program

Age
General Any age, Arkansas resident, needs ADL/IADL help, Medicaid-eligible.
Income Limits (2025) ~$1,004/month individual
Asset Limits $9,660 (individual), $14,470 (couple).
AR

No nursing home-level care requirement.

Benefits
Personal care (~4-6 hours/day) Homemaker services (e.g., meal prep)

Frequently Asked Questions about Colonel Glenn Health and Rehab, LLC

What is the occupancy rate at Colonel Glenn Health and Rehab, LLC?

Colonel Glenn Health and Rehab, LLC's occupancy is 90%.

Does Colonel Glenn Health and Rehab, LLC operate as a for-profit or non-profit?

Colonel Glenn Health and Rehab, LLC is registered as a for-profit in AR.

Who is the administrator of Colonel Glenn Health and Rehab, LLC?

Shari McGraw is the administrator of Colonel Glenn Health and Rehab, LLC.

How many beds does Colonel Glenn Health and Rehab, LLC have?

Colonel Glenn Health and Rehab, LLC has 120 beds.

Are there photos of Colonel Glenn Health and Rehab, LLC?

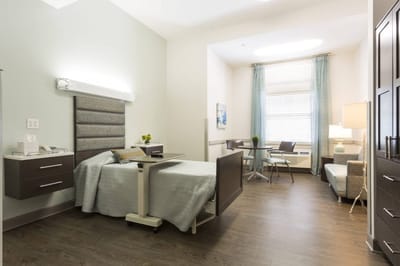
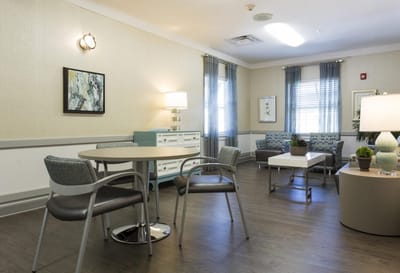
Yes — there are 3 photos of Colonel Glenn Health and Rehab, LLC in the photo gallery on this page.

What is the address of Colonel Glenn Health and Rehab, LLC?

Colonel Glenn Health and Rehab, LLC is located at 13700 David O. Dodd Road, Little Rock, AR 72210.

What is the phone number of Colonel Glenn Health and Rehab, LLC?

(501) 907-8200 will put you in contact with the team at Colonel Glenn Health and Rehab, LLC.

Guides for Better Senior Living

Care Cost Calculator: See Prices in Your Area

Nursing Home Data Explorer

Don’t Wait Too Long: 7 Red Flag Signs Your Parent Needs Assisted Living Now

The True Cost of Assisted Living in 2025 – And How Families Are Paying For It

Understanding Senior Living Costs: Pricing Models, Discounts & Financial Assistance