Good Shepherd Nursing and Rehabilitation Center
Nursing Home · Little Rock, AR
CMS overall rating Info The Overall CMS Rating is scored from 1 to 5 stars and combines results from health inspections, staffing levels, and quality measures. Health inspections carry the most weight. Staffing and quality scores can increase or decrease the final rating based on performance compared to state and national standards.

Good Shepherd Nursing and Rehabilitation Center

Nursing Home · Little Rock, AR
CMS overall rating Info The Overall CMS Rating is scored from 1 to 5 stars and combines results from health inspections, staffing levels, and quality measures. Health inspections carry the most weight. Staffing and quality scores can increase or decrease the final rating based on performance compared to state and national standards.
Calculator: See prices in your area
Good Shepherd Nursing and Rehabilitation Center accepts Medicare, Medicaid, and private pay.

Overview of Good Shepherd Nursing and Rehabilitation Center

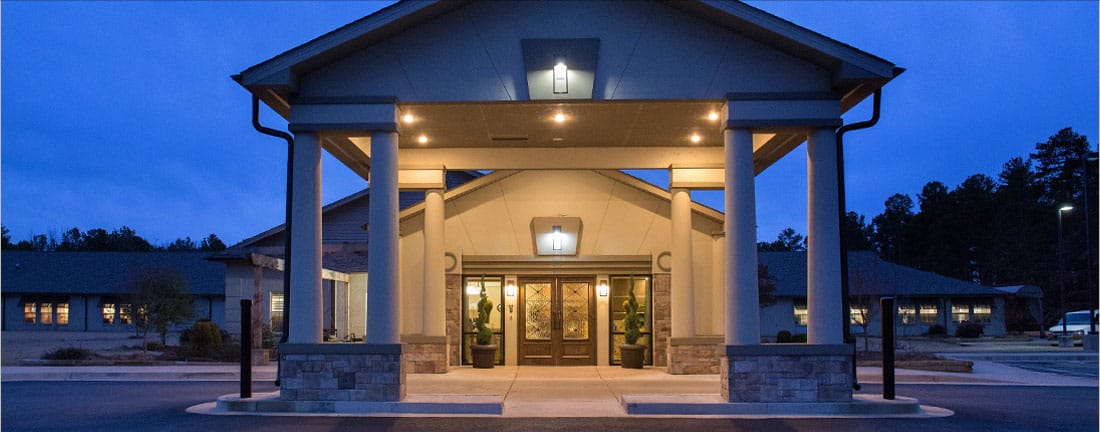
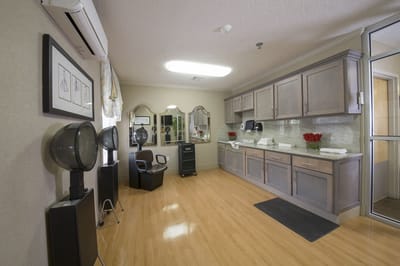
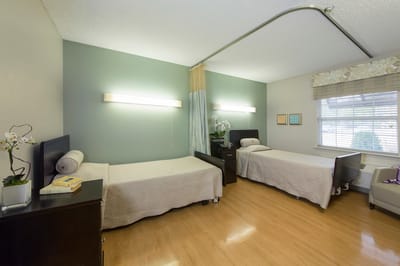
Good Shepherd Nursing and Rehabilitation Center has truly mastered the art of creating a pleasant and carefree living experience for its cherished residents. They offer a range of specialized services, including long-term care, respite care, and short-term rehabilitation, ensuring that each resident receives the individualized attention they deserve. Their state-of-the-art rehabilitation gym is equipped with the latest advancements, ensuring that residents receive the best possible therapy to regain their strength and independence. And with physician services available round the clock, you can have peace of mind knowing that expert medical attention is always just a stone’s throw away.
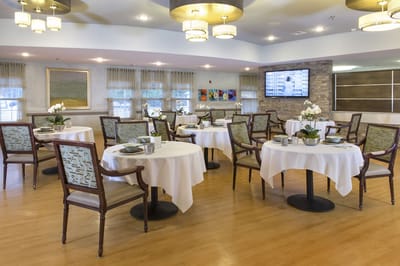
The entire facility is wheelchair accessible, making it a breeze to navigate for residents with mobility challenges. They offer an array of social services, daily activities, and engaging events that cater to residents’ interests and passions. Whether it’s art classes, music therapy, or lively social gatherings, there’s always something exciting happening to keep spirits high. Good Shepherd also takes great pride in offering a dining experience that’s nothing short of extraordinary. From delectable gourmet creations to comforting home-style favorites, every meal is a feast for the senses.

(501) 217-9774

Quality ratings

Measured by Centers for Medicare & Medicaid Services (CMS)

Overall rating Info The Overall CMS Rating combines results from health inspections, staffing levels and quality measures. Health inspections carry the most weight. Staffing and quality scores can increase or decrease the final rating based on performance compared to state and national standards.
▼ 36.3% Below AR avg. ▼ 36.3% Below AR avg.Click the badge to see the full State ranking.Click here to see the full State ranking.
Health Inspection Info Based on the results of the facility's three most recent standard inspections and any complaint investigations. CMS reviews the number, scope, and severity of deficiencies, with more recent findings weighted more heavily.
▼ 65.4% Below AR avg. ▼ 65.4% Below AR avg.Click the badge to see the full State ranking.Click here to see the full State ranking.
Staffing Info Measures average nursing staff hours per resident per day, including Registered Nurses (RNs) and total nursing staff. Ratings are adjusted based on the level of care residents require and are compared to state and national benchmarks.
▼ 37.2% Below AR avg. ▼ 37.2% Below AR avg.Click the badge to see the full State ranking.Click here to see the full State ranking.
Quality Measures Info Based on clinical and physical health indicators reported to CMS, such as hospital readmissions, falls, pressure ulcers, and improvements in mobility. These measures reflect how well residents' health needs are being managed.
▲ 36.6% Above AR avg. ▲ 36.6% Above AR avg.Click the badge to see the full State ranking.Click here to see the full State ranking.

Staffing hours breakdown

Info Daily nursing hours per resident by staff type, reported to CMS. Higher is generally better — compare this facility to state and national averages to see where staffing stands.

Hours per resident per day — compared to Arkansas state averages

Total nursing care / resident Info This home is ranked 158th out of 182 homes in Arkansas. Total adjusted nursing hours per resident per day, combining RN, LPN, and aide time. CMS adjusts this for case-mix so facilities can be fairly compared.
3h 59m per day
Rank #158 / 182Nurse hours — State benchmarkedThis home is ranked 158th out of 182 homes in Arkansas. Shows adjusted nurse hours per resident per day benchmarked to the Arkansas average, with a ranking across 182 Arkansas SNFs. More hours mean more direct care. The national average is about 3.5 hrs; below 3.0 is a red flag.Click the rank badge to see the full State ranking.Click here to see the full State ranking.
This facility Arkansas avg (4h 40m per day)
vs Arkansas avg
-15%

3 of 5 metrics below state avg

Standout metric LPN / LVN is +26% above state avg
Staff typeHours / Day / Residentvs state avg
Registered Nurse (RN) Info RNs hold the highest nursing license and can assess residents, interpret test results, and direct care plans. More RN hours per day often signals stronger clinical oversight and faster response to health changes. 14m per day ▼ 42% State avg: 24m per day · National avg: 41m per day
LPN / LVN Info Licensed Practical Nurses (LPNs) or Licensed Vocational Nurses (LVNs) deliver routine hands-on care — medication administration, wound dressing, and monitoring vital signs. They work under RN supervision and make up a large share of daily bedside care. 1h 12m per day ▲ 26% State avg: 57m per day · National avg: 52m per day
Nurse Aide Info Certified Nurse Aides (CNAs) provide the most direct day-to-day assistance: bathing, dressing, feeding, and mobility. Nurse aide hours are typically the largest staffing category and directly affect residents' quality of life. 2h 26m per day ▼ 11% State avg: 2h 44m per day · National avg: 2h 21m per day
Weekend Total Nursing Info Combined nursing hours (RN + LPN + Nurse Aide) per resident per day on weekends. Staffing often drops on weekends — this figure reveals whether the facility maintains adequate coverage outside of weekday hours. 3h 10m per day ▼ 9% State avg: 3h 29m per day · National avg: 3h 26m per day
Weekend RN Info Registered nurse hours specifically on weekends. Facilities sometimes reduce RN presence on Saturdays and Sundays — a low weekend RN figure compared to weekday hours can indicate reduced clinical oversight when most administrative staff are absent. 16m per day ■ Avg State avg: 16m per day · National avg: 29m per day

Types of Care at Good Shepherd Nursing and Rehabilitation Center

Nursing Home

Capacity and availability

This home usually has limited availability

Occupancy between 85% and 95% suggests balanced demand.

Higher occupancy than the Arkansas average: 71.3%
Occupancy rate 89.8% Rank #18 / 183Occupancy rate — State benchmarkedThis home is ranked 18th out of 183 homes in Arkansas. Shows this facility's occupancy rate versus the Arkansas average, with its Statewide rank out of 183. Higher occupancy signals strong local demand and financial stability.Click the rank badge to see the full State ranking.Click here to see the full State ranking.
Avg. Length of Stay 121 days
Occupancy rate
89.8% Rank #18 / 183Occupancy rate — State benchmarkedThis home is ranked 18th out of 183 homes in Arkansas. Shows this facility's occupancy rate versus the Arkansas average, with its Statewide rank out of 183. Higher occupancy signals strong local demand and financial stability.Click the rank badge to see the full State ranking.Click here to see the full State ranking.
Avg. Length of Stay
121 days
Walk Score
Walk Score: 1 / 100 Rank #397 / 419Walk Score — State benchmarkedThis home is ranked 397th out of 419 homes in Arkansas. Shows how walkable this facility's neighborhood is compared to the average Walk Score across Arkansas SNFs. Higher scores benefit residents, families, and staff.Click the rank badge to see the full State ranking.Click here to see the full State ranking.
Car-dependent. Most errands require a car, with limited nearby walkable options.

Contact Good Shepherd Nursing and Rehabilitation Center

Staffing Data

Reporting period: October 1 – December 31, 2025 (Q4 2025). Source: CMS Payroll-Based Journal report.

Total staff 139
Employees 116
Contractors 23
Staff to resident ratio 1.39:1
12% worse than Arkansas average
Arkansas average ratio: 1.59:1 Arkansas average ratio: 1.59:1See full Arkansas ranking
Avg staff/day 50
Average shift 7.5 hours
6% worse than Arkansas average
Arkansas average: 8 hours Arkansas average shift: 8 hoursSee full Arkansas ranking
Total staff hours (quarter) 34,610

Nursing staff breakdown

Q4 2025 · Oct 1 – Dec 31 More info This data comes from the CMS Payroll-Based Journal report covering October 1 – December 31, 2025.
Registered Nurse

Manages medical care and health needs.

RN Staff 3
Average shift length Info Average shift length. Calculated as total hours divided by days worked and average staff per day. 11.2 hours

No contractors work on this role.

Licensed Practical Nurse

Assists with medical care and medications.

LPN Staff 25
Average shift length Info Average shift length. Calculated as total hours divided by days worked and average staff per day. 8 hours

No contractors work on this role.

Certified Nursing Assistant

Helps with daily care and mobility.

CNA Staff 70
Average shift length Info Average shift length. Calculated as total hours divided by days worked and average staff per day. 7.4 hours

No contractors work on this role.

Contractor staffing

Q4 2025 · Oct 1 – Dec 31 More info This data comes from the CMS Payroll-Based Journal report covering October 1 – December 31, 2025.

Total hours from contractors

5.3%

1,827 contractor hours this quarter

Respiratory Therapy Technician: 6 Physical Therapy Assistant: 6 Speech Language Pathologist: 3 Physical Therapy Aide: 3 Clinical Nurse Specialist: 1 Occupational Therapy Aide: 1 Qualified Social Worker: 1 Medical Director: 1 Occupational Therapy Assistant: 1

Staff by category

Q4 2025 · Oct 1 – Dec 31 More info This data comes from the CMS Payroll-Based Journal report covering October 1 – December 31, 2025.
Certified Nursing Assistant7007018,54992100%7.4
Licensed Practical Nurse250258,69692100%8
RN Director of Nursing3031,2796571%7.6
Clinical Nurse Specialist4158238693%8
Medication Aide/Technician2025726672%8
Occupational Therapy Aide1125416166%8.2
Administrator1015206571%8
Nurse Practitioner1015206571%8
Dental Services Staff1014936571%7.6
Physical Therapy Aide0334716571%7.2
Dietitian1014706368%7.5
Registered Nurse3034483841%11.2
Nurse Aide in Training4043794852%6.9
Speech Language Pathologist0333536267%5.6
Qualified Social Worker0113345964%5.7
Physical Therapy Assistant066803033%2.5
Respiratory Therapy Technician066492830%1.8
Occupational Therapy Assistant0112333%7.5
Medical Director0111233%4
70 Certified Nursing Assistant
% of Days 100%
25 Licensed Practical Nurse
% of Days 100%
3 RN Director of Nursing
% of Days 71%
5 Clinical Nurse Specialist
% of Days 93%
2 Medication Aide/Technician
% of Days 72%
2 Occupational Therapy Aide
% of Days 66%
1 Administrator
% of Days 71%
1 Nurse Practitioner
% of Days 71%
1 Dental Services Staff
% of Days 71%
3 Physical Therapy Aide
% of Days 71%
1 Dietitian
% of Days 68%
3 Registered Nurse
% of Days 41%
4 Nurse Aide in Training
% of Days 52%
3 Speech Language Pathologist
% of Days 67%
1 Qualified Social Worker
% of Days 64%
6 Physical Therapy Assistant
% of Days 33%
6 Respiratory Therapy Technician
% of Days 30%
1 Occupational Therapy Assistant
% of Days 3%
1 Medical Director
% of Days 3%

Penalties and fines

Federal penalties imposed by CMS for regulatory violations, including civil money penalties (fines) and denials of payment for new Medicare/Medicaid admissions.

Source: CMS Penalties Database

No penalties in the past 3 years

No civil money penalties or payment denials were reported in the last 3 years.

Quality of care over time

These measures show how residents usually do over time at this home, based on health outcomes and preventive care.

High-risk clinical events score Info A composite score based on pressure ulcers, falls with injury, weight loss, walking ability decline, and activities of daily living decline. 4.4
43% better than Arkansas average

Arkansas average: 7.7

Functional decline score Info A composite score based on activities of daily living decline, walking ability decline, and incontinence. 6.2
54% better than Arkansas average

Arkansas average: 13.3

Long-stay resident measures
Significantly above average Arkansas avg: 4.2 Info CMS star rating based on long-stay quality measure performance. 5 stars = significantly above average, 1 star = significantly below average.
Need for Help with Daily Activities Increased Info Percent of long-stay residents whose need for help with daily activities has increased 3.7%
68% better than Arkansas average

Arkansas average: 11.5%

Walking Ability Worsened Info Percent of long-stay residents whose ability to move independently worsened 6.4%
52% better than Arkansas average

Arkansas average: 13.4%

Low Risk Residents with Bowel/Bladder Incontinence Info Percent of low risk long-stay residents who lose control of their bowels or bladder 8.4%
44% better than Arkansas average

Arkansas average: 15.1%

Falls with Major Injury Info Percent of long-stay residents experiencing one or more falls with major injury 4.6%
16% worse than Arkansas average

Arkansas average: 3.9%

High Risk Residents with Pressure Ulcers Info Percent of long-stay high risk residents with pressure ulcers 7.1%
50% worse than Arkansas average

Arkansas average: 4.7%

Urinary Tract Infection Info Percent of long-stay residents with a urinary tract infection 0.0%
100% better than Arkansas average

Arkansas average: 1.3%

Lost Too Much Weight Info Percent of long-stay residents who lose too much weight 0.0%
100% better than Arkansas average

Arkansas average: 5.0%

Depressive Symptoms Info Percent of long-stay residents who have depressive symptoms 0.0%
100% better than Arkansas average

Arkansas average: 1.5%

Antipsychotic Use Info Percent of long-stay residents who received an antipsychotic medication 2.7%
74% better than Arkansas average

Arkansas average: 10.5%

Pneumococcal Vaccine Info Percent of long-stay residents assessed and appropriately given the pneumococcal vaccine 91.5%
In line with Arkansas average

Arkansas average: 94.4%

Influenza Vaccine Info Percent of long-stay residents assessed and appropriately given the seasonal influenza vaccine 93.6%
In line with Arkansas average

Arkansas average: 96.2%

Hospitalizations per 1,000 days Info Number of hospitalizations per 1,000 long-stay resident days. 0.93
53% better than Arkansas average

Arkansas average: 1.97

ED visits per 1,000 days Info Number of outpatient emergency department visits per 1,000 long-stay resident days. 0.40
82% better than Arkansas average

Arkansas average: 2.18

Short-stay resident measures
Average Arkansas avg: 2.7 Info CMS star rating based on short-stay quality measure performance. 5 stars = much above average, 1 star = much below average.
Pneumococcal Vaccine Info Percent of short-stay residents assessed and appropriately given the pneumococcal vaccine 92.2%
14% better than Arkansas average

Arkansas average: 80.9%

Antipsychotic medication increase Info Percent of short-stay residents who newly received an antipsychotic medication 0.0%
100% better than Arkansas average

Arkansas average: 1.5%

Influenza Vaccine Info Percent of short-stay residents assessed and appropriately given the seasonal influenza vaccine 74.2%
In line with Arkansas average

Arkansas average: 77.7%

Re-hospitalized after SNF stay Info Percentage of short-stay residents who were re-hospitalized after their nursing home admission. 22.0%
13% better than Arkansas average

Arkansas average: 25.2%

Emergency department visits Info Percentage of short-stay residents who had an outpatient emergency department visit. 8.0%
42% better than Arkansas average

Arkansas average: 13.8%

Falls with major injury Info Percentage of SNF residents who experience falls with major injury during their stay. 1.4%
86% worse than Arkansas average

Arkansas average: 0.8%

Ability to care for self at discharge Info Percentage of residents at or above expected ability to care for themselves at discharge. 25.4%
53% worse than Arkansas average

Arkansas average: 53.7%

Successful return to home or community Info Rate of successful return to home or community from a skilled nursing facility. 42.2%
17% worse than Arkansas average

Arkansas average: 50.6%

Breakdown by payment type

Medicare

41% of new residents, usually for short-term rehab.

Typical stay 1 - 2 months

Private pay

54% of new residents, often for short stays.

Typical stay 2 - 3 months

Medicaid

6% of new residents, often for long-term daily care.

Typical stay 4 years

Facility Characteristics

Source: CMS Long-Term Care Facility Characteristics (Data as of Jan 2026)

Total residents 100
Medicare
9
9% of residents
Medicaid
22
22% of residents
Private pay or other
69
69% of residents
Programs & Services
Residents Group

Residents meet regularly to discuss policies, care quality, and activities

Active Resident Council

Organized group of residents that meets regularly to discuss facility policies, quality of life, and activities.

Finances and operations

Privately-owned community
Home revenue
$17.5M
Profit
$2.0M
Privately-owned community
Home revenue
$17.5M Rank #12 / 181Revenue — State benchmarkedThis home is ranked 12th out of 181 homes in Arkansas. Shows this facility's annual revenue compared to the Arkansas SNF average. Higher revenue generally means more resources for staffing and capital — read alongside Payroll %.Click the rank badge to see the full State ranking.Click here to see the full State ranking.
Profit
$2.0M
Payroll costs Info The portion of the home's budget spent on staff, including nurses, caregivers, and other employees who support care and operations. Rank #18 / 181Payroll — State benchmarkedThis home is ranked 18th out of 181 homes in Arkansas. Shows total annual staff payroll benchmarked to the Arkansas average. Higher payroll investment relative to peers often signals better staffing and less reliance on cheaper contract labor.Click the rank badge to see the full State ranking.Click here to see the full State ranking.
$6.7M
38.6% of revenue Rank #148 / 181Payroll % — State benchmarkedThis home is ranked 148th out of 181 homes in Arkansas. Shows payroll as a percentage of revenue versus the Arkansas average. Well-run Arkansas SNFs typically land around 47–60% — the top third Statewide. Below 25% may signal understaffing or heavy agency use — read with Staffing ratings.Click the rank badge to see the full State ranking.Click here to see the full State ranking.
Other operating costs Info All remaining costs needed to run the home, such as food, utilities, building maintenance, supplies and administrative expenses.
$8.8M
Total costs $15.5M

Who this home usually serves

TYPE OF STAY

Mix of rehab and long-term care

This home supports both short-term rehab and long-term care, with residents staying for a wide range of durations.

Places of interest near Good Shepherd Nursing and Rehabilitation Center

Address 7.4 miles from city center Info Estimated distance in miles from Little Rock's city center to Good Shepherd Nursing and Rehabilitation Center's address, calculated via Google Maps. — 0.95 miles to nearest hospital (Arkansas Heart Hospital)

Calculate Travel Distance to Good Shepherd Nursing and Rehabilitation Center

Add your location

Address

Financial Assistance for
Nursing Home in Arkansas

Good Shepherd Nursing and Rehabilitation Center is located in Little Rock, Arkansas.
Here are the financial assistance programs available to residents in Arkansas.

Get Financial aid guidance

ARChoices

Arkansas Medicaid ARChoices

Age 65+ or 21+ with disability
General Arkansas resident, Medicaid- eligible, nursing home-level care need.
Income Limits (2025) ~$2,829/month 300% FBR, individual
Asset Limits $2,000 (individual), $3,000 (couple).
AR

Rural focus; possible waitlists.

Benefits
Personal care (5-7 hours/day) Meals ($7/meal) Respite care (240 hours/year) Adult day services ($60/day)

Choices in Living Resource Center

Arkansas Choices in Living

Age 60+
General Arkansas resident.
Income Limits No strict limit; prioritizes low-income.
Asset Limits Not applicable.
AR

Limited direct funding; mostly referral-based.

Benefits
Care coordination Limited respite (up to 5 days/year) Transportation assistance (~5 trips/month)

Living Choices Assisted Living Waiver

Arkansas Medicaid Living Choices Assisted Living Waiver

Age 65+
General Arkansas resident, requires nursing home-level care, lives in a Level II assisted living facility.
Income Limits (2025) ~$2,829/month 300% FBR, individual
Asset Limits $2,000 (individual), $3,000 (couple); spousal rules apply.
AR

Limited provider network; excludes Level I facilities (no nursing services).

Benefits
Personal care (~5 hours/day) Medication management Nursing Activities Transportation

Program of All-Inclusive Care for the Elderly (PACE)

Arkansas Medicaid PACE

Age 55+
General Arkansas resident, nursing home-level care, safe with PACE support.
Income Limits (2025) ~$2,829/month 300% FBR
Asset Limits $2,000 (individual), $3,000 (couple).
AR

Limited geographic availability.

Benefits
Primary/preventive care Personal care (5-7 hours/day) Meals Transportation Therapy

Arkansas State Plan Personal Care

Arkansas Medicaid Personal Care Program

Age
General Any age, Arkansas resident, needs ADL/IADL help, Medicaid-eligible.
Income Limits (2025) ~$1,004/month individual
Asset Limits $9,660 (individual), $14,470 (couple).
AR

No nursing home-level care requirement.

Benefits
Personal care (~4-6 hours/day) Homemaker services (e.g., meal prep)

Compare Nursing Home around Little Rock

The information below is reported by the Arkansas Department of Human Services, Office of Long Term Care.

5 facilities compared · CMS & AR Dept. of Health data

Filter by care type
Encore at West Little Rock
NH

Nursing Home Licensed facility providing 24/7 skilled nursing care for residents with complex, ongoing medical needs. Staffed by RNs, LPNs, and CNAs. Inspected and star-rated annually by CMS. Accepts Medicare (short-term rehab) and Medicaid (long-term care).

MC

Memory Care Secured, specialized care for people living with Alzheimer's or dementia. Staff trained in cognitive impairment, with higher staff-to-resident ratios and an environment designed to reduce confusion and wandering risk.

Little Rock (Rainwood Cove)97 75.4% +6%4.26 -23%-9%$0222.4-74- 51 Courtney Nichols$8.1M$4.9M60.7%45390
The Springs of Chenal
NH

Nursing Home Licensed facility providing 24/7 skilled nursing care for residents with complex, ongoing medical needs. Staffed by RNs, LPNs, and CNAs. Inspected and star-rated annually by CMS. Accepts Medicare (short-term rehab) and Medicaid (long-term care).

Little Rock (John Barrow)70 57.1% -20%4.37 +28%-7%$0163.2-49A+ 10 Samuel Vallery$5.7M$3.2M56.3%45288
Hickory Heights Health & Rehab
NH

Nursing Home Licensed facility providing 24/7 skilled nursing care for residents with complex, ongoing medical needs. Staffed by RNs, LPNs, and CNAs. Inspected and star-rated annually by CMS. Accepts Medicare (short-term rehab) and Medicaid (long-term care).

Little Rock120 99.2% +39%4.78 +47%+2%$0235.8-119A+ 10 Renee Phillips$17.0M$7.4M43.7%45455
The Green House Cottages of Poplar Grove
NH

Nursing Home Licensed facility providing 24/7 skilled nursing care for residents with complex, ongoing medical needs. Staffed by RNs, LPNs, and CNAs. Inspected and star-rated annually by CMS. Accepts Medicare (short-term rehab) and Medicaid (long-term care).

AL

Assisted Living A licensed, long-term care setting for seniors or individuals with disabilities who need help with daily activities — like bathing, dressing, and medication management — but not 24-hour skilled nursing. Offers housing, meals, and around-the-clock support while aiming to maximize resident independence.

HC

Home Care Professional care delivered in the person's own home — from companionship and errands to skilled nursing and therapy. Allows seniors to age in place. Medicare covers skilled home health when medically necessary.

MC

Memory Care Secured, specialized care for people living with Alzheimer's or dementia. Staff trained in cognitive impairment, with higher staff-to-resident ratios and an environment designed to reduce confusion and wandering risk.

RC

Respite Care Short-term temporary care — days to weeks — to give family caregivers a break. Full care provided during the stay. Often used after hospitalization or to trial a facility before a permanent placement decision.

Little Rock (Leander)120 89.2% +25%6.16 -32%+32%$0343.4-107A+ 31 Marybret, LLC$16.0M$8.3M51.9%45466
Good Shepherd Nursing and Rehabilitation Center
NH

Nursing Home Licensed facility providing 24/7 skilled nursing care for residents with complex, ongoing medical needs. Staffed by RNs, LPNs, and CNAs. Inspected and star-rated annually by CMS. Accepts Medicare (short-term rehab) and Medicaid (long-term care).

Little Rock (John Barrow)120 89.8% +26%3.98 -60%-15%$0357.0-96- 1 Bobby Lamb$17.5M$6.7M38.6%45343

Frequently Asked Questions about Good Shepherd Nursing and Rehabilitation Center

What neighborhood is Good Shepherd Nursing and Rehabilitation Center in?

Good Shepherd Nursing and Rehabilitation Center is in the John Barrow neighborhood.

Is Good Shepherd Nursing and Rehabilitation Center in a walkable area?

Good Shepherd Nursing and Rehabilitation Center has a walk score of 1. Car-dependent. Most errands require a car, with limited nearby walkable options.

What is the phone number of Good Shepherd Nursing and Rehabilitation Center?

(501) 217-9774 will put you in contact with the team at Good Shepherd Nursing and Rehabilitation Center.

Is Good Shepherd Nursing and Rehabilitation Center Medicare or Medicaid certified?

Yes — Good Shepherd Nursing and Rehabilitation Center is a CMS-certified provider of Medicare and Medicaid.

Guides for Better Senior Living

Care Cost Calculator: See Prices in Your Area

Nursing Home Data Explorer

Don’t Wait Too Long: 7 Red Flag Signs Your Parent Needs Assisted Living Now

The True Cost of Assisted Living in 2025 – And How Families Are Paying For It

Understanding Senior Living Costs: Pricing Models, Discounts & Financial Assistance

Explore Open Rooms
1 Contact details
2 What type of senior care service are you looking for?
3 What budget do you have in mind for senior care?
4 How soon do you need to find care?
5 Additional details

Thank you for your interest!

Our team will be in touch shortly to help with next steps.