Ozark Nursing And Rehab
Nursing Home, Memory Care, Respite Care & Skilled Nursing · Ozark, AR
CMS overall rating Info CMS (the Centers for Medicare & Medicaid Services) is the federal agency that rates nursing home quality. Its Overall Rating runs from 1 to 5 stars, combining health inspections, staffing, and quality measures, with inspections weighted most heavily.

Ozark Nursing And Rehab

Nursing Home, Memory Care, Respite Care & Skilled Nursing · Ozark, AR
CMS overall rating Info CMS (the Centers for Medicare & Medicaid Services) is the federal agency that rates nursing home quality. Its Overall Rating runs from 1 to 5 stars, combining health inspections, staffing, and quality measures, with inspections weighted most heavily.
Calculator: See prices in your area
Ozark Nursing And Rehab accepts Medicaid, Medicare, and private pay.

Overview of Ozark Nursing and Rehab

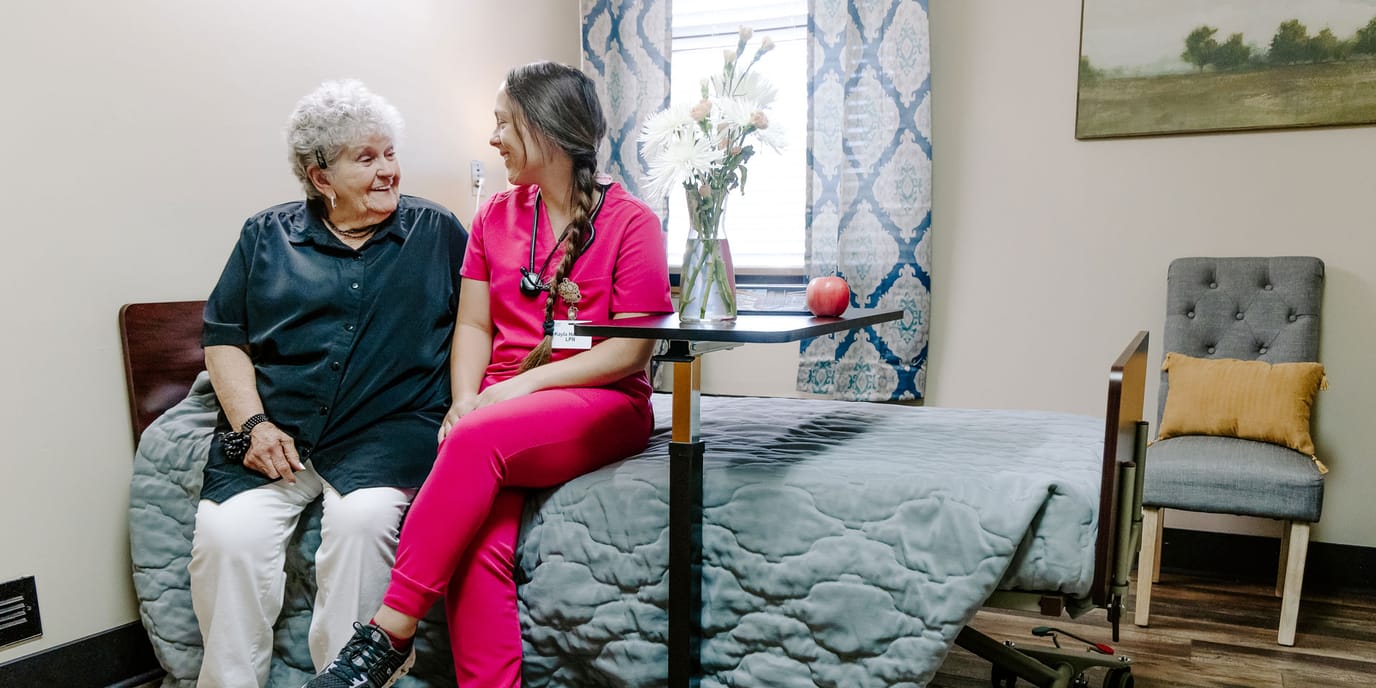
Ashley Miles owns Ozark Nursing and Rehab, a 135-bed facility on North 12th Street in Ozark, Arkansas, operated by Ozark SNF Operations, LLC. The building runs at a 56 percent occupancy rate, meaning there are immediate vacancies for new placements. The average length of stay is 538 days, which shows the staff primarily focuses on extended residential care while maintaining a smaller setup for short-term post-hospital therapy.

An on-staff physician coordinates clinical services alongside a 24-hour nursing team that delivers about 4 hours and 33 minutes of direct, hands-on care per resident daily. This crew of registered nurses, practical nurses, and assistants handles daily medical routines and physical rehab right inside the building.

The surrounding area carries a 59 walk score, allowing visitors to tackle a few quick errands on foot, though most trips nearby will still require a vehicle.

Prospective residents can call the administrative office to ask about current room choices or to get details on the general intake requirements. The team can also go over their recent state survey reports with you, which pointed out specific compliance issues with infection control, sanitation, and care documentation, so you can see exactly how the staff monitors daily health and safety procedures.

Quality ratings

Measured by Centers for Medicare & Medicaid Services (CMS)

Overall rating Info The Overall CMS Rating combines results from health inspections, staffing levels and quality measures. Health inspections carry the most weight. Staffing and quality scores can increase or decrease the final rating based on performance compared to state and national standards.
Health Inspection Info Based on the results of the facility's three most recent standard inspections and any complaint investigations. CMS reviews the number, scope, and severity of deficiencies, with more recent findings weighted more heavily.
Staffing Info Measures average nursing staff hours per resident per day, including Registered Nurses (RNs) and total nursing staff. Ratings are adjusted based on the level of care residents require and are compared to state and national benchmarks.
Quality Measures Info Based on clinical and physical health indicators reported to CMS, such as hospital readmissions, falls, pressure ulcers, and improvements in mobility. These measures reflect how well residents' health needs are being managed.

Staffing hours breakdown

Info Daily nursing hours per resident by staff type, reported to CMS. Higher is generally better — compare this facility to state and national averages to see where staffing stands.

Hours per resident per day — compared to state averages

Total nursing care / resident Info Total adjusted nursing hours per resident per day, combining RN, LPN, and aide time. CMS adjusts this for case-mix so facilities can be fairly compared.
4h 33m per day
vs avg

5 of 6 metrics below state avg

Standout metric Physical Therapist is +68% above state avg
Staff typeHours / Day / Residentvs state avg
Registered Nurse (RN) Info RNs hold the highest nursing license and can assess residents, interpret test results, and direct care plans. More RN hours per day often signals stronger clinical oversight and faster response to health changes. 19m per day ▼ 22% State avg: 24m per day · National avg: 41m per day
LPN / LVN Info Licensed Practical Nurses (LPNs) or Licensed Vocational Nurses (LVNs) deliver routine hands-on care — medication administration, wound dressing, and monitoring vital signs. They work under RN supervision and make up a large share of daily bedside care. 46m per day ▼ 20% State avg: 57m per day · National avg: 52m per day
Nurse Aide Info Certified Nurse Aides (CNAs) provide the most direct day-to-day assistance: bathing, dressing, feeding, and mobility. Nurse aide hours are typically the largest staffing category and directly affect residents' quality of life. 2h 37m per day ▼ 4% State avg: 2h 43m per day · National avg: 2h 20m per day
Weekend Total Nursing Info Combined nursing hours (RN + LPN + Nurse Aide) per resident per day on weekends. Staffing often drops on weekends — this figure reveals whether the facility maintains adequate coverage outside of weekday hours. 3h 11m per day ▼ 8% State avg: 3h 29m per day · National avg: 3h 26m per day
Physical Therapist Info Hours per resident per day provided by licensed Physical Therapists (PTs) or PT Assistants. PT services help residents recover mobility after injury or illness and are especially important for post-acute (short-stay) rehabilitation. 3m per day ▲ 68% State avg: 2m per day · National avg: 4m per day
Weekend RN Info Registered nurse hours specifically on weekends. Facilities sometimes reduce RN presence on Saturdays and Sundays — a low weekend RN figure compared to weekday hours can indicate reduced clinical oversight when most administrative staff are absent. 13m per day ▼ 19% State avg: 16m per day · National avg: 28m per day

Capacity and availability

Avg. Length of Stay Info Average number of days residents stay at this facility, based on CMS cost report data. Shorter stays often reflect post-acute or rehab care; longer stays reflect long-term care.
538 days
Bed community size
135-bed community Rank #41 / 330Bed count — State benchmarkedThis home is ranked 41st out of 330 homes in Arkansas. Shows this facility's certified or reported bed count compared to other Arkansas facilities. Larger communities may offer more amenities, programs, and on-site services for residents and families.Rankings are based only on facilities in Arkansas that report data for that category. Facilities without available data are excluded from the ranking.Click the rank badge to see the full State ranking.Click here to see the full State ranking.
A larger shared setting that may offer more common spaces and organized community services.
Walk Score
Walk Score: 59 / 100 Rank #56 / 419Walk Score — State benchmarkedThis home is ranked 56th out of 419 homes in Arkansas. Shows how walkable this facility's neighborhood is compared to the average Walk Score across Arkansas facilities. Higher scores benefit residents, families, and staff.Rankings are based only on facilities in Arkansas that report data for that category. Facilities without available data are excluded from the ranking.Click the rank badge to see the full State ranking.Click here to see the full State ranking.
Moderately walkable. Some errands can be accomplished on foot, with a mix of nearby amenities.

About this community

Occupancy

Occupancy rate
56%
Lower than the Arkansas average: 71.3%
Occupied beds
76 / 135
Average occupied beds in Arkansas homes 77 beds

License Details

Facility TypeSkilled Nursing Facility With Dual Certified Beds (medicaid/medicare)
CountyFranklin
CMS Certification Number045386
Certification TypeMedicaid / Medicare

Ownership & Operating Entity

Ozark Nursing And Rehab is legally operated by Ozark SNF Operations, LLC., and administered by Ashley Miles.

Owner NameOzark Snf Operations, LLC
Profit StatusFor-profit

Type Of Units

Medicaid and Medicare
135 units
Total beds
135 units

Payment & Insurance

2 services
Accept Medicaid
Accept Medicare

Therapy & Rehabilitation

1 service
Rehabilitation Services

Staffing & Medical

2 services
Doctor on Staff
24-Hour Staffing

Contact Information

Fax479-667-5791

Contact Ozark Nursing And Rehab

Inspection History

In Arkansas, the Department of Human Services, Office of Long Term Care is authorized to conduct unannounced inspections and issue official quality of care reports for all senior living providers.

Since 2022 · 4 years of data 15 deficiencies

Inspection Scorecard Info This scorecard compares key inspection, deficiency, and complaint metrics at this facility against the Arkansas state average. Metrics rated ≥15% worse than average are highlighted in red; those ≥15% better are highlighted in green.

Since 2022 vs. Arkansas state average
Overall vs. AR average 0 Worse No metrics in this bucket. 2 Better Metrics better than Arkansas average:
• Total deficiencies (29% below)
• Deficiencies per year (28% below)
Latest Inspection August 15, 2024 Other An inspection that falls outside standard annual surveys and formal complaint investigations. May include administrative compliance checks, documentation reviews, focused surveys on specific concerns, or revisit surveys to verify prior corrections.

Deficiencies Info Deficiencies are formal regulatory issues recorded during state inspections.

This FacilityAR Averagevs. AR Avg
Total deficiencies Info Formal regulatory issues recorded by inspectors across all inspection types. 1521 This facility has 29% fewer total deficiencies than a typical Arkansas assisted living residence (15 vs. AR avg 21).↓ 29% better
Deficiencies per year Info Average deficiencies per year since 2022. 3.85.3 This facility has 28% fewer deficiencies per year than a typical Arkansas assisted living residence (3.8 vs. AR avg 5.3).↓ 28% better

Inspection Reports Summary Info An editor-reviewed summary of the themes and findings across this facility's recent inspection reports.

  • April 17, 2023 annual inspection found no health deficiencies and no complaints were substantiated.
  • June 23, 2023 routine survey cited 12 deficiencies including catheter care, medication coding, food handling, documentation, and room maintenance issues.
  • August 15, 2024 inspection found one deficiency for unclean kitchen equipment and lack of sanitization policy, posing a potential illness risk to 76 residents.

Health Inspection History

Inspections since 2022
Total health inspections 3

State average N/A


Last Health inspection on Aug 2024

Total health citations
15

State average N/A

Citations per inspection
5

State average N/A


Health citations are formal notices following inspections when they fail to comply with safety and care standards.

All 15 citations resulted from standard inspections.

Breakdown of citation severity (last 4 years)
Critical health citations
0
In line with State average

State average: N/A


Serious health citations
0
In line with State average

State average: N/A

0 critical citations State average: N/A

0 serious citations State average: N/A

14 moderate citations State average: N/A

1 minor citation State average: N/A
Citations history (last 4 years)
Nutrition moderate citation Aug 15, 2024
Corrected

Environmental moderate citation Jun 23, 2023
Corrected

Infection Control moderate citation Jun 23, 2023
Corrected

Nutrition moderate citation Jun 23, 2023
Corrected

Staffing Data

Reporting period: October 1 – December 31, 2025 (Q4 2025). Source: CMS Payroll-Based Journal report.

Total staff 103
Employees 88
Contractors 15
Staff to resident ratio 1.26 : 1
0% compared with State average

State average ratio: 0 : 0

Avg staff/day 39
Average shift 8.9 hours
0% compared with State average

State average: 0 hours

Total staff hours (quarter) 31,962

Nursing staff breakdown

Q4 2025 · Oct 1 – Dec 31 More info This data comes from the CMS Payroll-Based Journal report covering October 1 – December 31, 2025.
Registered Nurse

Manages medical care and health needs.

RN Staff Info All 4 RN Staff are full-time employees. No contractors work on this role. 4
Average shift length Info Average shift length. Calculated as total hours divided by days worked and average staff per day. 9.7 hours
Licensed Practical Nurse

Assists with medical care and medications.

LPN Staff Info All 12 LPN Staff are full-time employees. No contractors work on this role. 12
Average shift length Info Average shift length. Calculated as total hours divided by days worked and average staff per day. 10.1 hours
Certified Nursing Assistant

Helps with daily care and mobility.

CNA Staff Info All 51 CNA Staff are full-time employees. No contractors work on this role. 51
Average shift length Info Average shift length. Calculated as total hours divided by days worked and average staff per day. 9.5 hours

Contractor staffing

Q4 2025 · Oct 1 – Dec 31 More info This data comes from the CMS Payroll-Based Journal report covering October 1 – December 31, 2025.

Total hours from contractors

5.3%

1,690 contractor hours this quarter

Clinical Nurse Specialist: 3 Physical Therapy Assistant: 2 Physical Therapy Aide: 2 Speech Language Pathologist: 2 Qualified Social Worker: 2 Respiratory Therapy Technician: 1 Occupational Therapy Aide: 1 Occupational Therapy Assistant: 1 Medical Director: 1

Staff by category

Q4 2025 · Oct 1 – Dec 31 More info This data comes from the CMS Payroll-Based Journal report covering October 1 – December 31, 2025.
Certified Nursing Assistant5105119,41092100%9.5
Licensed Practical Nurse120125,32792100%10.1
Clinical Nurse Specialist5381,2048997%7.3
Nurse Aide in Training4049067379%8.9
RN Director of Nursing2027465762%7.6
Registered Nurse4047235863%9.7
Nurse Practitioner4045586672%7.6
Medication Aide/Technician2025086470%7.9
Mental Health Service Worker1014726065%7.9
Dietitian1014526267%7.3
Respiratory Therapy Technician0114466571%6.9
Physical Therapy Aide0224366672%6.5
Administrator1014065257%7.8
Speech Language Pathologist0222424650%5.3
Occupational Therapy Aide0113767%6.2
Physical Therapy Assistant022372527%1.5
Other Dietary Services Staff1013555%7
Medical Director0111167%1.8
Occupational Therapy Assistant011733%2.3
Qualified Social Worker022222%1
51 Certified Nursing Assistant
% of Days 100%
12 Licensed Practical Nurse
% of Days 100%
8 Clinical Nurse Specialist
% of Days 97%
4 Nurse Aide in Training
% of Days 79%
2 RN Director of Nursing
% of Days 62%
4 Registered Nurse
% of Days 63%
4 Nurse Practitioner
% of Days 72%
2 Medication Aide/Technician
% of Days 70%
1 Mental Health Service Worker
% of Days 65%
1 Dietitian
% of Days 67%
1 Respiratory Therapy Technician
% of Days 71%
2 Physical Therapy Aide
% of Days 72%
1 Administrator
% of Days 57%
2 Speech Language Pathologist
% of Days 50%
1 Occupational Therapy Aide
% of Days 7%
2 Physical Therapy Assistant
% of Days 27%
1 Other Dietary Services Staff
% of Days 5%
1 Medical Director
% of Days 7%
1 Occupational Therapy Assistant
% of Days 3%
2 Qualified Social Worker
% of Days 2%

Penalties and fines

Federal penalties imposed by CMS for regulatory violations, including civil money penalties (fines) and denials of payment for new Medicare/Medicaid admissions.

Source: CMS Penalties Database

No penalties in the past 3 years

No civil money penalties or payment denials were reported in the last 3 years.

Quality of care over time

These measures show how residents usually do over time at this home, based on health outcomes and preventive care.

High-risk clinical events score Info A composite score based on pressure ulcers, falls with injury, weight loss, walking ability decline, and activities of daily living decline. 4.6
40% better than State average

State average: 7.7

Functional decline score Info A composite score based on activities of daily living decline, walking ability decline, and incontinence. 9.4
29% better than State average

State average: 13.3

Long-stay resident measures
Significantly above average State avg: 4.2 Info CMS star rating based on long-stay quality measure performance. 5 stars = significantly above average, 1 star = significantly below average.
Need for Help with Daily Activities Increased Info Percent of long-stay residents whose need for help with daily activities has increased 9.0%
22% better than State average

State average: 11.5%

Walking Ability Worsened Info Percent of long-stay residents whose ability to move independently worsened 7.6%
43% better than State average

State average: 13.4%

Low Risk Residents with Bowel/Bladder Incontinence Info Percent of low risk long-stay residents who lose control of their bowels or bladder 11.7%
23% better than State average

State average: 15.1%

Falls with Major Injury Info Percent of long-stay residents experiencing one or more falls with major injury 2.2%
43% better than State average

State average: 3.9%

High Risk Residents with Pressure Ulcers Info Percent of long-stay high risk residents with pressure ulcers 1.7%
65% better than State average

State average: 4.7%

Urinary Tract Infection Info Percent of long-stay residents with a urinary tract infection 1.3%
In line with State average

State average: 1.3%

Lost Too Much Weight Info Percent of long-stay residents who lose too much weight 2.4%
52% better than State average

State average: 5.0%

Depressive Symptoms Info Percent of long-stay residents who have depressive symptoms 7.1%
360% worse than State average

State average: 1.5%

Antipsychotic Use Info Percent of long-stay residents who received an antipsychotic medication 6.0%
43% better than State average

State average: 10.5%

Pneumococcal Vaccine Info Percent of long-stay residents assessed and appropriately given the pneumococcal vaccine 100.0%
6% better than State average

State average: 94.4%

Influenza Vaccine Info Percent of long-stay residents assessed and appropriately given the seasonal influenza vaccine 78.8%
18% worse than State average

State average: 96.2%

Hospitalizations per 1,000 days Info Number of hospitalizations per 1,000 long-stay resident days. 2.07
5% worse than State average

State average: 1.97

ED visits per 1,000 days Info Number of outpatient emergency department visits per 1,000 long-stay resident days. 1.34
39% better than State average

State average: 2.18

Short-stay resident measures
Pneumococcal Vaccine Info Percent of short-stay residents assessed and appropriately given the pneumococcal vaccine 96.7%
20% better than State average

State average: 80.9%

Antipsychotic medication increase Info Percent of short-stay residents who newly received an antipsychotic medication 0.0%
100% better than State average

State average: 1.5%

Influenza Vaccine Info Percent of short-stay residents assessed and appropriately given the seasonal influenza vaccine 19.2%
75% worse than State average

State average: 77.7%

Falls with major injury Info Percentage of SNF residents who experience falls with major injury during their stay. 0.0%
100% better than State average

State average: 0.8%

Breakdown by payment type

Medicare

28% of new residents, usually for short-term rehab.

Typical stay 2 months

Private pay

49% of new residents, often for short stays.

Typical stay 7 - 8 months

Medicaid

23% of new residents, often for long-term daily care.

Typical stay 5 - 6 years

Facility Characteristics

Source: CMS Long-Term Care Facility Characteristics (Data as of Jan 2026)

Total residents 82
Medicare
5
6.1% of residents
Medicaid
56
68.3% of residents
Private pay or other
21
25.6% of residents
Programs & Services
Family Member Group

Family members meet regularly to discuss policies, care quality, and activities

Clinical Research

Conducts clinical research trials to develop and test new treatments

CCRC

Part of a Continuing Care Retirement Community offering multiple care levels

Active Family Council

Organized group of family members that meets regularly to discuss facility policies, resident care, and activities.

Finances and operations

Based on CMS SNF Cost Report for fiscal year ending in 12/2023.

For-profit
Operated by a single business entity.
Net patient revenue Info Net patient revenue — what the home actually collects for resident care, after contractual allowances, bad debt and discounts are subtracted from its gross charges (CMS cost report, Worksheet G-3). It covers resident care only; money the home earns from other sources is shown separately as "Other income."
$7.2M
Net patient income Info Net patient income: net patient revenue minus the home's total operating expenses. A positive figure means it earns more from resident care than it spends to deliver it; a negative figure means the opposite. It excludes non-operating "other income."
-$441.7K
For-profit Operated by a single business entity.
Net patient revenue Info Net patient revenue — what the home actually collects for resident care, after contractual allowances, bad debt and discounts are subtracted from its gross charges (CMS cost report, Worksheet G-3). It covers resident care only; money the home earns from other sources is shown separately as "Other income."
$7.2M
Net patient income Info Net patient income: net patient revenue minus the home's total operating expenses. A positive figure means it earns more from resident care than it spends to deliver it; a negative figure means the opposite. It excludes non-operating "other income."
-$441.7K
Other income Info Money the home earns outside of resident care — such as investments, grants, rentals and other non-operating sources (CMS cost report, Worksheet G-3). It is tracked separately from net patient revenue: it is not part of that figure, and it is not included in net patient income.
$204.2K
Payroll costs Info Staff salaries plus wage-related costs — benefits such as payroll taxes, health insurance and retirement — from the home's own accounting records (CMS cost report, Worksheet A). Contract or agency labor is counted separately, under other operating costs.
$3.7M 51.8% of net patient revenue Info Payroll as a share of revenue: staff salaries and wage-related benefits divided by net patient revenue. A higher figure means more of each revenue dollar goes to staff pay.
Other operating costs Info Everything it costs to run the home apart from payroll — food, utilities, supplies, maintenance, contract labor and administration. Calculated as total operating expense minus payroll (staff salaries and wage-related benefits).
$3.9M
Total costs Info The home's total operating expense for the year — all the costs of running it, salaries included (CMS cost report, Worksheet G-3).
$7.6M

Who this home usually serves

TYPE OF STAY

Mix of rehab and long-term care

This home supports both short-term rehab and long-term care, with residents staying for a wide range of durations.

New residents most often arrive under private pay (49% of admissions), and a typical private pay stay runs around 7 - 8 months.

Admissions
47 total

Coverage residents most often arrive under.

Medicare 28%
Private pay 49%
Medicaid 23%
Discharges
53 total

Coverage residents most often leave under.

Medicare 21%
Private pay 51%
Medicaid 28%

Places of interest near Ozark Nursing And Rehab

Address 0.0 miles from city center Info Estimated distance in miles from Ozark's city center to Ozark Nursing And Rehab's address, calculated via Google Maps.

Calculate Travel Distance to Ozark Nursing And Rehab

Add your location

Address

Compare Nursing Homes around the area

The information below is reported by the Arkansas Department of Human Services, Office of Long Term Care.

Indian Rock Village
NH
Fairfield Bay -55 - 11 Studio / 1 Bed / 2 Bed
Bear Creek Healthcare LLC
NH
De Queen -131 - 35 -
Ozark Nursing And Rehab
NH
MC
RC
SNF
Ozark -135 - 59 -
Heartland Rehabilitation and Care Center
NH
RC
SNF
Benton -119 A+ 0 -
Barnes Healthcare
NH
MC
Lonoke -141 A+ 38 Private / Shared Rooms

Frequently Asked Questions about Ozark Nursing And Rehab

Who is the owner of Ozark Nursing And Rehab?

Ozark Nursing And Rehab is legally operated by Ozark SNF Operations, LLC., and administered by Ashley Miles.

Is Ozark Nursing And Rehab in a walkable area?

Ozark Nursing And Rehab has a walk score of 59. Moderately walkable. Some errands can be accomplished on foot, with a mix of nearby amenities.

What is the occupancy rate at Ozark Nursing And Rehab?

Ozark Nursing And Rehab's occupancy is 56%.

Does Ozark Nursing And Rehab operate as a for-profit or non-profit?

Ozark Nursing And Rehab is registered as a for-profit in AR.

Who is the administrator of Ozark Nursing And Rehab?

Ashley Miles is the administrator of Ozark Nursing And Rehab.

How many beds does Ozark Nursing And Rehab have?

Ozark Nursing And Rehab has 135 beds.

Are there photos of Ozark Nursing And Rehab?

Yes — there are 5 photos of Ozark Nursing And Rehab in the photo gallery on this page.

Guides for Better Senior Living

Care Cost Calculator: See Prices in Your Area

Nursing Home Data Explorer

Don’t Wait Too Long: 7 Red Flag Signs Your Parent Needs Assisted Living Now

The True Cost of Assisted Living in 2025 – And How Families Are Paying For It

Understanding Senior Living Costs: Pricing Models, Discounts & Financial Assistance