


Total health inspections
3
State average 4.2
Last Health inspection on Sep 2024
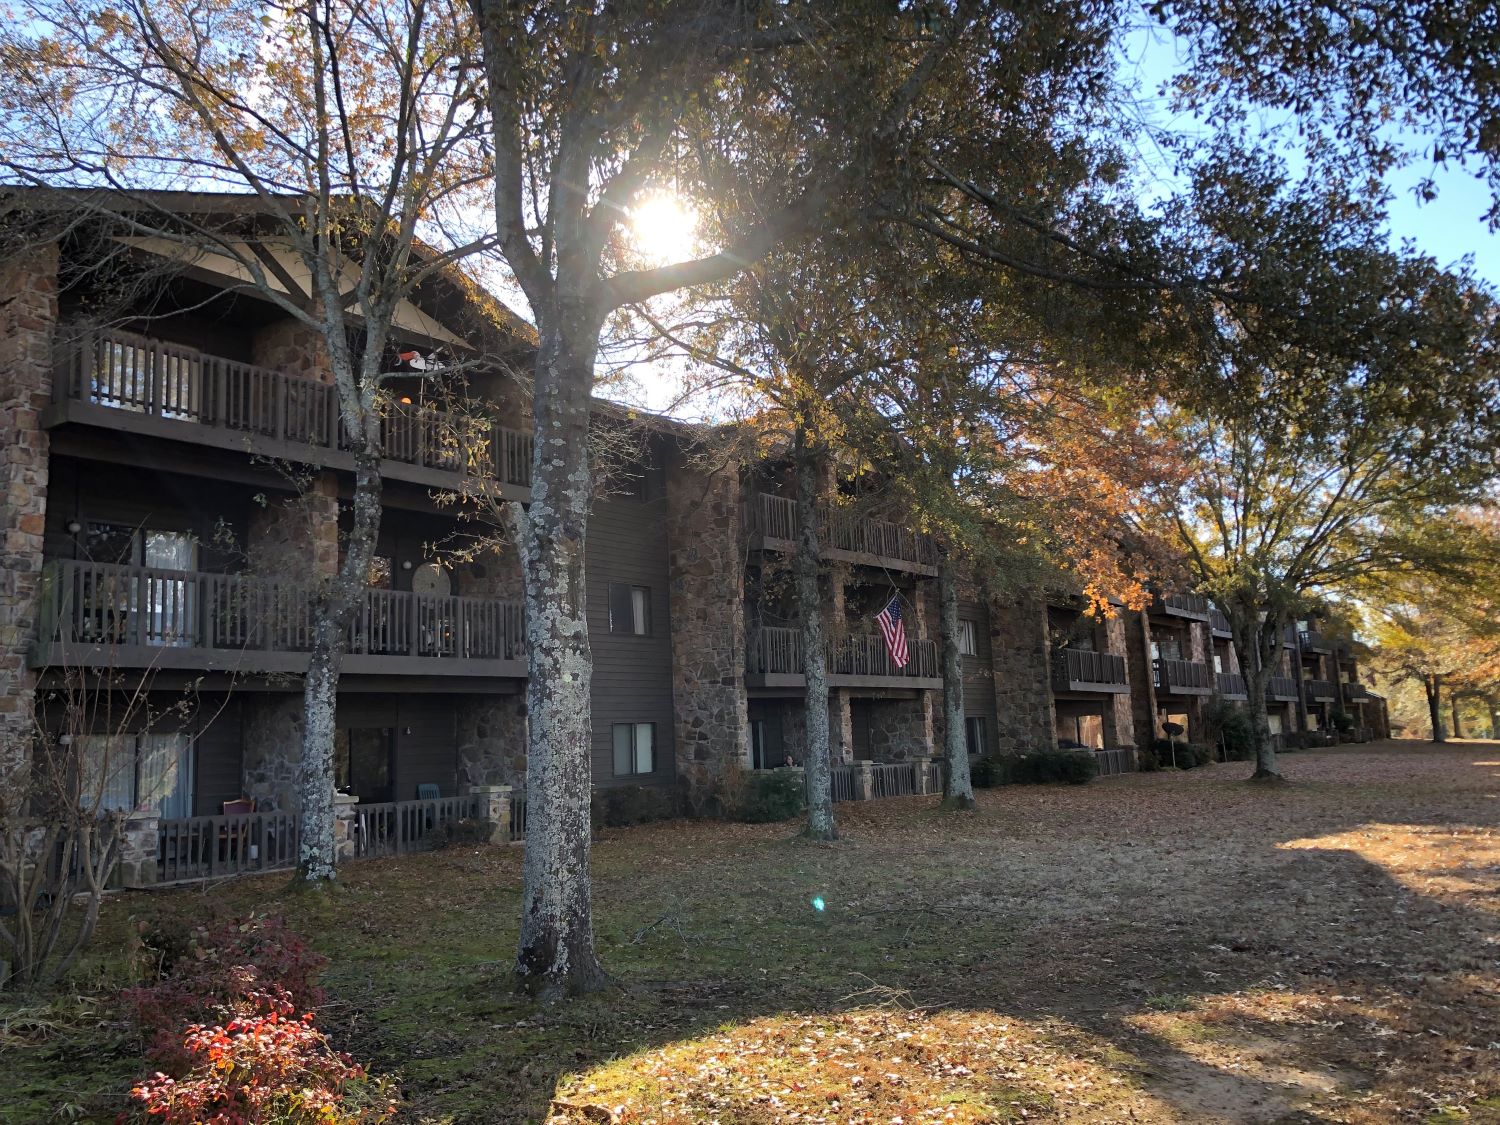
Indian Rock Village is located at 265 Dave Creek Pkwy in Fairfield Bay, Arkansas. It is a three-story complex that integrates nursing home, assisted living, and independent living care. They offer private rooms, skilled nursing, and rehabilitation services, while accepting Medicare, Medicaid, and private pay.
Data suggests an average length of stay of 142 days, which indicates this population is less transient than a short-term rehab setting. Current occupancy sits at 65.5%.
Looking at the staffing metrics, they provide 4 hours and 34 minutes of nursing coverage per resident daily. The breakdown is 44 minutes of RN time, 39 minutes of LPN time, and 2 hours and 18 minutes of nurse aide time. That RN allocation is actually quite significant for a facility in a rural Arkansas setting.
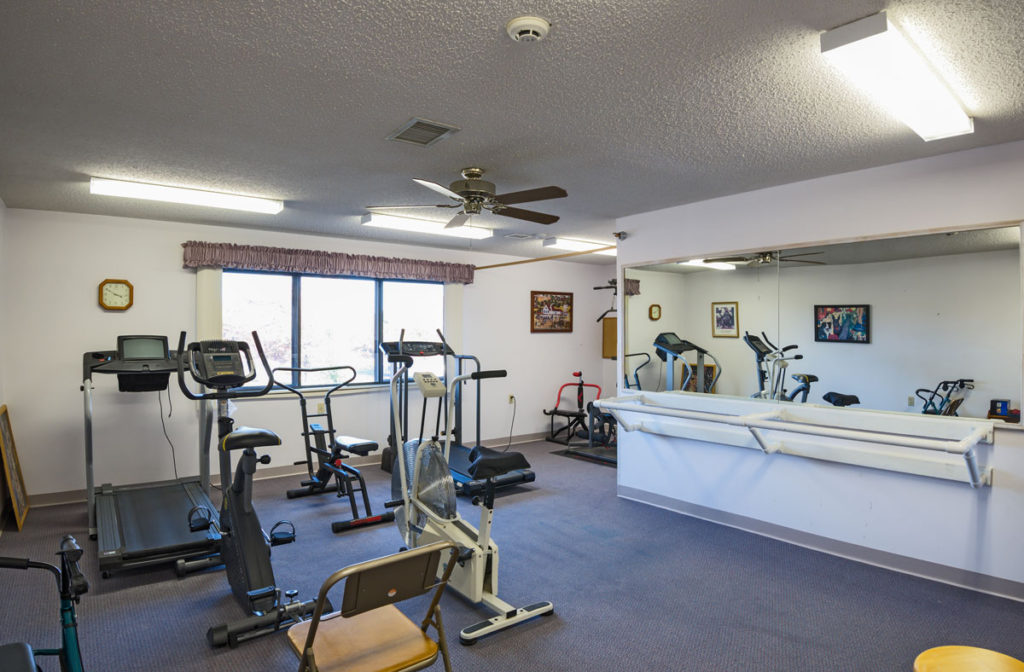
While the facility mentions activities like fitness opportunities and social gatherings, it lacks specifics on the execution of these programs. Regulatory inspections have touched on standard operational domains such as infection control, documentation, dietary services, and environmental safety.
The location has a Walk Score of 11, which is expected for Fairfield Bay, a rural lakeside environment where a car is functionally mandatory for off-campus transit. For those in Van Buren County evaluating multi-level care with a focus on long-term residency and a robust RN presence, Indian Rock Village offers a versatile solution with broad payment acceptance.
| Staff type | Hours / Day / Resident | vs state avg |
|---|---|---|
|
Registered Nurse (RN)
| 44m per day | ▲ 84% State avg: 24m per day · National avg: 41m per day |
|
LPN / LVN
| 39m per day | ▼ 31% State avg: 57m per day · National avg: 52m per day |
|
Nurse Aide
| 2h 18m per day | ▼ 16% State avg: 2h 44m per day · National avg: 2h 21m per day |
|
Weekend Total Nursing
| 3h 18m per day | ▼ 5% State avg: 3h 29m per day · National avg: 3h 26m per day |
|
Physical Therapist
| 1m per day | ▼ 54% State avg: 2m per day · National avg: 4m per day |
|
Weekend RN
| 26m per day | ▲ 64% State avg: 16m per day · National avg: 29m per day |
In Arkansas, the Department of Human Services, Office of Long Term Care is authorized to conduct unannounced inspections and issue official quality of care reports for all senior living providers.
Deficiencies
| This Facility | AR Average | vs. AR Avg |
|---|---|---|---|
|
Total deficiencies
| 17 | 21 | This facility has 19% fewer total deficiencies than a typical Arkansas nursing home (17 vs. AR avg 21).↓ 19% better |
State average 4.2
Last Health inspection on Sep 2024
State average 21.8
State average 5.32
Health citations are formal notices following inspections when they fail to comply with safety and care standards.
All 9 citations resulted from standard inspections.
State average: 0.4
State average: 0.2
Reporting period: October 1 – December 31, 2025 (Q4 2025). Source: CMS Payroll-Based Journal report.
Manages medical care and health needs.
Assists with medical care and medications.
Helps with daily care and mobility.
Total hours from contractors
58 contractor hours this quarter
| Certified Nursing Assistant | 22 | 0 | 22 | 5,571 | 92 | 100% | 8.7 |
| Licensed Practical Nurse | 5 | 0 | 5 | 1,732 | 92 | 100% | 9.4 |
| Registered Nurse | 8 | 0 | 8 | 1,645 | 87 | 95% | 10.6 |
| Medication Aide/Technician | 3 | 0 | 3 | 1,568 | 90 | 98% | 9.6 |
| Nurse Aide in Training | 3 | 0 | 3 | 648 | 36 | 39% | 11.5 |
| Administrator | 3 | 0 | 3 | 496 | 62 | 67% | 8 |
| Nurse Practitioner | 1 | 0 | 1 | 496 | 62 | 67% | 8 |
| RN Director of Nursing | 1 | 0 | 1 | 480 | 60 | 65% | 8 |
| Dental Services Staff | 1 | 0 | 1 | 429 | 62 | 67% | 6.9 |
| Qualified Social Worker | 1 | 0 | 1 | 400 | 50 | 54% | 8 |
| Clinical Nurse Specialist | 2 | 0 | 2 | 354 | 76 | 83% | 3.9 |
| Physical Therapy Aide | 1 | 0 | 1 | 232 | 36 | 39% | 6.4 |
| Respiratory Therapy Technician | 3 | 0 | 3 | 52 | 28 | 30% | 1.9 |
| Physical Therapy Assistant | 2 | 0 | 2 | 31 | 21 | 23% | 1.5 |
| Medical Director | 0 | 1 | 1 | 24 | 3 | 3% | 8 |
| Occupational Therapy Aide | 0 | 1 | 1 | 24 | 12 | 13% | 2 |
| Occupational Therapy Assistant | 0 | 1 | 1 | 10 | 4 | 4% | 2.4 |
Federal penalties imposed by CMS for regulatory violations, including civil money penalties (fines) and denials of payment for new Medicare/Medicaid admissions.
Source: CMS Penalties Database
No penalties in the past 3 years
No civil money penalties or payment denials were reported in the last 3 years.
These measures show how residents usually do over time at this home, based on health outcomes and preventive care.
Arkansas average: 7.7
Arkansas average: 13.3
Arkansas average: 11.5%
Arkansas average: 13.4%
Arkansas average: 15.1%
Arkansas average: 3.9%
Arkansas average: 4.7%
Arkansas average: 1.3%
Arkansas average: 5.0%
Arkansas average: 1.5%
Arkansas average: 10.5%
Arkansas average: 94.4%
Arkansas average: 96.2%
Arkansas average: 1.97
Arkansas average: 2.18
Arkansas average: 80.9%
Arkansas average: 1.5%
Arkansas average: 77.7%
Arkansas average: 25.2%
Arkansas average: 13.8%
Arkansas average: 0.8%
Arkansas average: 53.7%
Arkansas average: 50.6%
Quality measures are calculated from Minimum Data Set (MDS) assessments. For most measures, lower percentages indicate better care quality.
44% of new residents, usually for short-term rehab.
49% of new residents, often for short stays.
8% of new residents, often for long-term daily care.
Source: CMS Long-Term Care Facility Characteristics (Data as of Jan 2026)
Data sourced from CMS Long-Term Care Facility Characteristics quarterly report. Payer mix reflects the current resident census by primary payment source.
Historical financial and operational data for Indian Rock Village from 2012–2024, based on CMS SNF Cost Reports.
Key figures below are for fiscal year ending in 06/2024.
Based on CMS SNF Cost Report for fiscal year ending in 06/2024.
Housing Options: Private Rooms
Building Type: 3-story
Transportation Services
Fitness and Recreation
This home supports both short-term rehab and long-term care, with residents staying for a wide range of durations.
New residents most often arrive under private pay (49% of admissions), and a typical private pay stay runs around 3 - 4 months.
Coverage residents most often arrive under.
Coverage residents most often leave under.
![]() 0.6 miles from city center
0.6 miles from city center
![]() Estimated distance in miles from Fairfield Bay's city center to Indian Rock Village's address, calculated via Google Maps.
Estimated distance in miles from Fairfield Bay's city center to Indian Rock Village's address, calculated via Google Maps.
Add your location
Info below is compiled from CMS reports & the AR Dept. of Human Services (DHS), senior community websites & trusted data sources such as Walk Score & BBB.
Communities are listed from highest to lowest based on our ranking methodology.
| Hillcrest Home | NH SNF | Harrison | 110
Facility
110
AR AVG
84
Rank
#90 / 329 |
79.1%
Facility
79.1%
AR AVG
65.7
Rank
#49 / 165 | +20% | 5.97
Facility
5.97
AR AVG
4.67
Rank
#16 / 184 | +72% | +28% | $0
Facility
$0
AR AVG
$27.3k
Rank
#1 / 189 | 7
Facility
7
AR AVG
21.8
Rank
#6 / 188 | 1.8
Facility
1.8
AR AVG
5.3
Rank
#3 / 188 | - | 87 | - |
24
Facility
24
AR AVG
34
Rank
#266 / 416 | Miss Ion Interests Committee Inc | $11.9MFiscal year ending 06/2024
Facility
$11.9MFiscal year ending 06/2024
AR AVG
$9.4M
Rank
#32 / 184 | $7.7MFiscal year ending 06/2024
Facility
$7.7MFiscal year ending 06/2024
AR AVG
$3.4M
Rank
#4 / 184 | 65.2%Fiscal year ending 06/2024
Facility
65.2%Fiscal year ending 06/2024
AR AVG
37.9%
Rank
#18 / 184 | 45441 | ||||
| Legacy Heights Nursing Home | NH RC SNF | Russellville (West 12Th Street) | 107
Facility
107
AR AVG
84
Rank
#104 / 329 |
76.6%
Facility
76.6%
AR AVG
65.7
Rank
#58 / 165 | +17% | 6.10
Facility
6.10
AR AVG
4.67
Rank
#11 / 184 | -52% | +31% | $0
Facility
$0
AR AVG
$27.3k
Rank
#1 / 189 | 17
Facility
17
AR AVG
21.8
Rank
#59 / 188 | 4.3
Facility
4.3
AR AVG
5.3
Rank
#58 / 188 | - | 82 | A+ |
24
Facility
24
AR AVG
34
Rank
#266 / 416 | Ginger Dixon | $9.5MFiscal year ending 12/2023
Facility
$9.5MFiscal year ending 12/2023
AR AVG
$9.4M
Rank
#75 / 184 | $4.6MFiscal year ending 12/2023
Facility
$4.6MFiscal year ending 12/2023
AR AVG
$3.4M
Rank
#62 / 184 | 48.4%Fiscal year ending 12/2023
Facility
48.4%Fiscal year ending 12/2023
AR AVG
37.9%
Rank
#59 / 184 | 45410 | ||||
| Shiloh Health and Rehab | NH RC SNF | Springdale (Bethel Heights) | 140
Facility
140
AR AVG
84
Rank
#18 / 329 |
49.3%
Facility
49.3%
AR AVG
65.7
Rank
#135 / 165 | -25% | 4.23
Facility
4.23
AR AVG
4.67
Rank
#144 / 184 | -60% | -9% | $0
Facility
$0
AR AVG
$27.3k
Rank
#1 / 189 | 14
Facility
14
AR AVG
21.8
Rank
#37 / 188 | 4.7
Facility
4.7
AR AVG
5.3
Rank
#76 / 188 | - | 69 | - |
23
Facility
23
AR AVG
34
Rank
#271 / 416 | Denny Ledford | $7.6MFiscal year ending 12/2023
Facility
$7.6MFiscal year ending 12/2023
AR AVG
$9.4M
Rank
#116 / 184 | $4.0MFiscal year ending 12/2023
Facility
$4.0MFiscal year ending 12/2023
AR AVG
$3.4M
Rank
#95 / 184 | 52.1%Fiscal year ending 12/2023
Facility
52.1%Fiscal year ending 12/2023
AR AVG
37.9%
Rank
#40 / 184 | 45427 | ||||
| Wood-Lawn Heights | NH AL IL PC SNF | Batesville (College Heights Addition) | 159
Facility
159
AR AVG
84
Rank
#6 / 329 |
64.8%
Facility
64.8%
AR AVG
65.7
Rank
#95 / 165 | -1% | 4.66
Facility
4.66
AR AVG
4.67
Rank
#73 / 184 | +72% | 0% | $12.7k
Facility
$12.7k
AR AVG
$27.3k
Rank
#154 / 189 | 13
Facility
13
AR AVG
21.8
Rank
#33 / 188 | 4.3
Facility
4.3
AR AVG
5.3
Rank
#58 / 188 | 2 | 103 | - |
34
Facility
34
AR AVG
34
Rank
#202 / 416 | Laurie Herron | $12.7MFiscal year ending 06/2024
Facility
$12.7MFiscal year ending 06/2024
AR AVG
$9.4M
Rank
#35 / 184 | $6.2MFiscal year ending 06/2024
Facility
$6.2MFiscal year ending 06/2024
AR AVG
$3.4M
Rank
#31 / 184 | 49%Fiscal year ending 06/2024
Facility
49%Fiscal year ending 06/2024
AR AVG
37.9%
Rank
#74 / 184 | 45317 | ||||
| Indian Rock Village | NH | Fairfield Bay | 55
Facility
55
AR AVG
84
Rank
#241 / 329 |
65.5%
Facility
65.5%
AR AVG
65.7
Rank
#91 / 165 | 0% | 4.56
Facility
4.56
AR AVG
4.67
Rank
#83 / 184 | +149% | -2% | $0
Facility
$0
AR AVG
$27.3k
Rank
#1 / 189 | 9
Facility
9
AR AVG
21.8
Rank
#8 / 188 | 3.0
Facility
3.0
AR AVG
5.3
Rank
#13 / 188 | - | 36 | - |
11
Facility
11
AR AVG
34
Rank
#332 / 416 | Edward Holman | $3.9MFiscal year ending 06/2024
Facility
$3.9MFiscal year ending 06/2024
AR AVG
$9.4M
Rank
#175 / 184 | $2.5MFiscal year ending 06/2024
Facility
$2.5MFiscal year ending 06/2024
AR AVG
$3.4M
Rank
#167 / 184 | 63.2%Fiscal year ending 06/2024
Facility
63.2%Fiscal year ending 06/2024
AR AVG
37.9%
Rank
#19 / 184 | 45153 |
Indian Rock Village has a walk score of 11. Car-dependent. Most errands require a car, with limited nearby walkable options.
Indian Rock Village's occupancy is 49.9%.
No, Indian Rock Village has a no-pet policy.
Indian Rock Village is registered as a for-profit in AR.
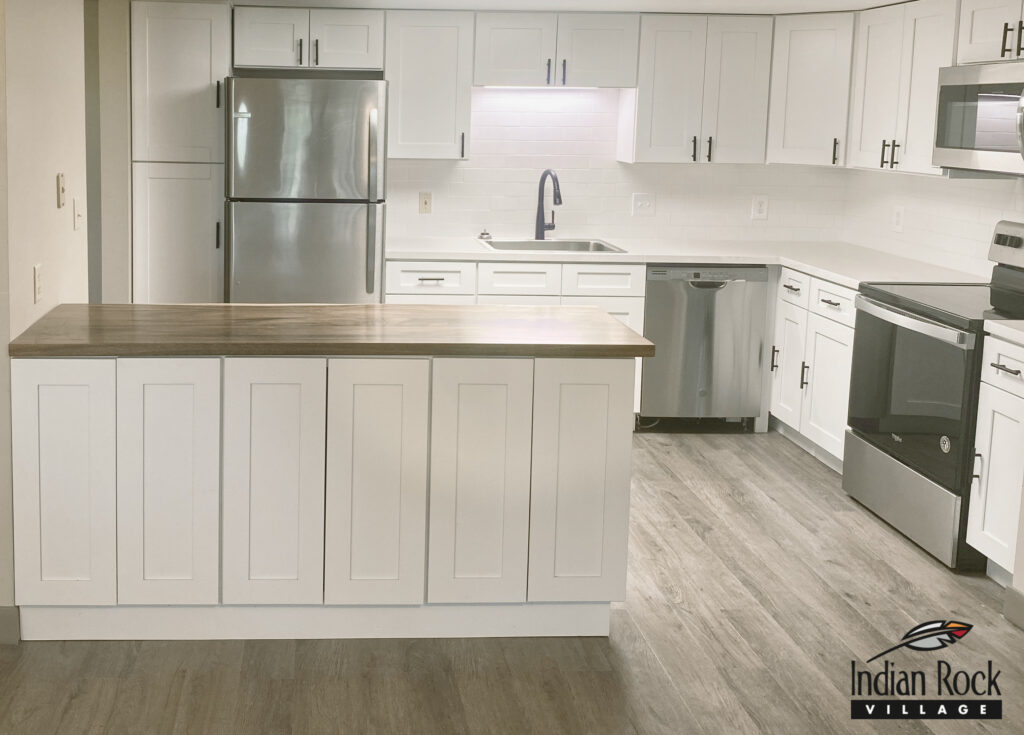
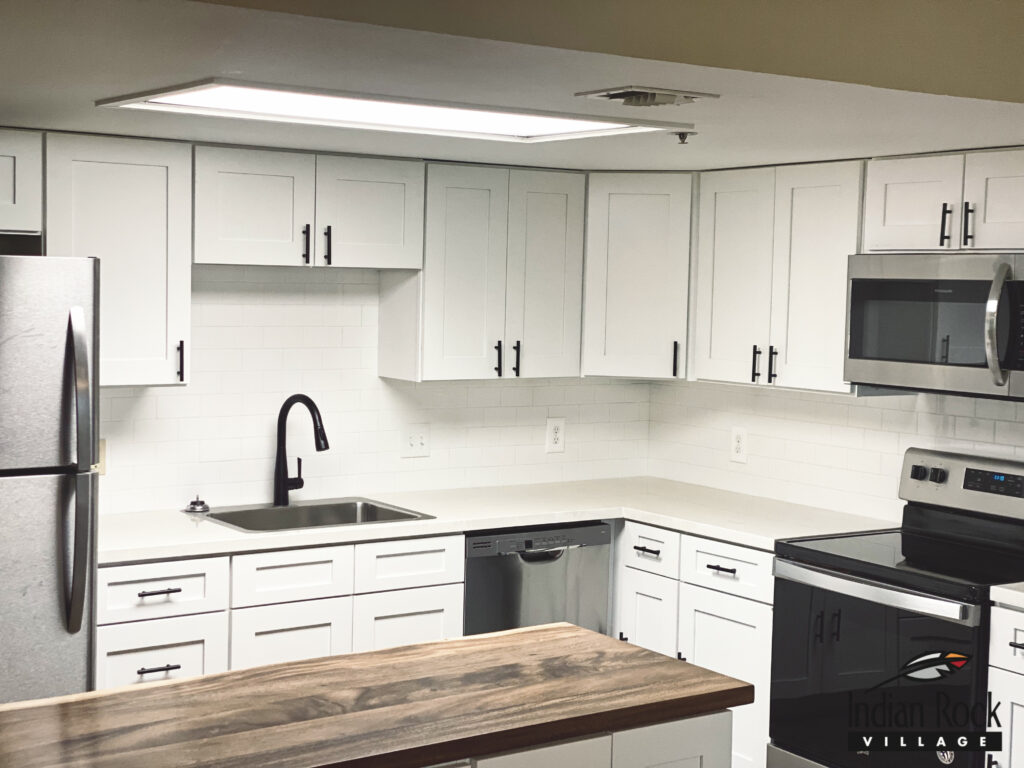
Yes — there are 4 photos of Indian Rock Village in the photo gallery on this page.
Indian Rock Village is located at 265 Dave Creek Pkwy, Fairfield Bay, AR 72088.
(540) 983-9275 will put you in contact with the team at Indian Rock Village.
Care Cost Calculator: See Prices in Your Area
Nursing Home Data Explorer
Don’t Wait Too Long: 7 Red Flag Signs Your Parent Needs Assisted Living Now
The True Cost of Assisted Living in 2025 – And How Families Are Paying For It
Understanding Senior Living Costs: Pricing Models, Discounts & Financial Assistance


