Pioneer Therapy and Living
Nursing Home, Memory Care, Respite Care & Skilled Nursing · Melbourne, AR
CMS overall rating Info CMS (the Centers for Medicare & Medicaid Services) is the federal agency that rates nursing home quality. Its Overall Rating runs from 1 to 5 stars, combining health inspections, staffing, and quality measures, with inspections weighted most heavily.

Pioneer Therapy and Living

Nursing Home, Memory Care, Respite Care & Skilled Nursing · Melbourne, AR
CMS overall rating Info CMS (the Centers for Medicare & Medicaid Services) is the federal agency that rates nursing home quality. Its Overall Rating runs from 1 to 5 stars, combining health inspections, staffing, and quality measures, with inspections weighted most heavily.
Calculator: See prices in your area
Pioneer Therapy and Living accepts Medicare, Medicaid, and private pay.

Overview of Pioneer Therapy and Living

Jody Kever owns Pioneer Therapy and Living, an 86-bed nursing home on East Main Street in Melbourne, Arkansas, which is operated by MLBNC, Inc. The facility stays busy with an occupancy rate near 88 percent, and residents stay here for an average of 232 days. This timeline shows that the daily operation divides its workload between long-term residential stays and short-term post-hospital recovery. To manage the financial side of care, the front office bills through traditional Medicare, state Medicaid, and standard private pay.

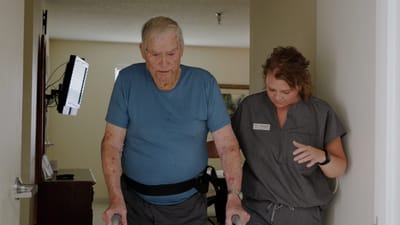
Daily life revolves around a 24-hour nursing team that logs about 4 hours and 37 minutes of direct, hands-on attention per resident every day. This crew handles everyday clinical oversight, temporary respite stays, and physical rehab, while a certified dietary manager runs the kitchen to accommodate personal food choices and allergies. The building sits in an area with a 42 walk score, so while a few nearby spots are reachable on foot, visiting families will generally need a car to get around town.

Families researching local care options can go over the building’s recent state inspection reports with the front office, which flagged specific compliance issues regarding environmental sanitation, hygiene practices, infection control, medication management, and wound care protocols.

Reviewing these reports with the staff is a practical way to find out what safeguards are currently in place to protect residents. If you are satisfied with their safety protocols, the administrative team can then help you check on current room openings or explain the necessary intake steps.

Quality ratings

Measured by Centers for Medicare & Medicaid Services (CMS)

Overall rating Info The Overall CMS Rating combines results from health inspections, staffing levels and quality measures. Health inspections carry the most weight. Staffing and quality scores can increase or decrease the final rating based on performance compared to state and national standards.
Health Inspection Info Based on the results of the facility's three most recent standard inspections and any complaint investigations. CMS reviews the number, scope, and severity of deficiencies, with more recent findings weighted more heavily.
Staffing Info Measures average nursing staff hours per resident per day, including Registered Nurses (RNs) and total nursing staff. Ratings are adjusted based on the level of care residents require and are compared to state and national benchmarks.
Quality Measures Info Based on clinical and physical health indicators reported to CMS, such as hospital readmissions, falls, pressure ulcers, and improvements in mobility. These measures reflect how well residents' health needs are being managed.

Staffing hours breakdown

Info Daily nursing hours per resident by staff type, reported to CMS. Higher is generally better — compare this facility to state and national averages to see where staffing stands.

Hours per resident per day — compared to state averages

Total nursing care / resident Info Total adjusted nursing hours per resident per day, combining RN, LPN, and aide time. CMS adjusts this for case-mix so facilities can be fairly compared.
4h 37m per day
vs avg

6 of 6 metrics below state avg

Staff typeHours / Day / Residentvs state avg
Registered Nurse (RN) Info RNs hold the highest nursing license and can assess residents, interpret test results, and direct care plans. More RN hours per day often signals stronger clinical oversight and faster response to health changes. 14m per day ▼ 41% State avg: 24m per day · National avg: 41m per day
LPN / LVN Info Licensed Practical Nurses (LPNs) or Licensed Vocational Nurses (LVNs) deliver routine hands-on care — medication administration, wound dressing, and monitoring vital signs. They work under RN supervision and make up a large share of daily bedside care. 55m per day ▼ 3% State avg: 57m per day · National avg: 52m per day
Nurse Aide Info Certified Nurse Aides (CNAs) provide the most direct day-to-day assistance: bathing, dressing, feeding, and mobility. Nurse aide hours are typically the largest staffing category and directly affect residents' quality of life. 2h 28m per day ▼ 9% State avg: 2h 43m per day · National avg: 2h 20m per day
Weekend Total Nursing Info Combined nursing hours (RN + LPN + Nurse Aide) per resident per day on weekends. Staffing often drops on weekends — this figure reveals whether the facility maintains adequate coverage outside of weekday hours. 2h 46m per day ▼ 21% State avg: 3h 29m per day · National avg: 3h 26m per day
Physical Therapist Info Hours per resident per day provided by licensed Physical Therapists (PTs) or PT Assistants. PT services help residents recover mobility after injury or illness and are especially important for post-acute (short-stay) rehabilitation. 0m per day ▼ 84% State avg: 2m per day · National avg: 4m per day
Weekend RN Info Registered nurse hours specifically on weekends. Facilities sometimes reduce RN presence on Saturdays and Sundays — a low weekend RN figure compared to weekday hours can indicate reduced clinical oversight when most administrative staff are absent. 10m per day ▼ 38% State avg: 16m per day · National avg: 28m per day

Capacity and availability

Avg. Length of Stay Info Average number of days residents stay at this facility, based on CMS cost report data. Shorter stays often reflect post-acute or rehab care; longer stays reflect long-term care.
232 days
Bed community size
86-bed community Rank #168 / 330Bed count — State benchmarkedThis home is ranked 168th out of 330 homes in Arkansas. Shows this facility's certified or reported bed count compared to other Arkansas facilities. Larger communities may offer more amenities, programs, and on-site services for residents and families.Rankings are based only on facilities in Arkansas that report data for that category. Facilities without available data are excluded from the ranking.Click the rank badge to see the full State ranking.Click here to see the full State ranking.
A larger shared setting that may offer more common spaces and organized community services.
Walk Score
Walk Score: 42 / 100 Rank #150 / 419Walk Score — State benchmarkedThis home is ranked 150th out of 419 homes in Arkansas. Shows how walkable this facility's neighborhood is compared to the average Walk Score across Arkansas facilities. Higher scores benefit residents, families, and staff.Rankings are based only on facilities in Arkansas that report data for that category. Facilities without available data are excluded from the ranking.Click the rank badge to see the full State ranking.Click here to see the full State ranking.
Somewhat walkable. A few nearby services may be reachable on foot, but most trips require transportation.

About this community

Occupancy

Occupancy rate
88%
Higher than the Arkansas average: 71.3%
Occupied beds
76 / 86
Average occupied beds in Arkansas homes 77 beds

License Details

Facility TypeSkillied Nursing Facility With Dual Certified Beds (medicaid/medicare)
CountyIzard
CMS Certification Number045322
Certification TypeMedicaid / Medicare

Ownership & Operating Entity

Pioneer Therapy and Living is legally operated by MLBNC, Inc., and administered by Jody Kever.

Owner NameMlbnc, Inc
Profit StatusFor-profit

Type Of Units

Medicaid and Medicare
86 units
Total beds
86 units

Therapy & Rehabilitation

2 services
Rehabilitation Services
Respite Care

Staffing & Medical

1 service
24-Hour Staffing

Contact Information

Fax870-368-5071

Amenities & Lifestyle

24/7 Nursing Care
Personalized Rehabilitation Programs
Nutritious Meals
Engaging Social And Recreational Activities
Activities
Specific ProgramsShort-Term Rehab, Additional Services

Contact Pioneer Therapy and Living

Inspection History

In Arkansas, the Department of Human Services, Office of Long Term Care is authorized to conduct unannounced inspections and issue official quality of care reports for all senior living providers.

Since 2022 · 4 years of data 15 deficiencies

Inspection Scorecard Info This scorecard compares key inspection, deficiency, and complaint metrics at this facility against the Arkansas state average. Metrics rated ≥15% worse than average are highlighted in red; those ≥15% better are highlighted in green.

Since 2022 vs. Arkansas state average
Overall vs. AR average 0 Worse No metrics in this bucket. 2 Better Metrics better than Arkansas average:
• Total deficiencies (29% below)
• Deficiencies per year (28% below)
Latest Inspection October 31, 2024 Routine

Deficiencies Info Deficiencies are formal regulatory issues recorded during state inspections.

This FacilityAR Averagevs. AR Avg
Total deficiencies Info Formal regulatory issues recorded by inspectors across all inspection types. 1521 This facility has 29% fewer total deficiencies than a typical Arkansas assisted living residence (15 vs. AR avg 21).↓ 29% better
Deficiencies per year Info Average deficiencies per year since 2022. 3.85.3 This facility has 28% fewer deficiencies per year than a typical Arkansas assisted living residence (3.8 vs. AR avg 5.3).↓ 28% better

Inspection Reports Summary Info An editor-reviewed summary of the themes and findings across this facility's recent inspection reports.

  • October 31, 2024 inspection found two deficiencies for failing to revise a dementia care plan and improper hand hygiene during food preparation.
  • October 26, 2023 annual survey identified eight deficiencies including medication errors, wound care failures, infection control lapses, poor hygiene, and roach infestations in resident areas.
  • August 4, 2022 inspection cited five deficiencies with pest control failures, cross-contamination risks in laundry, and inadequate pressure ulcer care including one harm-level citation.

Health Inspection History

Inspections since 2022
Total health inspections 3

State average N/A


Last Health inspection on Oct 2024

Total health citations
15

State average N/A

Citations per inspection
5

State average N/A


Health citations are formal notices following inspections when they fail to comply with safety and care standards.

All 15 citations resulted from standard inspections.

Breakdown of citation severity (last 4 years)
Critical health citations
0
In line with State average

State average: N/A


Serious health citations
0
In line with State average

State average: N/A

0 critical citations State average: N/A

0 serious citations State average: N/A

14 moderate citations State average: N/A

1 minor citation State average: N/A
Citations history (last 4 years)
Nutrition moderate citation Oct 31, 2024
Corrected

Care Planning moderate citation Oct 31, 2024
Corrected

Administration moderate citation Oct 26, 2023
Corrected

Environmental moderate citation Oct 26, 2023
Corrected

Staffing Data

Reporting period: October 1 – December 31, 2025 (Q4 2025). Source: CMS Payroll-Based Journal report.

Total staff 93
Employees 70
Contractors 23
Staff to resident ratio 1.22 : 1
0% compared with State average

State average ratio: 0 : 0

Avg staff/day 37
Average shift 7.4 hours
0% compared with State average

State average: 0 hours

Total staff hours (quarter) 25,179

Nursing staff breakdown

Q4 2025 · Oct 1 – Dec 31 More info This data comes from the CMS Payroll-Based Journal report covering October 1 – December 31, 2025.
Registered Nurse

Manages medical care and health needs.

RN Staff Info All 2 RN Staff are full-time employees. No contractors work on this role. 2
Average shift length Info Average shift length. Calculated as total hours divided by days worked and average staff per day. 9.1 hours
Licensed Practical Nurse

Assists with medical care and medications.

LPN Staff Info All 11 LPN Staff are full-time employees. No contractors work on this role. 11
Average shift length Info Average shift length. Calculated as total hours divided by days worked and average staff per day. 8 hours
Certified Nursing Assistant

Helps with daily care and mobility.

CNA Staff Info All 28 CNA Staff are full-time employees. No contractors work on this role. 28
Average shift length Info Average shift length. Calculated as total hours divided by days worked and average staff per day. 7.6 hours

Contractor staffing

Q4 2025 · Oct 1 – Dec 31 More info This data comes from the CMS Payroll-Based Journal report covering October 1 – December 31, 2025.

Total hours from contractors

3.2%

811 contractor hours this quarter

Speech Language Pathologist: 5 Physical Therapy Aide: 4 Respiratory Therapy Technician: 4 Physical Therapy Assistant: 4 Clinical Nurse Specialist: 3 Qualified Social Worker: 3

Staff by category

Q4 2025 · Oct 1 – Dec 31 More info This data comes from the CMS Payroll-Based Journal report covering October 1 – December 31, 2025.
Certified Nursing Assistant2802811,18592100%7.6
Licensed Practical Nurse110114,84392100%8
Nurse Aide in Training170172,5848997%7.2
Medication Aide/Technician5051,94392100%8.1
RN Director of Nursing2021,0006672%8
Clinical Nurse Specialist1346226065%6.2
Other Dietary Services Staff1015126470%8
Nurse Practitioner1015126470%8
Mental Health Service Worker1014886368%7.7
Administrator1014806065%8
Registered Nurse2023573437%9.1
Physical Therapy Aide0443116672%4.6
Speech Language Pathologist0551976267%2.7
Qualified Social Worker033812224%3.7
Respiratory Therapy Technician044332123%1.6
Physical Therapy Assistant044322224%1.3
28 Certified Nursing Assistant
% of Days 100%
11 Licensed Practical Nurse
% of Days 100%
17 Nurse Aide in Training
% of Days 97%
5 Medication Aide/Technician
% of Days 100%
2 RN Director of Nursing
% of Days 72%
4 Clinical Nurse Specialist
% of Days 65%
1 Other Dietary Services Staff
% of Days 70%
1 Nurse Practitioner
% of Days 70%
1 Mental Health Service Worker
% of Days 68%
1 Administrator
% of Days 65%
2 Registered Nurse
% of Days 37%
4 Physical Therapy Aide
% of Days 72%
5 Speech Language Pathologist
% of Days 67%
3 Qualified Social Worker
% of Days 24%
4 Respiratory Therapy Technician
% of Days 23%
4 Physical Therapy Assistant
% of Days 24%

Penalties and fines

Federal penalties imposed by CMS for regulatory violations, including civil money penalties (fines) and denials of payment for new Medicare/Medicaid admissions.

Source: CMS Penalties Database

No penalties in the past 3 years

No civil money penalties or payment denials were reported in the last 3 years.

Quality of care over time

These measures show how residents usually do over time at this home, based on health outcomes and preventive care.

High-risk clinical events score Info A composite score based on pressure ulcers, falls with injury, weight loss, walking ability decline, and activities of daily living decline. 4.9
36% better than State average

State average: 7.7

Functional decline score Info A composite score based on activities of daily living decline, walking ability decline, and incontinence. 6.6
51% better than State average

State average: 13.3

Long-stay resident measures
Significantly above average State avg: 4.2 Info CMS star rating based on long-stay quality measure performance. 5 stars = significantly above average, 1 star = significantly below average.
Need for Help with Daily Activities Increased Info Percent of long-stay residents whose need for help with daily activities has increased 6.7%
42% better than State average

State average: 11.5%

Walking Ability Worsened Info Percent of long-stay residents whose ability to move independently worsened 7.9%
41% better than State average

State average: 13.4%

Low Risk Residents with Bowel/Bladder Incontinence Info Percent of low risk long-stay residents who lose control of their bowels or bladder 5.1%
66% better than State average

State average: 15.1%

Falls with Major Injury Info Percent of long-stay residents experiencing one or more falls with major injury 5.2%
32% worse than State average

State average: 3.9%

High Risk Residents with Pressure Ulcers Info Percent of long-stay high risk residents with pressure ulcers 2.8%
42% better than State average

State average: 4.7%

Urinary Tract Infection Info Percent of long-stay residents with a urinary tract infection 0.0%
100% better than State average

State average: 1.3%

Lost Too Much Weight Info Percent of long-stay residents who lose too much weight 2.0%
61% better than State average

State average: 5.0%

Depressive Symptoms Info Percent of long-stay residents who have depressive symptoms 0.0%
100% better than State average

State average: 1.5%

Antipsychotic Use Info Percent of long-stay residents who received an antipsychotic medication 4.4%
58% better than State average

State average: 10.5%

Pneumococcal Vaccine Info Percent of long-stay residents assessed and appropriately given the pneumococcal vaccine 100.0%
6% better than State average

State average: 94.4%

Influenza Vaccine Info Percent of long-stay residents assessed and appropriately given the seasonal influenza vaccine 98.6%
In line with State average

State average: 96.2%

Hospitalizations per 1,000 days Info Number of hospitalizations per 1,000 long-stay resident days. 0.86
56% better than State average

State average: 1.97

ED visits per 1,000 days Info Number of outpatient emergency department visits per 1,000 long-stay resident days. 0.47
78% better than State average

State average: 2.18

Short-stay resident measures
Above average State avg: 2.7 Info CMS star rating based on short-stay quality measure performance. 5 stars = much above average, 1 star = much below average.
Pneumococcal Vaccine Info Percent of short-stay residents assessed and appropriately given the pneumococcal vaccine 96.1%
19% better than State average

State average: 80.9%

Antipsychotic medication increase Info Percent of short-stay residents who newly received an antipsychotic medication 0.0%
100% better than State average

State average: 1.5%

Influenza Vaccine Info Percent of short-stay residents assessed and appropriately given the seasonal influenza vaccine 100.0%
29% better than State average

State average: 77.7%

Re-hospitalized after SNF stay Info Percentage of short-stay residents who were re-hospitalized after their nursing home admission. 18.7%
26% better than State average

State average: 25.2%

Emergency department visits Info Percentage of short-stay residents who had an outpatient emergency department visit. 8.8%
36% better than State average

State average: 13.8%

Falls with major injury Info Percentage of SNF residents who experience falls with major injury during their stay. 0.0%
100% better than State average

State average: 0.8%

Ability to care for self at discharge Info Percentage of residents at or above expected ability to care for themselves at discharge. 65.0%
21% better than State average

State average: 53.7%

Successful return to home or community Info Rate of successful return to home or community from a skilled nursing facility. 46.8%
8% worse than State average

State average: 50.6%

Breakdown by payment type

Medicare

32% of new residents, usually for short-term rehab.

Typical stay 1 - 2 months

Private pay

58% of new residents, often for short stays.

Typical stay 1 - 2 months

Medicaid

10% of new residents, often for long-term daily care.

Typical stay 5 - 6 years

Facility Characteristics

Source: CMS Long-Term Care Facility Characteristics (Data as of Jan 2026)

Total residents 76
Medicare
5
6.6% of residents
Medicaid
63
82.9% of residents
Private pay or other
8
10.5% of residents
Programs & Services
Residents Group

Residents meet regularly to discuss policies, care quality, and activities

Nurse Aide Training

State-approved Nurse Aide Training and Competency Evaluation Program on-site

Active Resident Council

Organized group of residents that meets regularly to discuss facility policies, quality of life, and activities.

Finances and operations

Based on CMS SNF Cost Report for fiscal year ending in 12/2023.

For-profit
Individual
Net patient revenue Info Net patient revenue — what the home actually collects for resident care, after contractual allowances, bad debt and discounts are subtracted from its gross charges (CMS cost report, Worksheet G-3). It covers resident care only; money the home earns from other sources is shown separately as "Other income."
$7.6M
Net patient income Info Net patient income: net patient revenue minus the home's total operating expenses. A positive figure means it earns more from resident care than it spends to deliver it; a negative figure means the opposite. It excludes non-operating "other income."
$1.4M
For-profit Individual
Net patient revenue Info Net patient revenue — what the home actually collects for resident care, after contractual allowances, bad debt and discounts are subtracted from its gross charges (CMS cost report, Worksheet G-3). It covers resident care only; money the home earns from other sources is shown separately as "Other income."
$7.6M
Net patient income Info Net patient income: net patient revenue minus the home's total operating expenses. A positive figure means it earns more from resident care than it spends to deliver it; a negative figure means the opposite. It excludes non-operating "other income."
$1.4M
Other income Info Money the home earns outside of resident care — such as investments, grants, rentals and other non-operating sources (CMS cost report, Worksheet G-3). It is tracked separately from net patient revenue: it is not part of that figure, and it is not included in net patient income.
$12.8K
Payroll costs Info Staff salaries plus wage-related costs — benefits such as payroll taxes, health insurance and retirement — from the home's own accounting records (CMS cost report, Worksheet A). Contract or agency labor is counted separately, under other operating costs.
$3.2M 41.3% of net patient revenue Info Payroll as a share of revenue: staff salaries and wage-related benefits divided by net patient revenue. A higher figure means more of each revenue dollar goes to staff pay.
Other operating costs Info Everything it costs to run the home apart from payroll — food, utilities, supplies, maintenance, contract labor and administration. Calculated as total operating expense minus payroll (staff salaries and wage-related benefits).
$3.1M
Total costs Info The home's total operating expense for the year — all the costs of running it, salaries included (CMS cost report, Worksheet G-3).
$6.2M

Who this home usually serves

TYPE OF STAY

Mix of rehab and long-term care

This home supports both short-term rehab and long-term care, with residents staying for a wide range of durations.

Most new residents arrive under private pay (58% of admissions), and a typical private pay stay runs around 1 - 2 months.

Admissions
105 total

Coverage residents most often arrive under.

Medicare 32%
Private pay 58%
Medicaid 10%
Discharges
117 total

Coverage residents most often leave under.
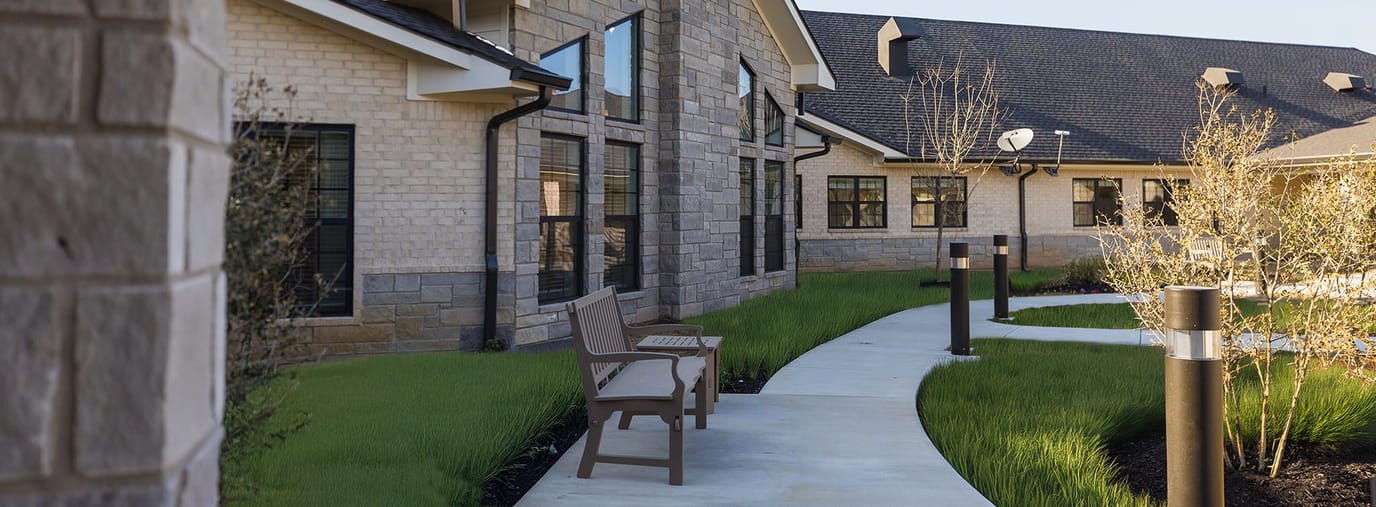
Medicare 35%
Private pay 53%
Medicaid 12%

Places of interest near Pioneer Therapy and Living

Address 1506 East Main Street, Melbourne, AR 72556

Calculate Travel Distance to Pioneer Therapy and Living

Add your location

Address

Compare Nursing Homes around the area

The information below is reported by the Arkansas Department of Human Services, Office of Long Term Care.

Indian Rock Village
NH
Fairfield Bay -55 - 11 Studio / 1 Bed / 2 Bed
Bear Creek Healthcare LLC
NH
De Queen -131 - 35 -
Pioneer Therapy and Living
NH
MC
RC
SNF
Melbourne -86 - 42 -
Heartland Rehabilitation and Care Center
NH
RC
SNF
Benton -119 A+ 0 -
Barnes Healthcare
NH
MC
Lonoke -141 A+ 38 Private / Shared Rooms

Frequently Asked Questions about Pioneer Therapy and Living

Who is the owner of Pioneer Therapy and Living?

Pioneer Therapy and Living is legally operated by MLBNC, Inc., and administered by Jody Kever.

Is Pioneer Therapy and Living in a walkable area?

Pioneer Therapy and Living has a walk score of 42. Somewhat walkable. A few nearby services may be reachable on foot, but most trips require transportation.

What is the occupancy rate at Pioneer Therapy and Living?

Pioneer Therapy and Living's occupancy is 88%.

Does Pioneer Therapy and Living operate as a for-profit or non-profit?

Pioneer Therapy and Living is registered as a for-profit in AR.

Who is the administrator of Pioneer Therapy and Living?

Jody Kever is the administrator of Pioneer Therapy and Living.

How many beds does Pioneer Therapy and Living have?

Pioneer Therapy and Living has 86 beds.

Are there photos of Pioneer Therapy and Living?

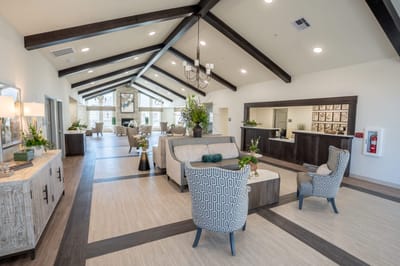
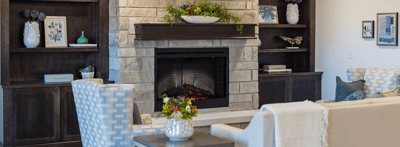
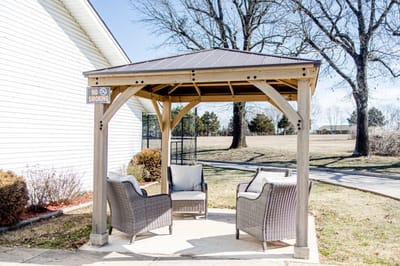
Yes — there are 7 photos of Pioneer Therapy and Living in the photo gallery on this page.

Guides for Better Senior Living

Care Cost Calculator: See Prices in Your Area

Nursing Home Data Explorer

Don’t Wait Too Long: 7 Red Flag Signs Your Parent Needs Assisted Living Now

The True Cost of Assisted Living in 2025 – And How Families Are Paying For It

Understanding Senior Living Costs: Pricing Models, Discounts & Financial Assistance