Schowalter Villa
Nursing Home, Home Care & Independent Living · Hesston, KS
CMS overall rating Info CMS (the Centers for Medicare & Medicaid Services) is the federal agency that rates nursing home quality. Its Overall Rating runs from 1 to 5 stars, combining health inspections, staffing, and quality measures, with inspections weighted most heavily.

Schowalter Villa

Nursing Home, Home Care & Independent Living · Hesston, KS
CMS overall rating Info CMS (the Centers for Medicare & Medicaid Services) is the federal agency that rates nursing home quality. Its Overall Rating runs from 1 to 5 stars, combining health inspections, staffing, and quality measures, with inspections weighted most heavily.
Calculator: See prices in your area
Schowalter Villa accepts Medicare, Medicaid, and private pay.

Overview of Schowalter Villa

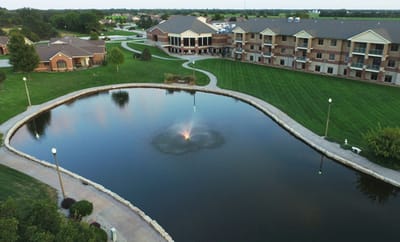
Bluestem Communities, a non-profit organization rooted in Mennonite healthcare values, operates Schowalter Villa in Hesston, Kansas. Established in 1961, this senior campus combines independent living, assisted living, memory care, short-term rehabilitation, and traditional nursing home services. The business office routes regular accounts through private pay, Medicare, and Medicaid. Located in a moderately walkable neighborhood, the campus allows some local errands on foot, though most visitors rely on a car.

State data reveals a 61 percent occupancy rate, with 95 of the 155 licensed beds currently occupied. Residents stay for an average of 159 days, showing a standard balance between temporary post-surgical recovery and long-term residential placements. To cover daily medical needs, the 24-hour care team provides an average of 5 hours and 57 minutes of direct nursing care per resident every single day, which includes 44 minutes from registered nurses, 38 minutes from licensed practical nurses, and 44 minutes from nurse aides.

This clinical framework is supported by a wellness center, dementia tracks, and creative arts programming, while recent regulatory inspections resulted in zero deficiencies.

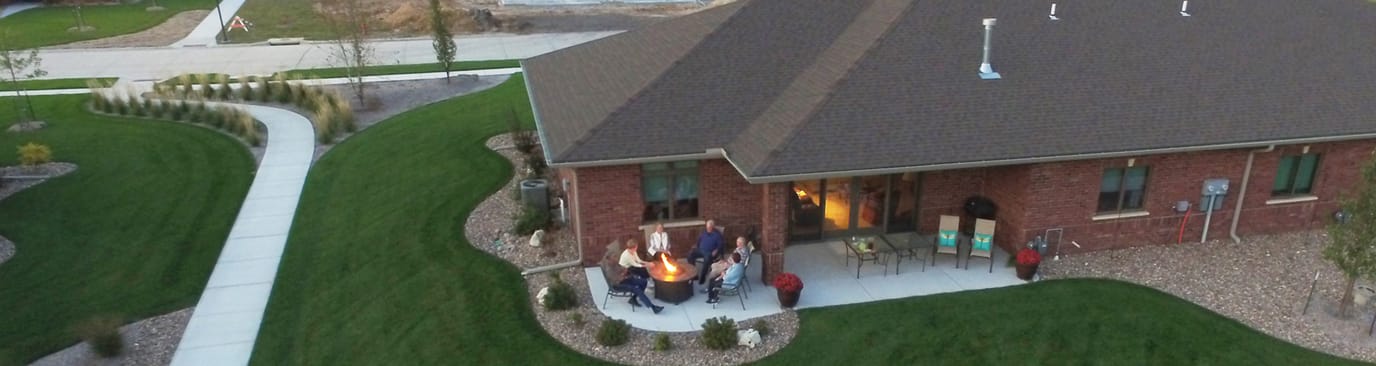
Prospective representatives can contact the admissions office to coordinate an in-person tour of the campus and look over the Tallgrass Dining setups, where the culinary team prepares three meals daily. The administrative staff answers questions about independent or assisted living vacancies, transportation assistance for off-site appointments, and the schedule for intergenerational or volunteer activities.

Quality ratings

Measured by Centers for Medicare & Medicaid Services (CMS)

Overall rating Info The Overall CMS Rating combines results from health inspections, staffing levels and quality measures. Health inspections carry the most weight. Staffing and quality scores can increase or decrease the final rating based on performance compared to state and national standards.
Health Inspection Info Based on the results of the facility's three most recent standard inspections and any complaint investigations. CMS reviews the number, scope, and severity of deficiencies, with more recent findings weighted more heavily.
Staffing Info Measures average nursing staff hours per resident per day, including Registered Nurses (RNs) and total nursing staff. Ratings are adjusted based on the level of care residents require and are compared to state and national benchmarks.
Quality Measures Info Based on clinical and physical health indicators reported to CMS, such as hospital readmissions, falls, pressure ulcers, and improvements in mobility. These measures reflect how well residents' health needs are being managed.

Staffing hours breakdown

Info Daily nursing hours per resident by staff type, reported to CMS. Higher is generally better — compare this facility to state and national averages to see where staffing stands.

Hours per resident per day — compared to state averages

Total nursing care / resident Info Total adjusted nursing hours per resident per day, combining RN, LPN, and aide time. CMS adjusts this for case-mix so facilities can be fairly compared.
5h 57m per day
vs avg

3 of 6 metrics below state avg

Standout metric Nurse Aide is +29% above state avg
Staff typeHours / Day / Residentvs state avg
Registered Nurse (RN) Info RNs hold the highest nursing license and can assess residents, interpret test results, and direct care plans. More RN hours per day often signals stronger clinical oversight and faster response to health changes. 44m per day ▲ 3% State avg: 43m per day · National avg: 41m per day
LPN / LVN Info Licensed Practical Nurses (LPNs) or Licensed Vocational Nurses (LVNs) deliver routine hands-on care — medication administration, wound dressing, and monitoring vital signs. They work under RN supervision and make up a large share of daily bedside care. 38m per day ▼ 4% State avg: 40m per day · National avg: 52m per day
Nurse Aide Info Certified Nurse Aides (CNAs) provide the most direct day-to-day assistance: bathing, dressing, feeding, and mobility. Nurse aide hours are typically the largest staffing category and directly affect residents' quality of life. 3h 28m per day ▲ 29% State avg: 2h 41m per day · National avg: 2h 20m per day
Weekend Total Nursing Info Combined nursing hours (RN + LPN + Nurse Aide) per resident per day on weekends. Staffing often drops on weekends — this figure reveals whether the facility maintains adequate coverage outside of weekday hours. 4h 28m per day ▲ 25% State avg: 3h 35m per day · National avg: 3h 26m per day
Physical Therapist Info Hours per resident per day provided by licensed Physical Therapists (PTs) or PT Assistants. PT services help residents recover mobility after injury or illness and are especially important for post-acute (short-stay) rehabilitation. 1m per day ▼ 72% State avg: 2m per day · National avg: 4m per day
Weekend RN Info Registered nurse hours specifically on weekends. Facilities sometimes reduce RN presence on Saturdays and Sundays — a low weekend RN figure compared to weekday hours can indicate reduced clinical oversight when most administrative staff are absent. 21m per day ▼ 29% State avg: 30m per day · National avg: 28m per day

Capacity and availability

Avg. Length of Stay
159 days
Bed community size
155-bed community Rank #7 / 224Bed count — State benchmarkedThis home is ranked 7th out of 224 homes in Kansas. Shows this facility's certified or reported bed count compared to other Kansas facilities. Larger communities may offer more amenities, programs, and on-site services for residents and families.Rankings are based only on facilities in Kansas that report data for that category. Facilities without available data are excluded from the ranking.Click the rank badge to see the full State ranking.Click here to see the full State ranking.
A large-scale community that may provide a wide range of amenities, services, and structured programs.
Walk Score
Walk Score: 55 / 100 Rank #132 / 363Walk Score — State benchmarkedThis home is ranked 132nd out of 363 homes in Kansas. Shows how walkable this facility's neighborhood is compared to the average Walk Score across Kansas facilities. Higher scores benefit residents, families, and staff.Rankings are based only on facilities in Kansas that report data for that category. Facilities without available data are excluded from the ranking.Click the rank badge to see the full State ranking.Click here to see the full State ranking.
Moderately walkable. Some errands can be accomplished on foot, with a mix of nearby amenities.

About this community

Occupancy

Occupancy rate
61%
Lower than the Kansas average: 79.5%
Occupied beds
95 / 155
Average occupied beds in Kansas homes 50 beds

License Details

Facility TypeNursing Facility | Assisted Living Facility
StatusActive
CountyHarvey
License Number175386
CMS Certification Number175386

Ownership & Operating Entity

Schowalter Villa is administered by Jeffrey Ritcha.

Owner NameMennonite Board Missions Char Of Ks Inc

Staffing

Key information about the people who lead and staff this community.

Leadership

ContactJames Krehbiel, CEO

Therapy & Rehabilitation

1 service
Rehabilitation Services

Staffing & Medical

1 service
Nursing Services

Amenities & Lifestyle

Wellness Center
Culinary Experiences
Transportation Services
Social Life Activities
Specific ProgramsHealth Care, Specialized Dementia Care, Short-Term Rehabilitation, Creative Arts, Intergen Connection, Volunteering
Religious Servicestransportation to area churches each Sunday morning at no cost

Contact Schowalter Villa

Inspection History

In Kansas, the Department for Aging and Disability Services, Survey and Certification Commission performs the unannounced inspections required for facility licensing and federal certification.

Since 2013 · 13 years of data 120 deficiencies

Inspection Scorecard Info This scorecard compares key inspection, deficiency, and complaint metrics at this facility against the Kansas state average. Metrics rated ≥15% worse than average are highlighted in red; those ≥15% better are highlighted in green.

Since 2013 vs. Kansas state average
Overall vs. KS average 2 Worse Metrics worse than Kansas average:
• Total deficiencies (20% above)
• Deficiencies per year (19% above)
0 Better No metrics in this bucket.
Latest Inspection June 24, 2025

Deficiencies Info Deficiencies are formal regulatory issues recorded during state inspections.

This FacilityKS Averagevs. KS Avg
Total deficiencies Info Formal regulatory issues recorded by inspectors across all inspection types. 120100 This facility has 20% more total deficiencies than a typical Kansas assisted living residence (120 vs. KS avg 100).↑ 20% worse
Deficiencies per year Info Average deficiencies per year since 2013. 9.27.7 This facility has 19% more deficiencies per year than a typical Kansas assisted living residence (9.2 vs. KS avg 7.7).↑ 19% worse

Inspection Reports Summary Info An editor-reviewed summary of the themes and findings across this facility's recent inspection reports.

  • The most recent inspection of Schowalter Villa on June 2, 2025, resulted in zero deficiencies. Earlier inspections showed a mixed record with several citations related primarily to resident care planning, medication management, and activity programming, particularly noted in a November 7, 2024 complaint investigation. Prior complaint investigations included substantiated issues with supervision and safety, including immediate jeopardy findings related to resident elopement in 2019 and 2021, but these were followed by corrective actions and subsequent compliance. Enforcement actions such as fines or license suspensions were not listed in the available reports. The facility appears to have made improvements over time, with recent inspections showing no deficiencies after addressing prior concerns.

Health Inspection History

Inspections since 2024
Total health inspections 1

State average N/A


Last Health inspection on Nov 2024

Total health citations
6

State average N/A

Citations per inspection
6

State average N/A


Health citations are formal notices following inspections when they fail to comply with safety and care standards.

6 of 6 came from combined inspections (standard and complaint).

Breakdown of citation severity (last 2 years)
Critical health citations
0
In line with State average

State average: N/A


Serious health citations
0
In line with State average

State average: N/A

0 critical citations State average: N/A

0 serious citations State average: N/A

6 moderate citations State average: N/A

0 minor citations State average: N/A
Citations history (last 2 years)
Administration moderate citation Nov 07, 2024
Corrected

Infection Control moderate citation Nov 07, 2024
Corrected

Pharmacy moderate citation Nov 07, 2024
Corrected

Pharmacy moderate citation Nov 07, 2024
Corrected

Staffing Data

Reporting period: October 1 – December 31, 2025 (Q4 2025). Source: CMS Payroll-Based Journal report.

Total staff 209
Employees 192
Contractors 17
Staff to resident ratio 2.20 : 1
0% compared with State average

State average ratio: 0 : 0

Avg staff/day 71
Average shift 7.3 hours
0% compared with State average

State average: 0 hours

Total staff hours (quarter) 47,806

Nursing staff breakdown

Q4 2025 · Oct 1 – Dec 31 More info This data comes from the CMS Payroll-Based Journal report covering October 1 – December 31, 2025.
Registered Nurse

Manages medical care and health needs.

RN Staff Info All 12 RN Staff are full-time employees. No contractors work on this role. 12
Average shift length Info Average shift length. Calculated as total hours divided by days worked and average staff per day. 11.1 hours
Licensed Practical Nurse

Assists with medical care and medications.

LPN Staff Info All 16 LPN Staff are full-time employees. No contractors work on this role. 16
Average shift length Info Average shift length. Calculated as total hours divided by days worked and average staff per day. 8.9 hours
Certified Nursing Assistant

Helps with daily care and mobility.

CNA Staff Info All 86 CNA Staff are full-time employees. No contractors work on this role. 86
Average shift length Info Average shift length. Calculated as total hours divided by days worked and average staff per day. 7 hours

Contractor staffing

Q4 2025 · Oct 1 – Dec 31 More info This data comes from the CMS Payroll-Based Journal report covering October 1 – December 31, 2025.

Total hours from contractors

1.8%

854 contractor hours this quarter

Qualified Social Worker: 5 Physical Therapy Aide: 3 Speech Language Pathologist: 3 Respiratory Therapy Technician: 3 Physical Therapy Assistant: 1 Occupational Therapy Assistant: 1 Medical Director: 1

Staff by category

Q4 2025 · Oct 1 – Dec 31 More info This data comes from the CMS Payroll-Based Journal report covering October 1 – December 31, 2025.
Certified Nursing Assistant8608617,92492100%7
Medication Aide/Technician5405412,95692100%7.6
Licensed Practical Nurse160165,37092100%8.9
Registered Nurse120123,83792100%11.1
Clinical Nurse Specialist7072,3788188%6.8
Other Dietary Services Staff100102,1969098%6.2
Mental Health Service Worker2029206470%8
Administrator1014245358%8
Nurse Practitioner1013764751%8
Speech Language Pathologist0333496571%5.3
RN Director of Nursing1013314650%7.2
Physical Therapy Aide0332216975%3.1
Occupational Therapy Aide1012012830%7.2
Qualified Social Worker0551134852%2.2
Respiratory Therapy Technician033834953%1.5
Physical Therapy Assistant011653740%1.8
Dietitian101401314%3.1
Occupational Therapy Assistant011231112%2.1
Medical Director011122%0.3
86 Certified Nursing Assistant
% of Days 100%
54 Medication Aide/Technician
% of Days 100%
16 Licensed Practical Nurse
% of Days 100%
12 Registered Nurse
% of Days 100%
7 Clinical Nurse Specialist
% of Days 88%
10 Other Dietary Services Staff
% of Days 98%
2 Mental Health Service Worker
% of Days 70%
1 Administrator
% of Days 58%
1 Nurse Practitioner
% of Days 51%
3 Speech Language Pathologist
% of Days 71%
1 RN Director of Nursing
% of Days 50%
3 Physical Therapy Aide
% of Days 75%
1 Occupational Therapy Aide
% of Days 30%
5 Qualified Social Worker
% of Days 52%
3 Respiratory Therapy Technician
% of Days 53%
1 Physical Therapy Assistant
% of Days 40%
1 Dietitian
% of Days 14%
1 Occupational Therapy Assistant
% of Days 12%
1 Medical Director
% of Days 2%

Penalties and fines

Federal penalties imposed by CMS for regulatory violations, including civil money penalties (fines) and denials of payment for new Medicare/Medicaid admissions.

Source: CMS Penalties Database

No penalties in the past 3 years

No civil money penalties or payment denials were reported in the last 3 years.

Quality of care over time

These measures show how residents usually do over time at this home, based on health outcomes and preventive care.

High-risk clinical events score Info A composite score based on pressure ulcers, falls with injury, weight loss, walking ability decline, and activities of daily living decline. 14.0
34% worse than State average

State average: 10.5

Functional decline score Info A composite score based on activities of daily living decline, walking ability decline, and incontinence. 27.7
34% worse than State average

State average: 20.7

Long-stay resident measures
Below average State avg: 3.0 Info CMS star rating based on long-stay quality measure performance. 5 stars = significantly above average, 1 star = significantly below average.
Need for Help with Daily Activities Increased Info Percent of long-stay residents whose need for help with daily activities has increased 31.4%
65% worse than State average

State average: 19.0%

Walking Ability Worsened Info Percent of long-stay residents whose ability to move independently worsened 23.6%
22% worse than State average

State average: 19.4%

Low Risk Residents with Bowel/Bladder Incontinence Info Percent of low risk long-stay residents who lose control of their bowels or bladder 28.2%
19% worse than State average

State average: 23.8%

Falls with Major Injury Info Percent of long-stay residents experiencing one or more falls with major injury 9.8%
123% worse than State average

State average: 4.4%

High Risk Residents with Pressure Ulcers Info Percent of long-stay high risk residents with pressure ulcers 0.0%
100% better than State average

State average: 4.6%

Urinary Tract Infection Info Percent of long-stay residents with a urinary tract infection 2.2%
29% better than State average

State average: 3.1%

Lost Too Much Weight Info Percent of long-stay residents who lose too much weight 5.3%
5% worse than State average

State average: 5.1%

Depressive Symptoms Info Percent of long-stay residents who have depressive symptoms 2.6%
50% better than State average

State average: 5.2%

Antipsychotic Use Info Percent of long-stay residents who received an antipsychotic medication 16.1%
5% better than State average

State average: 16.9%

Pneumococcal Vaccine Info Percent of long-stay residents assessed and appropriately given the pneumococcal vaccine 89.7%
In line with State average

State average: 91.9%

Influenza Vaccine Info Percent of long-stay residents assessed and appropriately given the seasonal influenza vaccine 94.0%
In line with State average

State average: 95.5%

Hospitalizations per 1,000 days Info Number of hospitalizations per 1,000 long-stay resident days. 1.16
37% better than State average

State average: 1.84

ED visits per 1,000 days Info Number of outpatient emergency department visits per 1,000 long-stay resident days. 1.28
41% better than State average

State average: 2.16

Short-stay resident measures
Average State avg: 2.6 Info CMS star rating based on short-stay quality measure performance. 5 stars = much above average, 1 star = much below average.
Pneumococcal Vaccine Info Percent of short-stay residents assessed and appropriately given the pneumococcal vaccine 68.6%
9% worse than State average

State average: 75.6%

Antipsychotic medication increase Info Percent of short-stay residents who newly received an antipsychotic medication 0.0%
100% better than State average

State average: 2.2%

Influenza Vaccine Info Percent of short-stay residents assessed and appropriately given the seasonal influenza vaccine 72.4%
In line with State average

State average: 73.5%

Re-hospitalized after SNF stay Info Percentage of short-stay residents who were re-hospitalized after their nursing home admission. 18.5%
20% better than State average

State average: 23.0%

Emergency department visits Info Percentage of short-stay residents who had an outpatient emergency department visit. 13.8%
18% worse than State average

State average: 11.7%

Falls with major injury Info Percentage of SNF residents who experience falls with major injury during their stay. 0.0%
100% better than State average

State average: 0.8%

Ability to care for self at discharge Info Percentage of residents at or above expected ability to care for themselves at discharge. 32.1%
40% worse than State average

State average: 53.7%

Successful return to home or community Info Rate of successful return to home or community from a skilled nursing facility. 39.2%
23% worse than State average

State average: 50.6%

Breakdown by payment type

Medicare

20% of new residents, usually for short-term rehab.

Typical stay 28 days

Private pay

56% of new residents, often for short stays.

Typical stay 4 - 5 months

Medicaid

23% of new residents, often for long-term daily care.

Typical stay 9 - 10 months

Facility Characteristics

Source: CMS Long-Term Care Facility Characteristics (Data as of Jan 2026)

Total residents 95
Medicare
1
1.1% of residents
Medicaid
46
48.4% of residents
Private pay or other
48
50.5% of residents
Programs & Services
Residents Group

Residents meet regularly to discuss policies, care quality, and activities

CCRC

Part of a Continuing Care Retirement Community offering multiple care levels

Active Resident Council

Organized group of residents that meets regularly to discuss facility policies, quality of life, and activities.

Finances and operations

Based on CMS SNF Cost Report for fiscal year ending in 12/2023.

Nonprofit
Nonprofit Corporation
Net patient revenue Info Net patient revenue — what the home actually collects for resident care, after contractual allowances, bad debt and discounts are subtracted from its gross charges (CMS cost report, Worksheet G-3). It covers resident care only; money the home earns from other sources is shown separately as "Other income."
$16.5M
Net patient income Info Net patient income: net patient revenue minus the home's total operating expenses. A positive figure means it earns more from resident care than it spends to deliver it; a negative figure means the opposite. It excludes non-operating "other income."
-$2.3M
Nonprofit Nonprofit Corporation
Net patient revenue Info Net patient revenue — what the home actually collects for resident care, after contractual allowances, bad debt and discounts are subtracted from its gross charges (CMS cost report, Worksheet G-3). It covers resident care only; money the home earns from other sources is shown separately as "Other income."
$16.5M
Net patient income Info Net patient income: net patient revenue minus the home's total operating expenses. A positive figure means it earns more from resident care than it spends to deliver it; a negative figure means the opposite. It excludes non-operating "other income."
-$2.3M
Other income Info Money the home earns outside of resident care — such as investments, grants, rentals and other non-operating sources (CMS cost report, Worksheet G-3). It is tracked separately from net patient revenue: it is not part of that figure, and it is not included in net patient income.
$2.9M
Payroll costs Info Staff salaries plus wage-related costs — benefits such as payroll taxes, health insurance and retirement — from the home's own accounting records (CMS cost report, Worksheet A). Contract or agency labor is counted separately, under other operating costs.
$10.7M 65% of net patient revenue Info Payroll as a share of revenue: staff salaries and wage-related benefits divided by net patient revenue. A higher figure means more of each revenue dollar goes to staff pay.
Other operating costs Info Everything it costs to run the home apart from payroll — food, utilities, supplies, maintenance, contract labor and administration. Calculated as total operating expense minus payroll (staff salaries and wage-related benefits).
$8.1M
Total costs Info The home's total operating expense for the year — all the costs of running it, salaries included (CMS cost report, Worksheet G-3).
$18.8M

Who this home usually serves

TYPE OF STAY

Mix of rehab and long-term care

This home supports both short-term rehab and long-term care, with residents staying for a wide range of durations.

Most new residents arrive under private pay (56% of admissions), and a typical private pay stay runs around 4 - 5 months.

Admissions
220 total

Coverage residents most often arrive under.

Medicare 20%
Private pay 56%
Medicaid 23%
Discharges
214 total

Coverage residents most often leave under.

Medicare 8%
Private pay 52%
Medicaid 40%

Places of interest near Schowalter Villa

Address 0.0 miles from city center Info Estimated distance in miles from Hesston's city center to Schowalter Villa's address, calculated via Google Maps.

Calculate Travel Distance to Schowalter Villa

Add your location

Address

Compare Nursing Homes around the area

Schowalter Villa
NH
HC
IL
Hesston (North Lancaster Avenue) -155 - 55 -
Meadowlark Hills Retirement Community
NH
HC
IL
NC
Manhattan (Meadowlark Road) -134 - 28 1 Bed / 2 Bed / 3 Bed
Ascension Living Via Christi Village McLean
NH
AL
IL
MC
Wichita (Indian Hills) -95 - 47 Studio / 1 Bed
Ascension Living Via Christi Village Manhattan
NH
AL
IL
Manhattan (Willow Grove Road) -129 - 10 Studio / 1 Bed / 2 Bed

Frequently Asked Questions about Schowalter Villa

What neighborhood is Schowalter Villa in?

Schowalter Villa is in the North Lancaster Avenue neighborhood of HESSTON.

Who is the owner of Schowalter Villa?

Schowalter Villa is legally operated by Mennonite Board Missions Char Of Ks Inc, and administered by Jeffrey Ritcha.

Is Schowalter Villa in a walkable area?

Schowalter Villa has a walk score of 55. Moderately walkable. Some errands can be accomplished on foot, with a mix of nearby amenities.

What is the license number of Schowalter Villa?

According to KS state health department records, Schowalter Villa's license number is 175386.

What is the occupancy rate at Schowalter Villa?

Schowalter Villa's occupancy is 61%.

Does Schowalter Villa operate as a for-profit or non-profit?

Schowalter Villa is registered as a non-profit in KS.

Who is the administrator of Schowalter Villa?

Jeffrey Ritcha is the administrator of Schowalter Villa.

Guides for Better Senior Living

Care Cost Calculator: See Prices in Your Area

Nursing Home Data Explorer

Don’t Wait Too Long: 7 Red Flag Signs Your Parent Needs Assisted Living Now

The True Cost of Assisted Living in 2025 – And How Families Are Paying For It

Understanding Senior Living Costs: Pricing Models, Discounts & Financial Assistance