Meadowlark Hills Retirement Community
Nursing Home, Home Care, Independent Living & Nursing Care · Manhattan, KS
CMS overall rating Info CMS (the Centers for Medicare & Medicaid Services) is the federal agency that rates nursing home quality. Its Overall Rating runs from 1 to 5 stars, combining health inspections, staffing, and quality measures, with inspections weighted most heavily.

Meadowlark Hills Retirement Community

Nursing Home, Home Care, Independent Living & Nursing Care · Manhattan, KS
CMS overall rating Info CMS (the Centers for Medicare & Medicaid Services) is the federal agency that rates nursing home quality. Its Overall Rating runs from 1 to 5 stars, combining health inspections, staffing, and quality measures, with inspections weighted most heavily.
Calculator: See prices in your area
Meadowlark Hills Retirement Community accepts Medicare, Medicaid, and private pay.

Overview of Meadowlark Hills Retirement Community

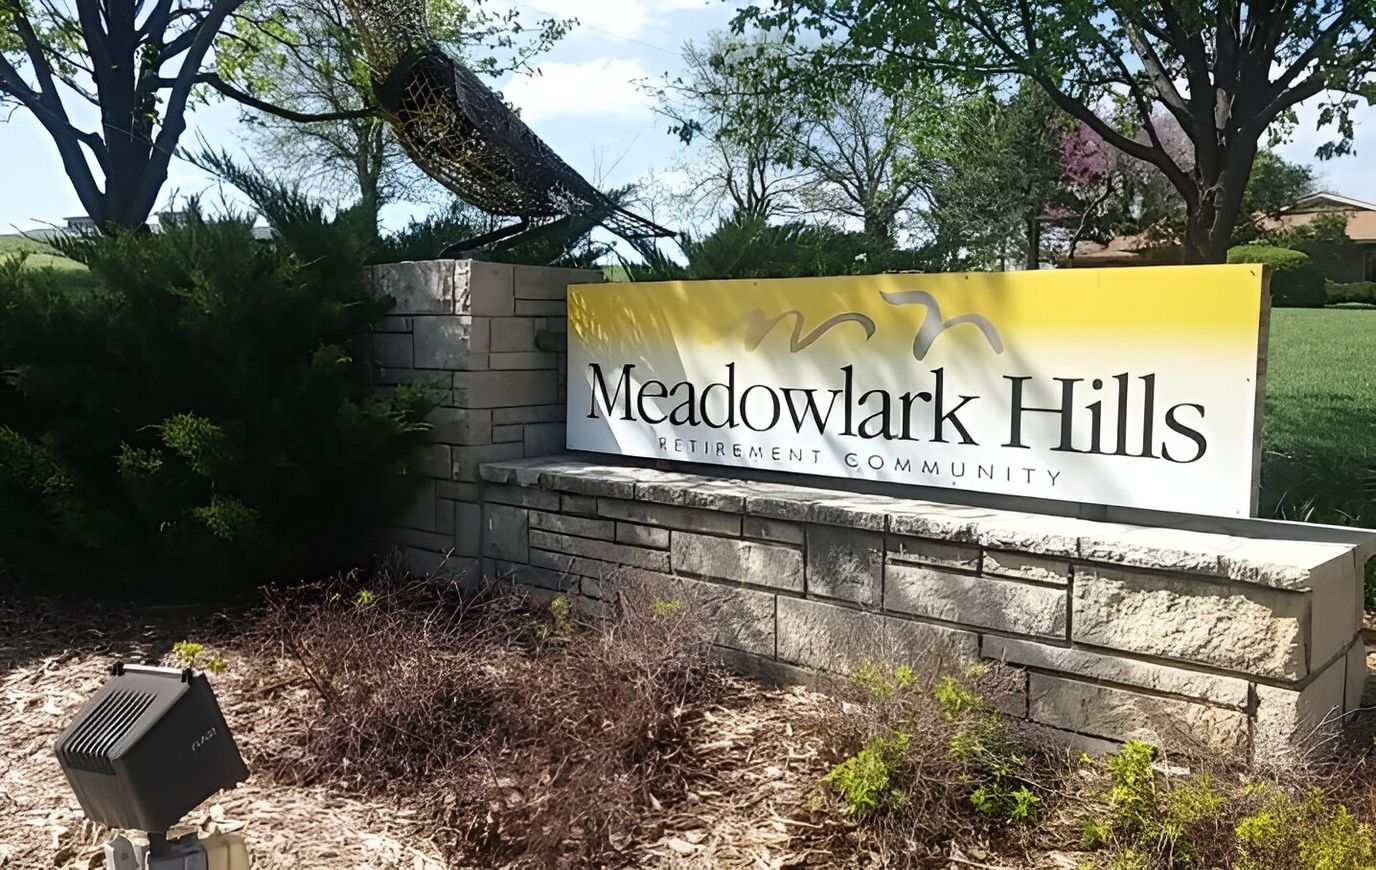
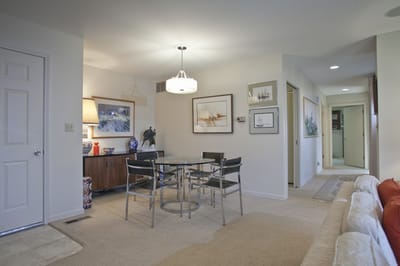
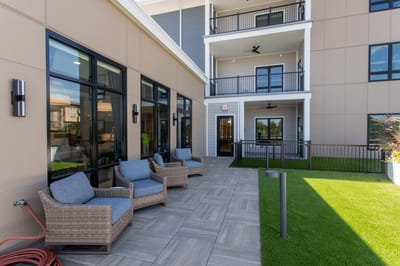
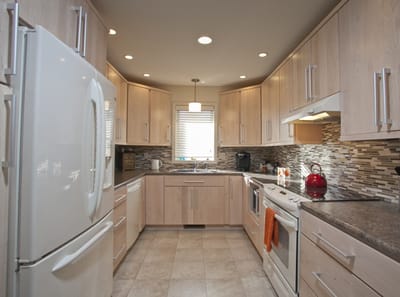
Enjoy your best years at Meadowlark Hills Retirement Community, an outstanding community in Manhattan, KS, offering independent living. Featuring beautifully designed and spacious one- to three-bedroom floor plans, the community ensures residents are comfortable and safe. A hassle-free living is also guaranteed, especially with maintenance services and convenient apartment features.

Thriving local shops and recreational spaces surround the area, providing residents with unending leisure and wellness opportunities. Residents also enjoy various dining options with delightful restaurants in the area. The community is ideal for those looking to live independently in retirement, especially with its warm and welcoming environment.

Quality ratings

Measured by Centers for Medicare & Medicaid Services (CMS)

Overall rating Info The Overall CMS Rating combines results from health inspections, staffing levels and quality measures. Health inspections carry the most weight. Staffing and quality scores can increase or decrease the final rating based on performance compared to state and national standards.
Health Inspection Info Based on the results of the facility's three most recent standard inspections and any complaint investigations. CMS reviews the number, scope, and severity of deficiencies, with more recent findings weighted more heavily.
Staffing Info Measures average nursing staff hours per resident per day, including Registered Nurses (RNs) and total nursing staff. Ratings are adjusted based on the level of care residents require and are compared to state and national benchmarks.
Quality Measures Info Based on clinical and physical health indicators reported to CMS, such as hospital readmissions, falls, pressure ulcers, and improvements in mobility. These measures reflect how well residents' health needs are being managed.

Staffing hours breakdown

Info Daily nursing hours per resident by staff type, reported to CMS. Higher is generally better — compare this facility to state and national averages to see where staffing stands.

Hours per resident per day — compared to state averages

Total nursing care / resident Info Total adjusted nursing hours per resident per day, combining RN, LPN, and aide time. CMS adjusts this for case-mix so facilities can be fairly compared.
5h 43m per day
vs avg
Staff typeHours / Day / Residentvs state avg
Registered Nurse (RN) Info RNs hold the highest nursing license and can assess residents, interpret test results, and direct care plans. More RN hours per day often signals stronger clinical oversight and faster response to health changes. 1h 3m per day
LPN / LVN Info Licensed Practical Nurses (LPNs) or Licensed Vocational Nurses (LVNs) deliver routine hands-on care — medication administration, wound dressing, and monitoring vital signs. They work under RN supervision and make up a large share of daily bedside care. 39m per day
Nurse Aide Info Certified Nurse Aides (CNAs) provide the most direct day-to-day assistance: bathing, dressing, feeding, and mobility. Nurse aide hours are typically the largest staffing category and directly affect residents' quality of life. 3h 5m per day
Weekend Total Nursing Info Combined nursing hours (RN + LPN + Nurse Aide) per resident per day on weekends. Staffing often drops on weekends — this figure reveals whether the facility maintains adequate coverage outside of weekday hours. 4h 16m per day
Physical Therapist Info Hours per resident per day provided by licensed Physical Therapists (PTs) or PT Assistants. PT services help residents recover mobility after injury or illness and are especially important for post-acute (short-stay) rehabilitation. 3m per day
Weekend RN Info Registered nurse hours specifically on weekends. Facilities sometimes reduce RN presence on Saturdays and Sundays — a low weekend RN figure compared to weekday hours can indicate reduced clinical oversight when most administrative staff are absent. 46m per day

Capacity and availability

This home usually has limited availability

Similar occupancy to the state average
Occupancy rate
87.3%
Avg. Length of Stay
157 days
Bed community size
134-bed community Rank #12 / 224Bed count — State benchmarkedThis home is ranked 12th out of 224 homes in Kansas. Shows this facility's certified or reported bed count compared to other Kansas facilities. Larger communities may offer more amenities, programs, and on-site services for residents and families.Rankings are based only on facilities in Kansas that report data for that category. Facilities without available data are excluded from the ranking.Click the rank badge to see the full State ranking.Click here to see the full State ranking.
A larger shared setting that may offer more common spaces and organized community services.
Years in operation
51 years in operation
A longer operating history, which may indicate experience navigating regulations and delivering ongoing care.
Walk Score
Walk Score: 28 / 100 Rank #269 / 363Walk Score — State benchmarkedThis home is ranked 269th out of 363 homes in Kansas. Shows how walkable this facility's neighborhood is compared to the average Walk Score across Kansas facilities. Higher scores benefit residents, families, and staff.Rankings are based only on facilities in Kansas that report data for that category. Facilities without available data are excluded from the ranking.Click the rank badge to see the full State ranking.Click here to see the full State ranking.
Somewhat walkable. A few nearby services may be reachable on foot, but most trips require transportation.

Staffing

Key information about the people who lead and staff this community.

Leadership

ContactDavid Deubler, Director

Payment & Insurance

1 service
Accept Medicare

Therapy & Rehabilitation

2 services
Rehabilitation Services
Respite Care

Staffing & Medical

2 services
Nursing Services
24-Hour Staffing

Amenities & Lifestyle

Fitness Services
Massage Services
Prairie Star Restaurant
Salon
Spiritual Life
Trail System
Transportation
Specific ProgramsHealthcare Households, Cancer Program, Memory Program, Parkinson's Program, Vital Connections, Outpatient Therapy, Physician Services
Religious Services
Touring HoursMonday – Friday, 8 a.m. – 5:30 p.m., Saturday & Sunday, 9 a.m. to 4 p.m.

Contact Meadowlark Hills Retirement Community

Inspection History

In Kansas, the Department for Aging and Disability Services, Survey and Certification Commission performs the unannounced inspections required for facility licensing and federal certification.

Since 2021 · 5 years of data 29 deficiencies 5 inspections

Inspection Scorecard Info This scorecard compares key inspection, deficiency, and complaint metrics at this facility against the Kansas state average. Metrics rated ≥15% worse than average are highlighted in red; those ≥15% better are highlighted in green.

Since 2021 vs. Kansas state average
Overall vs. KS average 1 Worse Metrics worse than Kansas average:
• Deficiencies per inspection (87% above)
3 Better Metrics better than Kansas average:
• Total deficiencies (71% below)
• Deficiencies per year (71% below)
• Total inspections (84% below)
Latest Inspection April 9, 2025 Routine

Deficiencies Info Deficiencies are formal regulatory issues recorded during state inspections.

This FacilityKS Averagevs. KS Avg
Total deficiencies Info Formal regulatory issues recorded by inspectors across all inspection types. 29100 This facility has 71% fewer total deficiencies than a typical Kansas assisted living residence (29 vs. KS avg 100).↓ 71% better
Deficiencies per year Info Average deficiencies per year since 2021. 5.820 This facility has 71% fewer deficiencies per year than a typical Kansas assisted living residence (5.8 vs. KS avg 20).↓ 71% better
Deficiencies per inspection Info Average deficiencies per inspection. 5.83.1 This facility has 87% more deficiencies per inspection than a typical Kansas assisted living residence (5.8 vs. KS avg 3.1).↑ 87% worse

Inspections Info State inspections evaluate whether the facility meets health and safety standards.

This FacilityKS Averagevs. KS Avg
Total inspections Info Combined count of all routine and focused inspections. Excludes complaint investigations. 532 This facility has 84% fewer total inspections than a typical Kansas assisted living residence (5 vs. KS avg 32).↓ 84% better

Health Inspection History

Inspections since 2021
Total health inspections 5

State average N/A


Last Health inspection on Apr 2025

Total health citations
30

State average N/A

Citations per inspection
6

State average N/A


Health citations are formal notices following inspections when they fail to comply with safety and care standards.

28 of 30 citations resulted from standard inspections; and 2 of 30 resulted from complaint investigations.

Breakdown of citation severity (last 5 years)
Critical health citations
0
In line with State average

State average: N/A


Serious health citations
1
In line with State average

State average: N/A

0 critical citations State average: N/A

1 serious citation State average: N/A

29 moderate citations State average: N/A

0 minor citations State average: N/A
Citations history (last 5 years)
Administration moderate citation Apr 09, 2025
Corrected

Infection Control moderate citation Apr 09, 2025
Corrected

Infection Control moderate citation Apr 09, 2025
Corrected

Nutrition moderate citation Apr 09, 2025
Corrected

Staffing Data

Reporting period: October 1 – December 31, 2025 (Q4 2025). Source: CMS Payroll-Based Journal report.

Total staff 305
Employees 287
Contractors 18
Staff to resident ratio 2.61 : 1
0% compared with State average

State average ratio: 0 : 0

Avg staff/day 93
Average shift 6.8 hours
0% compared with State average

State average: 0 hours

Total staff hours (quarter) 58,520

Nursing staff breakdown

Q4 2025 · Oct 1 – Dec 31 More info This data comes from the CMS Payroll-Based Journal report covering October 1 – December 31, 2025.
Registered Nurse

Manages medical care and health needs.

RN Staff Info All 32 RN Staff are full-time employees. No contractors work on this role. 32
Average shift length Info Average shift length. Calculated as total hours divided by days worked and average staff per day. 8.4 hours
Licensed Practical Nurse

Assists with medical care and medications.

LPN Staff Info All 20 LPN Staff are full-time employees. No contractors work on this role. 20
Average shift length Info Average shift length. Calculated as total hours divided by days worked and average staff per day. 7.9 hours
Certified Nursing Assistant

Helps with daily care and mobility.

CNA Staff Info All 173 CNA Staff are full-time employees. No contractors work on this role. 173
Average shift length Info Average shift length. Calculated as total hours divided by days worked and average staff per day. 6.4 hours

Contractor staffing

Q4 2025 · Oct 1 – Dec 31 More info This data comes from the CMS Payroll-Based Journal report covering October 1 – December 31, 2025.

Total hours from contractors

4.4%

2,556 contractor hours this quarter

Speech Language Pathologist: 6 Respiratory Therapy Technician: 4 Physical Therapy Aide: 3 Physical Therapy Assistant: 3 Qualified Social Worker: 2

Staff by category

Q4 2025 · Oct 1 – Dec 31 More info This data comes from the CMS Payroll-Based Journal report covering October 1 – December 31, 2025.
Certified Nursing Assistant173017325,00892100%6.4
Medication Aide/Technician390399,32292100%7
Registered Nurse320328,02292100%8.4
Licensed Practical Nurse200207,15792100%7.9
Clinical Nurse Specialist7073,1386672%7.9
Dental Services Staff4047444145%8
Speech Language Pathologist0667087278%4.2
Respiratory Therapy Technician0445706470%4.3
Other Dietary Services Staff3035366672%7.9
Physical Therapy Aide0335316672%4.6
Administrator1015206571%8
Nurse Practitioner1015206571%8
Physical Therapy Assistant0334917480%4.7
Mental Health Service Worker1014766368%7.5
Occupational Therapy Aide1014146166%6.8
Qualified Social Worker0222577076%3.4
Nurse Aide in Training5051091415%6.8
173 Certified Nursing Assistant
% of Days 100%
39 Medication Aide/Technician
% of Days 100%
32 Registered Nurse
% of Days 100%
20 Licensed Practical Nurse
% of Days 100%
7 Clinical Nurse Specialist
% of Days 72%
4 Dental Services Staff
% of Days 45%
6 Speech Language Pathologist
% of Days 78%
4 Respiratory Therapy Technician
% of Days 70%
3 Other Dietary Services Staff
% of Days 72%
3 Physical Therapy Aide
% of Days 72%
1 Administrator
% of Days 71%
1 Nurse Practitioner
% of Days 71%
3 Physical Therapy Assistant
% of Days 80%
1 Mental Health Service Worker
% of Days 68%
1 Occupational Therapy Aide
% of Days 66%
2 Qualified Social Worker
% of Days 76%
5 Nurse Aide in Training
% of Days 15%

Penalties and fines

Includes penalties issued in 2025

Federal penalties imposed by CMS for regulatory violations, including civil money penalties (fines) and denials of payment for new Medicare/Medicaid admissions.

Source: CMS Penalties Database (Data as of Jan 2026)

Total fines amount $8K
81% lower than State average

State average: $44K

Number of fines 1
59% fewer fines than State average

State average: 2.4

Payment Denials Info Serious action where Medicare and/or Medicaid temporarily stops payments for new residents until issues are fixed. 0
100% fewer payment denials than State average

State average: 0.3

Fines amount comparison
This facility $8K
State average $44K
Penalty History

Penalties are imposed by CMS for violations of federal nursing home regulations.

1 penalty in the past 3 years

Feb 3, 2025 · $8K

Civil Money Penalty Info Fines imposed for noncompliance, which can be assessed per day or per instance of violation. Feb 3, 2025
$8K

Last updated: Jan 2026

Quality of care over time

These measures show how residents usually do over time at this home, based on health outcomes and preventive care.

High-risk clinical events score Info A composite score based on pressure ulcers, falls with injury, weight loss, walking ability decline, and activities of daily living decline. 10.1
In line with State average

State average: 10.5

Functional decline score Info A composite score based on activities of daily living decline, walking ability decline, and incontinence. 18.7
10% better than State average

State average: 20.7

Long-stay resident measures
Need for Help with Daily Activities Increased Info Percent of long-stay residents whose need for help with daily activities has increased 18.3%
In line with State average

State average: 19.0%

Walking Ability Worsened Info Percent of long-stay residents whose ability to move independently worsened 16.4%
15% better than State average

State average: 19.4%

Low Risk Residents with Bowel/Bladder Incontinence Info Percent of low risk long-stay residents who lose control of their bowels or bladder 21.5%
10% better than State average

State average: 23.8%

Falls with Major Injury Info Percent of long-stay residents experiencing one or more falls with major injury 4.7%
8% worse than State average

State average: 4.4%

High Risk Residents with Pressure Ulcers Info Percent of long-stay high risk residents with pressure ulcers 3.9%
16% better than State average

State average: 4.6%

Urinary Tract Infection Info Percent of long-stay residents with a urinary tract infection 3.2%
In line with State average

State average: 3.1%

Lost Too Much Weight Info Percent of long-stay residents who lose too much weight 7.0%
38% worse than State average

State average: 5.1%

Depressive Symptoms Info Percent of long-stay residents who have depressive symptoms 0.8%
85% better than State average

State average: 5.2%

Antipsychotic Use Info Percent of long-stay residents who received an antipsychotic medication 17.4%
In line with State average

State average: 16.9%

Pneumococcal Vaccine Info Percent of long-stay residents assessed and appropriately given the pneumococcal vaccine 99.8%
9% better than State average

State average: 91.9%

Influenza Vaccine Info Percent of long-stay residents assessed and appropriately given the seasonal influenza vaccine 99.1%
In line with State average

State average: 95.5%

Short-stay resident measures
Pneumococcal Vaccine Info Percent of short-stay residents assessed and appropriately given the pneumococcal vaccine 100.0%
32% better than State average

State average: 75.6%

Antipsychotic medication increase Info Percent of short-stay residents who newly received an antipsychotic medication 0.0%
100% better than State average

State average: 2.2%

Influenza Vaccine Info Percent of short-stay residents assessed and appropriately given the seasonal influenza vaccine 94.7%
29% better than State average

State average: 73.5%

Breakdown by payment type

Medicare

37% of new residents, usually for short-term rehab.

Typical stay 3 - 4 months

Private pay

45% of new residents, often for short stays.

Typical stay 8 - 9 months

Medicaid

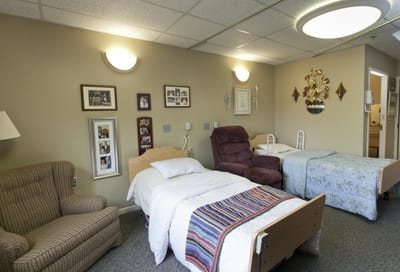
18% of new residents, often for long-term daily care.

Typical stay 11 - 12 months

Facility Characteristics

Source: CMS Long-Term Care Facility Characteristics (Data as of Jan 2026)

Total residents 117
Medicare
17
14.5% of residents
Medicaid
100
85.5% of residents
Programs & Services
Residents Group

Residents meet regularly to discuss policies, care quality, and activities

Family Member Group

Family members meet regularly to discuss policies, care quality, and activities

Nurse Aide Training

State-approved Nurse Aide Training and Competency Evaluation Program on-site

CCRC

Part of a Continuing Care Retirement Community offering multiple care levels

Active Family Council

Organized group of family members that meets regularly to discuss facility policies, resident care, and activities.

Active Resident Council

Organized group of residents that meets regularly to discuss facility policies, quality of life, and activities.

Finances and operations

Based on CMS SNF Cost Report for fiscal year ending in 06/2024.

Nonprofit
Nonprofit Corporation
Net patient revenue Info Net patient revenue — what the home actually collects for resident care, after contractual allowances, bad debt and discounts are subtracted from its gross charges (CMS cost report, Worksheet G-3). It covers resident care only; money the home earns from other sources is shown separately as "Other income."
$19.1M
Net patient income Info Net patient income: net patient revenue minus the home's total operating expenses. A positive figure means it earns more from resident care than it spends to deliver it; a negative figure means the opposite. It excludes non-operating "other income."
-$12.8M
Nonprofit Nonprofit Corporation
Net patient revenue Info Net patient revenue — what the home actually collects for resident care, after contractual allowances, bad debt and discounts are subtracted from its gross charges (CMS cost report, Worksheet G-3). It covers resident care only; money the home earns from other sources is shown separately as "Other income."
$19.1M
Net patient income Info Net patient income: net patient revenue minus the home's total operating expenses. A positive figure means it earns more from resident care than it spends to deliver it; a negative figure means the opposite. It excludes non-operating "other income."
-$12.8M
Other income Info Money the home earns outside of resident care — such as investments, grants, rentals and other non-operating sources (CMS cost report, Worksheet G-3). It is tracked separately from net patient revenue: it is not part of that figure, and it is not included in net patient income.
$16.9M
Payroll costs Info Staff salaries plus wage-related costs — benefits such as payroll taxes, health insurance and retirement — from the home's own accounting records (CMS cost report, Worksheet A). Contract or agency labor is counted separately, under other operating costs.
$17.0M 88.8% of net patient revenue Info Payroll as a share of revenue: staff salaries and wage-related benefits divided by net patient revenue. A higher figure means more of each revenue dollar goes to staff pay.
Other operating costs Info Everything it costs to run the home apart from payroll — food, utilities, supplies, maintenance, contract labor and administration. Calculated as total operating expense minus payroll (staff salaries and wage-related benefits).
$14.9M
Total costs Info The home's total operating expense for the year — all the costs of running it, salaries included (CMS cost report, Worksheet G-3).
$31.9M

What does this home offer?

Housing options icon

Housing Options: 1 Bed / 2 Bed / 3 Bed

Building type icon
Building type icon

Building Type: 3-story

Beauty services icon

Beauty Services

Transportation services icon

Transportation Services

Exercise program icon

Exercise Programs

Who this home usually serves

TYPE OF STAY

Mix of rehab and long-term care

This home supports both short-term rehab and long-term care, with residents staying for a wide range of durations.

New residents most often arrive under private pay (45% of admissions), and a typical private pay stay runs around 8 - 9 months.

Admissions
274 total

Coverage residents most often arrive under.

Medicare 37%
Private pay 45%
Medicaid 18%
Discharges
287 total

Coverage residents most often leave under.

Medicare 30%
Private pay 51%
Medicaid 18%

Places of interest near Meadowlark Hills Retirement Community

Address 2.5 miles from city center Info Estimated distance in miles from Manhattan's city center to Meadowlark Hills Retirement Community's address, calculated via Google Maps.

Calculate Travel Distance to Meadowlark Hills Retirement Community

Add your location

Address

Compare Nursing Homes around the area

The information below is reported by the Kansas Department for Aging and Disability Services.

Meadowlark Hills Retirement Community
NH
HC
IL
NC
Manhattan (Meadowlark Road) -134 - 28 1 Bed / 2 Bed / 3 Bed
Ascension Living Via Christi Village McLean
NH
AL
IL
MC
Wichita (Indian Hills) -95 - 47 Studio / 1 Bed
Ascension Living Via Christi Village Manhattan
NH
AL
IL
Manhattan (Willow Grove Road) -129 - 10 Studio / 1 Bed / 2 Bed
Claridge Court
NH
IL
Prairie Village (Prairie Hills) -45 A+ 64 -
Cumbernauld Village Inc
NH
AL
IL
NC
RC
Winfield -42 - 78 -

Frequently Asked Questions about Meadowlark Hills Retirement Community

What neighborhood is Meadowlark Hills Retirement Community in?

Meadowlark Hills Retirement Community is in the Meadowlark Road neighborhood of Manhattan.

Is Meadowlark Hills Retirement Community in a walkable area?

Meadowlark Hills Retirement Community has a walk score of 28. Somewhat walkable. A few nearby services may be reachable on foot, but most trips require transportation.

What is the occupancy rate at Meadowlark Hills Retirement Community?

Meadowlark Hills Retirement Community's occupancy is 126.3%.

Does Meadowlark Hills Retirement Community operate as a for-profit or non-profit?

Meadowlark Hills Retirement Community is registered as a non-profit in KS.

Are there photos of Meadowlark Hills Retirement Community?

Yes — there are 7 photos of Meadowlark Hills Retirement Community in the photo gallery on this page.

What is the address of Meadowlark Hills Retirement Community?

Meadowlark Hills Retirement Community is located at 2121 Meadowlark Rd, Manhattan, KS 66502.

What is the phone number of Meadowlark Hills Retirement Community?

(785) 537-4610 will put you in contact with the team at Meadowlark Hills Retirement Community.

Guides for Better Senior Living

Care Cost Calculator: See Prices in Your Area

Nursing Home Data Explorer

Don’t Wait Too Long: 7 Red Flag Signs Your Parent Needs Assisted Living Now

The True Cost of Assisted Living in 2025 – And How Families Are Paying For It

Understanding Senior Living Costs: Pricing Models, Discounts & Financial Assistance