Ascension Living Via Christi Village Manhattan
Nursing Home, Assisted Living & Independent Living · Manhattan, KS
CMS overall rating Info CMS (the Centers for Medicare & Medicaid Services) is the federal agency that rates nursing home quality. Its Overall Rating runs from 1 to 5 stars, combining health inspections, staffing, and quality measures, with inspections weighted most heavily.

Ascension Living Via Christi Village Manhattan

Nursing Home, Assisted Living & Independent Living · Manhattan, KS
CMS overall rating Info CMS (the Centers for Medicare & Medicaid Services) is the federal agency that rates nursing home quality. Its Overall Rating runs from 1 to 5 stars, combining health inspections, staffing, and quality measures, with inspections weighted most heavily.
Calculator: See prices in your area
Ascension Living Via Christi Village Manhattan accepts Medicare and private pay.

Overview of Ascension Living Via Christi Village Manhattan

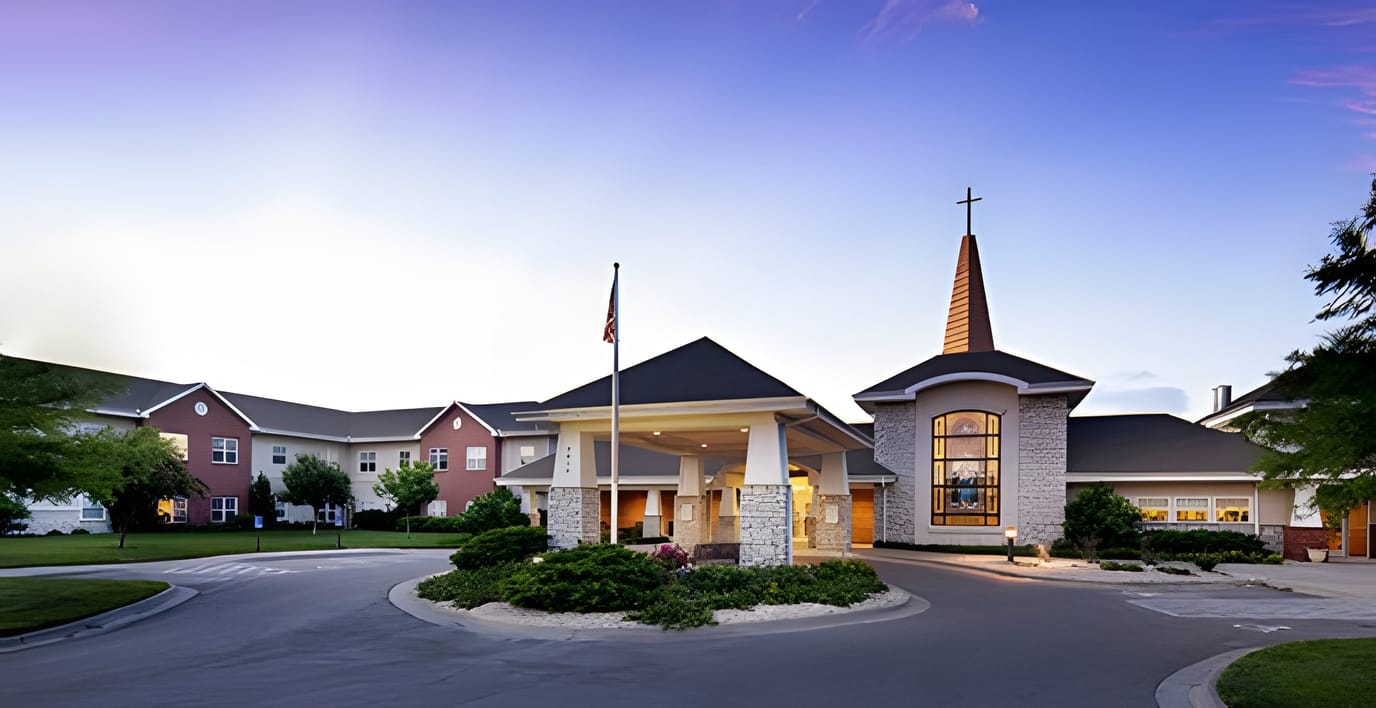
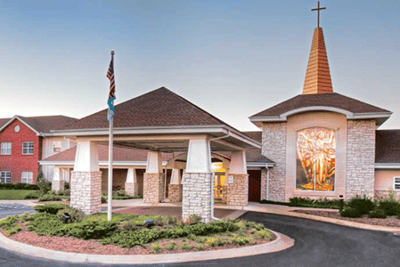
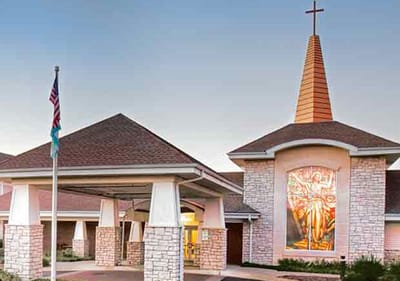
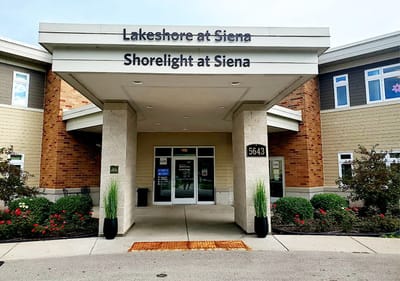
Age without worries at Ascension Living Via Christi Village Manhattan, an exceptional community in Manhattan, KS, offering independent living, assisted living, skilled nursing, rehabilitation, and respite care. Independent living residents can choose among its beautifully designed and spacious two-bedroom floor plans, ensuring their comfort and safety. The community also helps with housekeeping and maintenance, so residents have a hassle-free living.

A thoughtfully curated calendar of engaging activities and stimulating programs is conducted to keep residents active and socially connected. Delightful and healthy meals are also served to satisfy residents’ dietary needs and preferences. With plenty of common spaces, including a library, card rooms, cafes, and gardens, the community ensures residents can thrive in retirement.

Quality ratings

Measured by Centers for Medicare & Medicaid Services (CMS)

Overall rating Info The Overall CMS Rating combines results from health inspections, staffing levels and quality measures. Health inspections carry the most weight. Staffing and quality scores can increase or decrease the final rating based on performance compared to state and national standards.
Health Inspection Info Based on the results of the facility's three most recent standard inspections and any complaint investigations. CMS reviews the number, scope, and severity of deficiencies, with more recent findings weighted more heavily.
Staffing Info Measures average nursing staff hours per resident per day, including Registered Nurses (RNs) and total nursing staff. Ratings are adjusted based on the level of care residents require and are compared to state and national benchmarks.
Quality Measures Info Based on clinical and physical health indicators reported to CMS, such as hospital readmissions, falls, pressure ulcers, and improvements in mobility. These measures reflect how well residents' health needs are being managed.

Staffing hours breakdown

Info Daily nursing hours per resident by staff type, reported to CMS. Higher is generally better — compare this facility to state and national averages to see where staffing stands.

Hours per resident per day — compared to state averages

Total nursing care / resident Info Total adjusted nursing hours per resident per day, combining RN, LPN, and aide time. CMS adjusts this for case-mix so facilities can be fairly compared.
4h 35m per day
vs avg
Staff typeHours / Day / Residentvs state avg
Registered Nurse (RN) Info RNs hold the highest nursing license and can assess residents, interpret test results, and direct care plans. More RN hours per day often signals stronger clinical oversight and faster response to health changes. 34m per day
LPN / LVN Info Licensed Practical Nurses (LPNs) or Licensed Vocational Nurses (LVNs) deliver routine hands-on care — medication administration, wound dressing, and monitoring vital signs. They work under RN supervision and make up a large share of daily bedside care. 1h 1m per day
Nurse Aide Info Certified Nurse Aides (CNAs) provide the most direct day-to-day assistance: bathing, dressing, feeding, and mobility. Nurse aide hours are typically the largest staffing category and directly affect residents' quality of life. 2h 34m per day
Weekend Total Nursing Info Combined nursing hours (RN + LPN + Nurse Aide) per resident per day on weekends. Staffing often drops on weekends — this figure reveals whether the facility maintains adequate coverage outside of weekday hours. 3h 48m per day
Physical Therapist Info Hours per resident per day provided by licensed Physical Therapists (PTs) or PT Assistants. PT services help residents recover mobility after injury or illness and are especially important for post-acute (short-stay) rehabilitation. 1m per day
Weekend RN Info Registered nurse hours specifically on weekends. Facilities sometimes reduce RN presence on Saturdays and Sundays — a low weekend RN figure compared to weekday hours can indicate reduced clinical oversight when most administrative staff are absent. 12m per day

Capacity and availability

Avg. Length of Stay
95 days
Bed community size
129-bed community Rank #16 / 224Bed count — State benchmarkedThis home is ranked 16th out of 224 homes in Kansas. Shows this facility's certified or reported bed count compared to other Kansas facilities. Larger communities may offer more amenities, programs, and on-site services for residents and families.Rankings are based only on facilities in Kansas that report data for that category. Facilities without available data are excluded from the ranking.Click the rank badge to see the full State ranking.Click here to see the full State ranking.
A larger shared setting that may offer more common spaces and organized community services.
Walk Score
Walk Score: 10 / 100 Rank #339 / 363Walk Score — State benchmarkedThis home is ranked 339th out of 363 homes in Kansas. Shows how walkable this facility's neighborhood is compared to the average Walk Score across Kansas facilities. Higher scores benefit residents, families, and staff.Rankings are based only on facilities in Kansas that report data for that category. Facilities without available data are excluded from the ranking.Click the rank badge to see the full State ranking.Click here to see the full State ranking.
Car-dependent. Most errands require a car, with limited nearby walkable options.

About this community

Occupancy

Occupancy rate
93%
Higher than the Kansas average: 79.5%
Occupied beds
119 / 129
Average occupied beds in Kansas homes 50 beds

License Details

Facility TypeNursing Facility | Assisted Living Facility
StatusActive
CountyRiley
License Number175100
AccreditationsLeadingAge

Ownership & Operating Entity

Ascension Living Via Christi Village Manhattan is administered by Michael Fuchs.

OwnerCITY OF MANHATTAN

Type Of Units

Assisted Living
36 units
NF (Nursing Facility)
93 units
SNF/NF (Combined)
93 units
Total beds
129 units

Safety & Compliance

Emergency SystemsYes

Therapy & Rehabilitation

3 services
Rehabilitation Services
Respite Care
Short-Term Rehab

Staffing & Medical

1 service
24-Hour Staffing

Additional Services

1 service
Home Care

Additional Policies & Features

Pets Allowed
Linen ServiceYes

Amenities & Lifestyle

Library
Salon
Barber
Spa
Dining Room
Restaurant
Patio
Transportation
Concierge
Housekeeping
Laundry
Religious Services

Contact Ascension Living Via Christi Village Manhattan

Inspection History

In Kansas, the Department for Aging and Disability Services, Survey and Certification Commission performs the unannounced inspections required for facility licensing and federal certification.

Inspection Scorecard Info This scorecard compares key inspection, deficiency, and complaint metrics at this facility against the Kansas state average. Metrics rated ≥15% worse than average are highlighted in red; those ≥15% better are highlighted in green.

Overall vs. KS average 1 Worse Metrics worse than Kansas average:
• Total inspections (28% above)
0 Better No metrics in this bucket.
Latest Inspection April 16, 2025

Inspections Info State inspections evaluate whether the facility meets health and safety standards.

This FacilityKS Averagevs. KS Avg
Total inspections Info Combined count of all routine and focused inspections. Excludes complaint investigations. 4132 This facility has 28% more total inspections than a typical Kansas assisted living residence (41 vs. KS avg 32).↑ 28% worse

Health Inspection History

Inspections since 2021
Total health inspections 9

State average N/A


Last Health inspection on Jul 2025

Total health citations
25

State average N/A

Citations per inspection
2.78

State average N/A


Health citations are formal notices following inspections when they fail to comply with safety and care standards.

12 of 25 citations resulted from standard inspections; 7 of 25 resulted from complaint investigations; and 6 of 25 came from combined inspections (standard and complaint).

Breakdown of citation severity (last 5 years)
Critical health citations
4
In line with State average

State average: N/A


Serious health citations
3
In line with State average

State average: N/A

4 critical citations State average: N/A

3 serious citations State average: N/A

18 moderate citations State average: N/A

0 minor citations State average: N/A
Citations history (last 5 years)
Quality of Care critical citation Jul 29, 2025
Corrected

Quality of Care serious citation Apr 01, 2025
Corrected

Infection Control moderate citation Oct 02, 2024
Corrected

Quality of Care moderate citation Oct 02, 2024
Corrected

Staffing Data

Reporting period: October 1 – December 31, 2025 (Q4 2025). Source: CMS Payroll-Based Journal report.

Total staff 164
Employees 142
Contractors 22
Staff to resident ratio 1.91 : 1
0% compared with State average

State average ratio: 0 : 0

Avg staff/day 52
Average shift 7.5 hours
0% compared with State average

State average: 0 hours

Total staff hours (quarter) 35,856

Nursing staff breakdown

Q4 2025 · Oct 1 – Dec 31 More info This data comes from the CMS Payroll-Based Journal report covering October 1 – December 31, 2025.
Registered Nurse

Manages medical care and health needs.

RN Staff Info All 9 RN Staff are full-time employees. No contractors work on this role. 9
Average shift length Info Average shift length. Calculated as total hours divided by days worked and average staff per day. 8.7 hours
Licensed Practical Nurse

Assists with medical care and medications.

LPN Staff Info All 21 LPN Staff are full-time employees. No contractors work on this role. 21
Average shift length Info Average shift length. Calculated as total hours divided by days worked and average staff per day. 10.3 hours
Certified Nursing Assistant

Helps with daily care and mobility.

CNA Staff Info All 80 CNA Staff are full-time employees. No contractors work on this role. 80
Average shift length Info Average shift length. Calculated as total hours divided by days worked and average staff per day. 6.8 hours

Contractor staffing

Q4 2025 · Oct 1 – Dec 31 More info This data comes from the CMS Payroll-Based Journal report covering October 1 – December 31, 2025.

Total hours from contractors

4.6%

1,648 contractor hours this quarter

Speech Language Pathologist: 8 Physical Therapy Aide: 4 Qualified Social Worker: 3 Physical Therapy Assistant: 3 Respiratory Therapy Technician: 2 Administrator: 1 Occupational Therapy Aide: 1

Staff by category

Q4 2025 · Oct 1 – Dec 31 More info This data comes from the CMS Payroll-Based Journal report covering October 1 – December 31, 2025.
Certified Nursing Assistant8008013,63092100%6.8
Licensed Practical Nurse210217,95492100%10.3
Medication Aide/Technician210216,27792100%7.8
Registered Nurse9092,97792100%8.7
Other Dietary Services Staff6061,56892100%6.7
Clinical Nurse Specialist3039136773%6.6
Speech Language Pathologist0885887379%4.4
Nurse Practitioner1014645863%8
Administrator1124255358%7.9
Physical Therapy Aide0443796571%5.1
Physical Therapy Assistant0332954448%6.7
Occupational Therapy Aide0112234751%4.7
Respiratory Therapy Technician0221172022%5.8
Qualified Social Worker033463639%1.3
80 Certified Nursing Assistant
% of Days 100%
21 Licensed Practical Nurse
% of Days 100%
21 Medication Aide/Technician
% of Days 100%
9 Registered Nurse
% of Days 100%
6 Other Dietary Services Staff
% of Days 100%
3 Clinical Nurse Specialist
% of Days 73%
8 Speech Language Pathologist
% of Days 79%
1 Nurse Practitioner
% of Days 63%
2 Administrator
% of Days 58%
4 Physical Therapy Aide
% of Days 71%
3 Physical Therapy Assistant
% of Days 48%
1 Occupational Therapy Aide
% of Days 51%
2 Respiratory Therapy Technician
% of Days 22%
3 Qualified Social Worker
% of Days 39%

Penalties and fines

Includes penalties issued in 2023

Federal penalties imposed by CMS for regulatory violations, including civil money penalties (fines) and denials of payment for new Medicare/Medicaid admissions.

Source: CMS Penalties Database (Data as of Jan 2026)

Total fines amount $142K
224% higher than State average

State average: $44K

Number of fines 4
65% more fines than State average

State average: 2.4

Payment Denials Info Serious action where Medicare and/or Medicaid temporarily stops payments for new residents until issues are fixed. 0
100% fewer payment denials than State average

State average: 0.3

Fines amount comparison
This facility $142K
State average $44K
Penalty History

Penalties are imposed by CMS for violations of federal nursing home regulations.

4 penalties in the past 3 years

Multiple penalties were reported in the last 3 years.

Civil Money Penalty Info Fines imposed for noncompliance, which can be assessed per day or per instance of violation. Dec 13, 2023
$39K
Civil Money Penalty Info Fines imposed for noncompliance, which can be assessed per day or per instance of violation. Oct 26, 2023
$14K
Civil Money Penalty Info Fines imposed for noncompliance, which can be assessed per day or per instance of violation. Jul 11, 2023
$11K
Civil Money Penalty Info Fines imposed for noncompliance, which can be assessed per day or per instance of violation. Jul 11, 2023
$79K

Last updated: Jan 2026

Quality of care over time

These measures show how residents usually do over time at this home, based on health outcomes and preventive care.

High-risk clinical events score Info A composite score based on pressure ulcers, falls with injury, weight loss, walking ability decline, and activities of daily living decline. 8.1
23% better than State average

State average: 10.5

Functional decline score Info A composite score based on activities of daily living decline, walking ability decline, and incontinence. 18.0
13% better than State average

State average: 20.7

Long-stay resident measures
Need for Help with Daily Activities Increased Info Percent of long-stay residents whose need for help with daily activities has increased 14.4%
24% better than State average

State average: 19.0%

Walking Ability Worsened Info Percent of long-stay residents whose ability to move independently worsened 14.7%
24% better than State average

State average: 19.4%

Low Risk Residents with Bowel/Bladder Incontinence Info Percent of low risk long-stay residents who lose control of their bowels or bladder 24.8%
In line with State average

State average: 23.8%

Falls with Major Injury Info Percent of long-stay residents experiencing one or more falls with major injury 8.0%
83% worse than State average

State average: 4.4%

High Risk Residents with Pressure Ulcers Info Percent of long-stay high risk residents with pressure ulcers 2.4%
48% better than State average

State average: 4.6%

Urinary Tract Infection Info Percent of long-stay residents with a urinary tract infection 1.4%
56% better than State average

State average: 3.1%

Lost Too Much Weight Info Percent of long-stay residents who lose too much weight 0.8%
84% better than State average

State average: 5.1%

Depressive Symptoms Info Percent of long-stay residents who have depressive symptoms 8.6%
66% worse than State average

State average: 5.2%

Antipsychotic Use Info Percent of long-stay residents who received an antipsychotic medication 12.7%
25% better than State average

State average: 16.9%

Pneumococcal Vaccine Info Percent of long-stay residents assessed and appropriately given the pneumococcal vaccine 99.7%
8% better than State average

State average: 91.9%

Influenza Vaccine Info Percent of long-stay residents assessed and appropriately given the seasonal influenza vaccine 98.7%
In line with State average

State average: 95.5%

Short-stay resident measures
Pneumococcal Vaccine Info Percent of short-stay residents assessed and appropriately given the pneumococcal vaccine 93.8%
24% better than State average

State average: 75.6%

Antipsychotic medication increase Info Percent of short-stay residents who newly received an antipsychotic medication 0.4%
84% better than State average

State average: 2.2%

Influenza Vaccine Info Percent of short-stay residents assessed and appropriately given the seasonal influenza vaccine 96.0%
31% better than State average

State average: 73.5%

Breakdown by payment type

Medicare

43% of new residents, usually for short-term rehab.

Typical stay 18 days

Private pay

57% of new residents, often for short stays.

Typical stay 6 - 7 months

Facility Characteristics

Source: CMS Long-Term Care Facility Characteristics (Data as of Jan 2026)

Total residents 86
Medicare
13
15.1% of residents
Medicaid
44
51.2% of residents
Private pay or other
29
33.7% of residents
Programs & Services
Residents Group

Residents meet regularly to discuss policies, care quality, and activities

Nurse Aide Training

State-approved Nurse Aide Training and Competency Evaluation Program on-site

CCRC

Part of a Continuing Care Retirement Community offering multiple care levels

Active Resident Council

Organized group of residents that meets regularly to discuss facility policies, quality of life, and activities.

Finances and operations

Based on CMS SNF Cost Report for fiscal year ending in 06/2024.

Nonprofit
Nonprofit Corporation
Net patient revenue Info Net patient revenue — what the home actually collects for resident care, after contractual allowances, bad debt and discounts are subtracted from its gross charges (CMS cost report, Worksheet G-3). It covers resident care only; money the home earns from other sources is shown separately as "Other income."
$12.5M
Net patient income Info Net patient income: net patient revenue minus the home's total operating expenses. A positive figure means it earns more from resident care than it spends to deliver it; a negative figure means the opposite. It excludes non-operating "other income."
$324.0K
Nonprofit Nonprofit Corporation
Net patient revenue Info Net patient revenue — what the home actually collects for resident care, after contractual allowances, bad debt and discounts are subtracted from its gross charges (CMS cost report, Worksheet G-3). It covers resident care only; money the home earns from other sources is shown separately as "Other income."
$12.5M
Net patient income Info Net patient income: net patient revenue minus the home's total operating expenses. A positive figure means it earns more from resident care than it spends to deliver it; a negative figure means the opposite. It excludes non-operating "other income."
$324.0K
Other income Info Money the home earns outside of resident care — such as investments, grants, rentals and other non-operating sources (CMS cost report, Worksheet G-3). It is tracked separately from net patient revenue: it is not part of that figure, and it is not included in net patient income.
$226.6K
Payroll costs Info Staff salaries plus wage-related costs — benefits such as payroll taxes, health insurance and retirement — from the home's own accounting records (CMS cost report, Worksheet A). Contract or agency labor is counted separately, under other operating costs.
$6.3M 50.4% of net patient revenue Info Payroll as a share of revenue: staff salaries and wage-related benefits divided by net patient revenue. A higher figure means more of each revenue dollar goes to staff pay.
Other operating costs Info Everything it costs to run the home apart from payroll — food, utilities, supplies, maintenance, contract labor and administration. Calculated as total operating expense minus payroll (staff salaries and wage-related benefits).
$5.9M
Total costs Info The home's total operating expense for the year — all the costs of running it, salaries included (CMS cost report, Worksheet G-3).
$12.2M

What does this home offer?

Room sizes icon
Room sizes icon

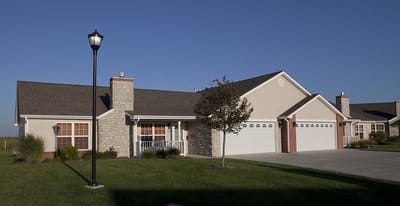
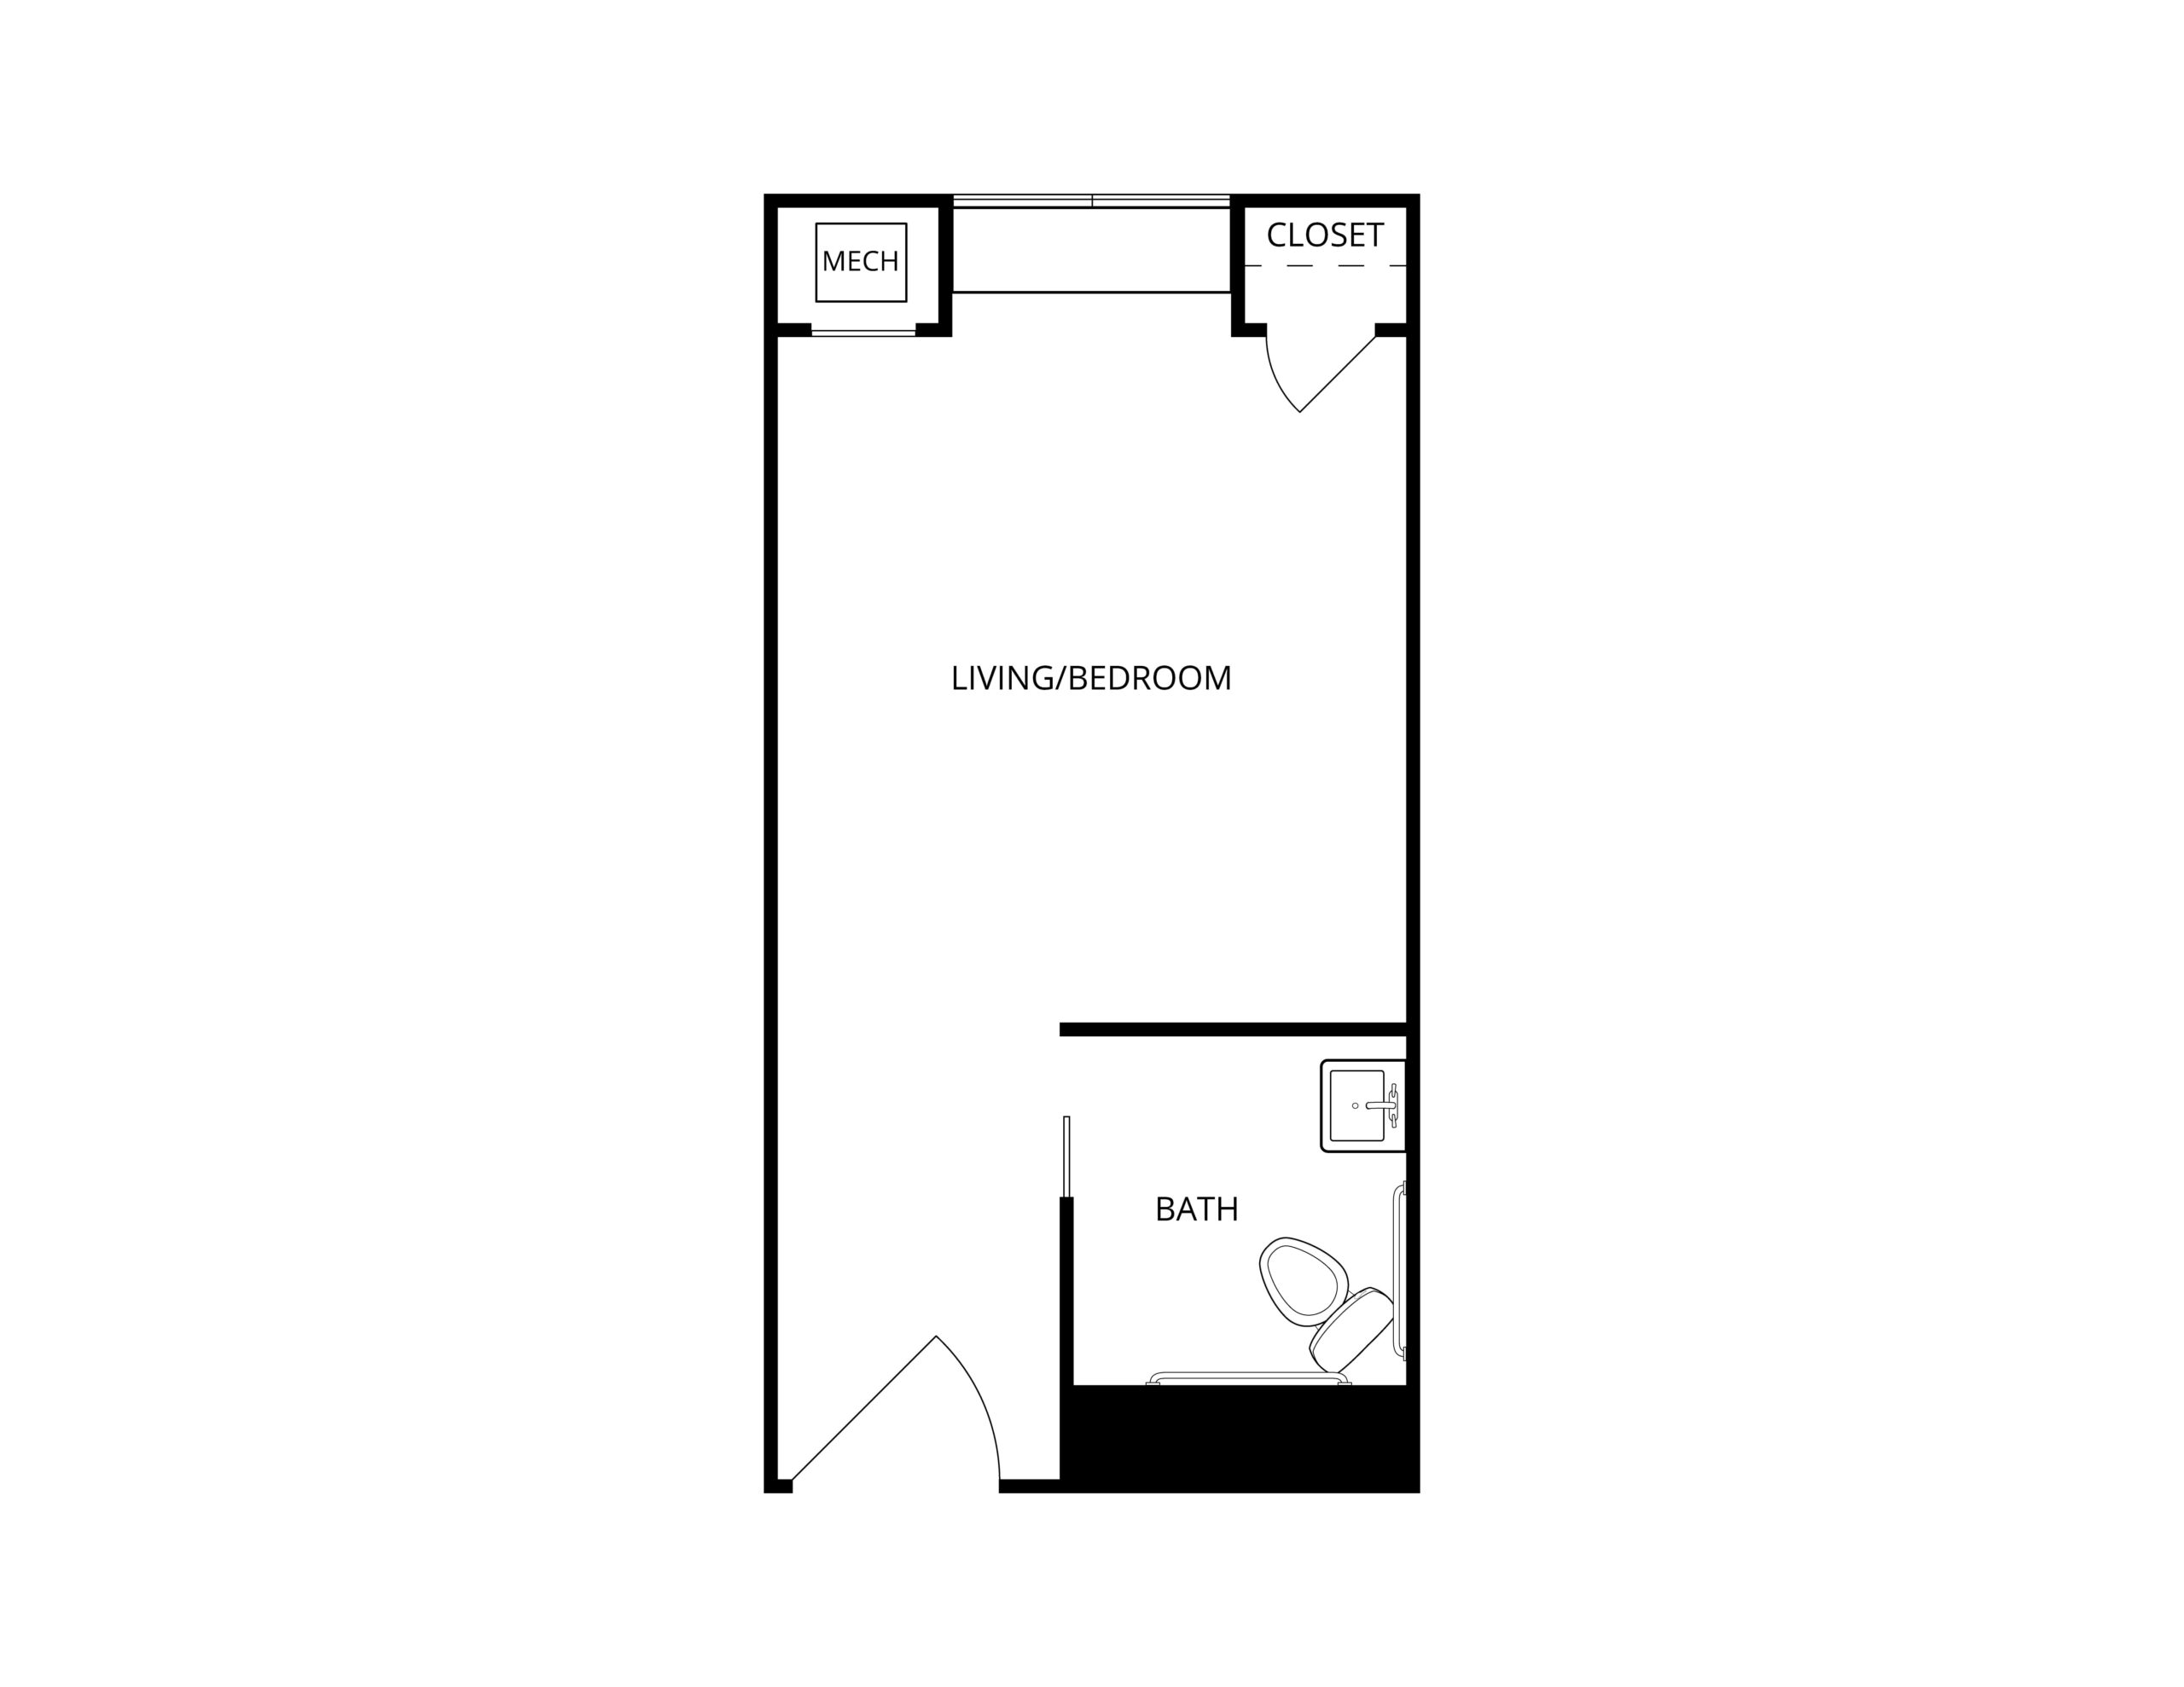
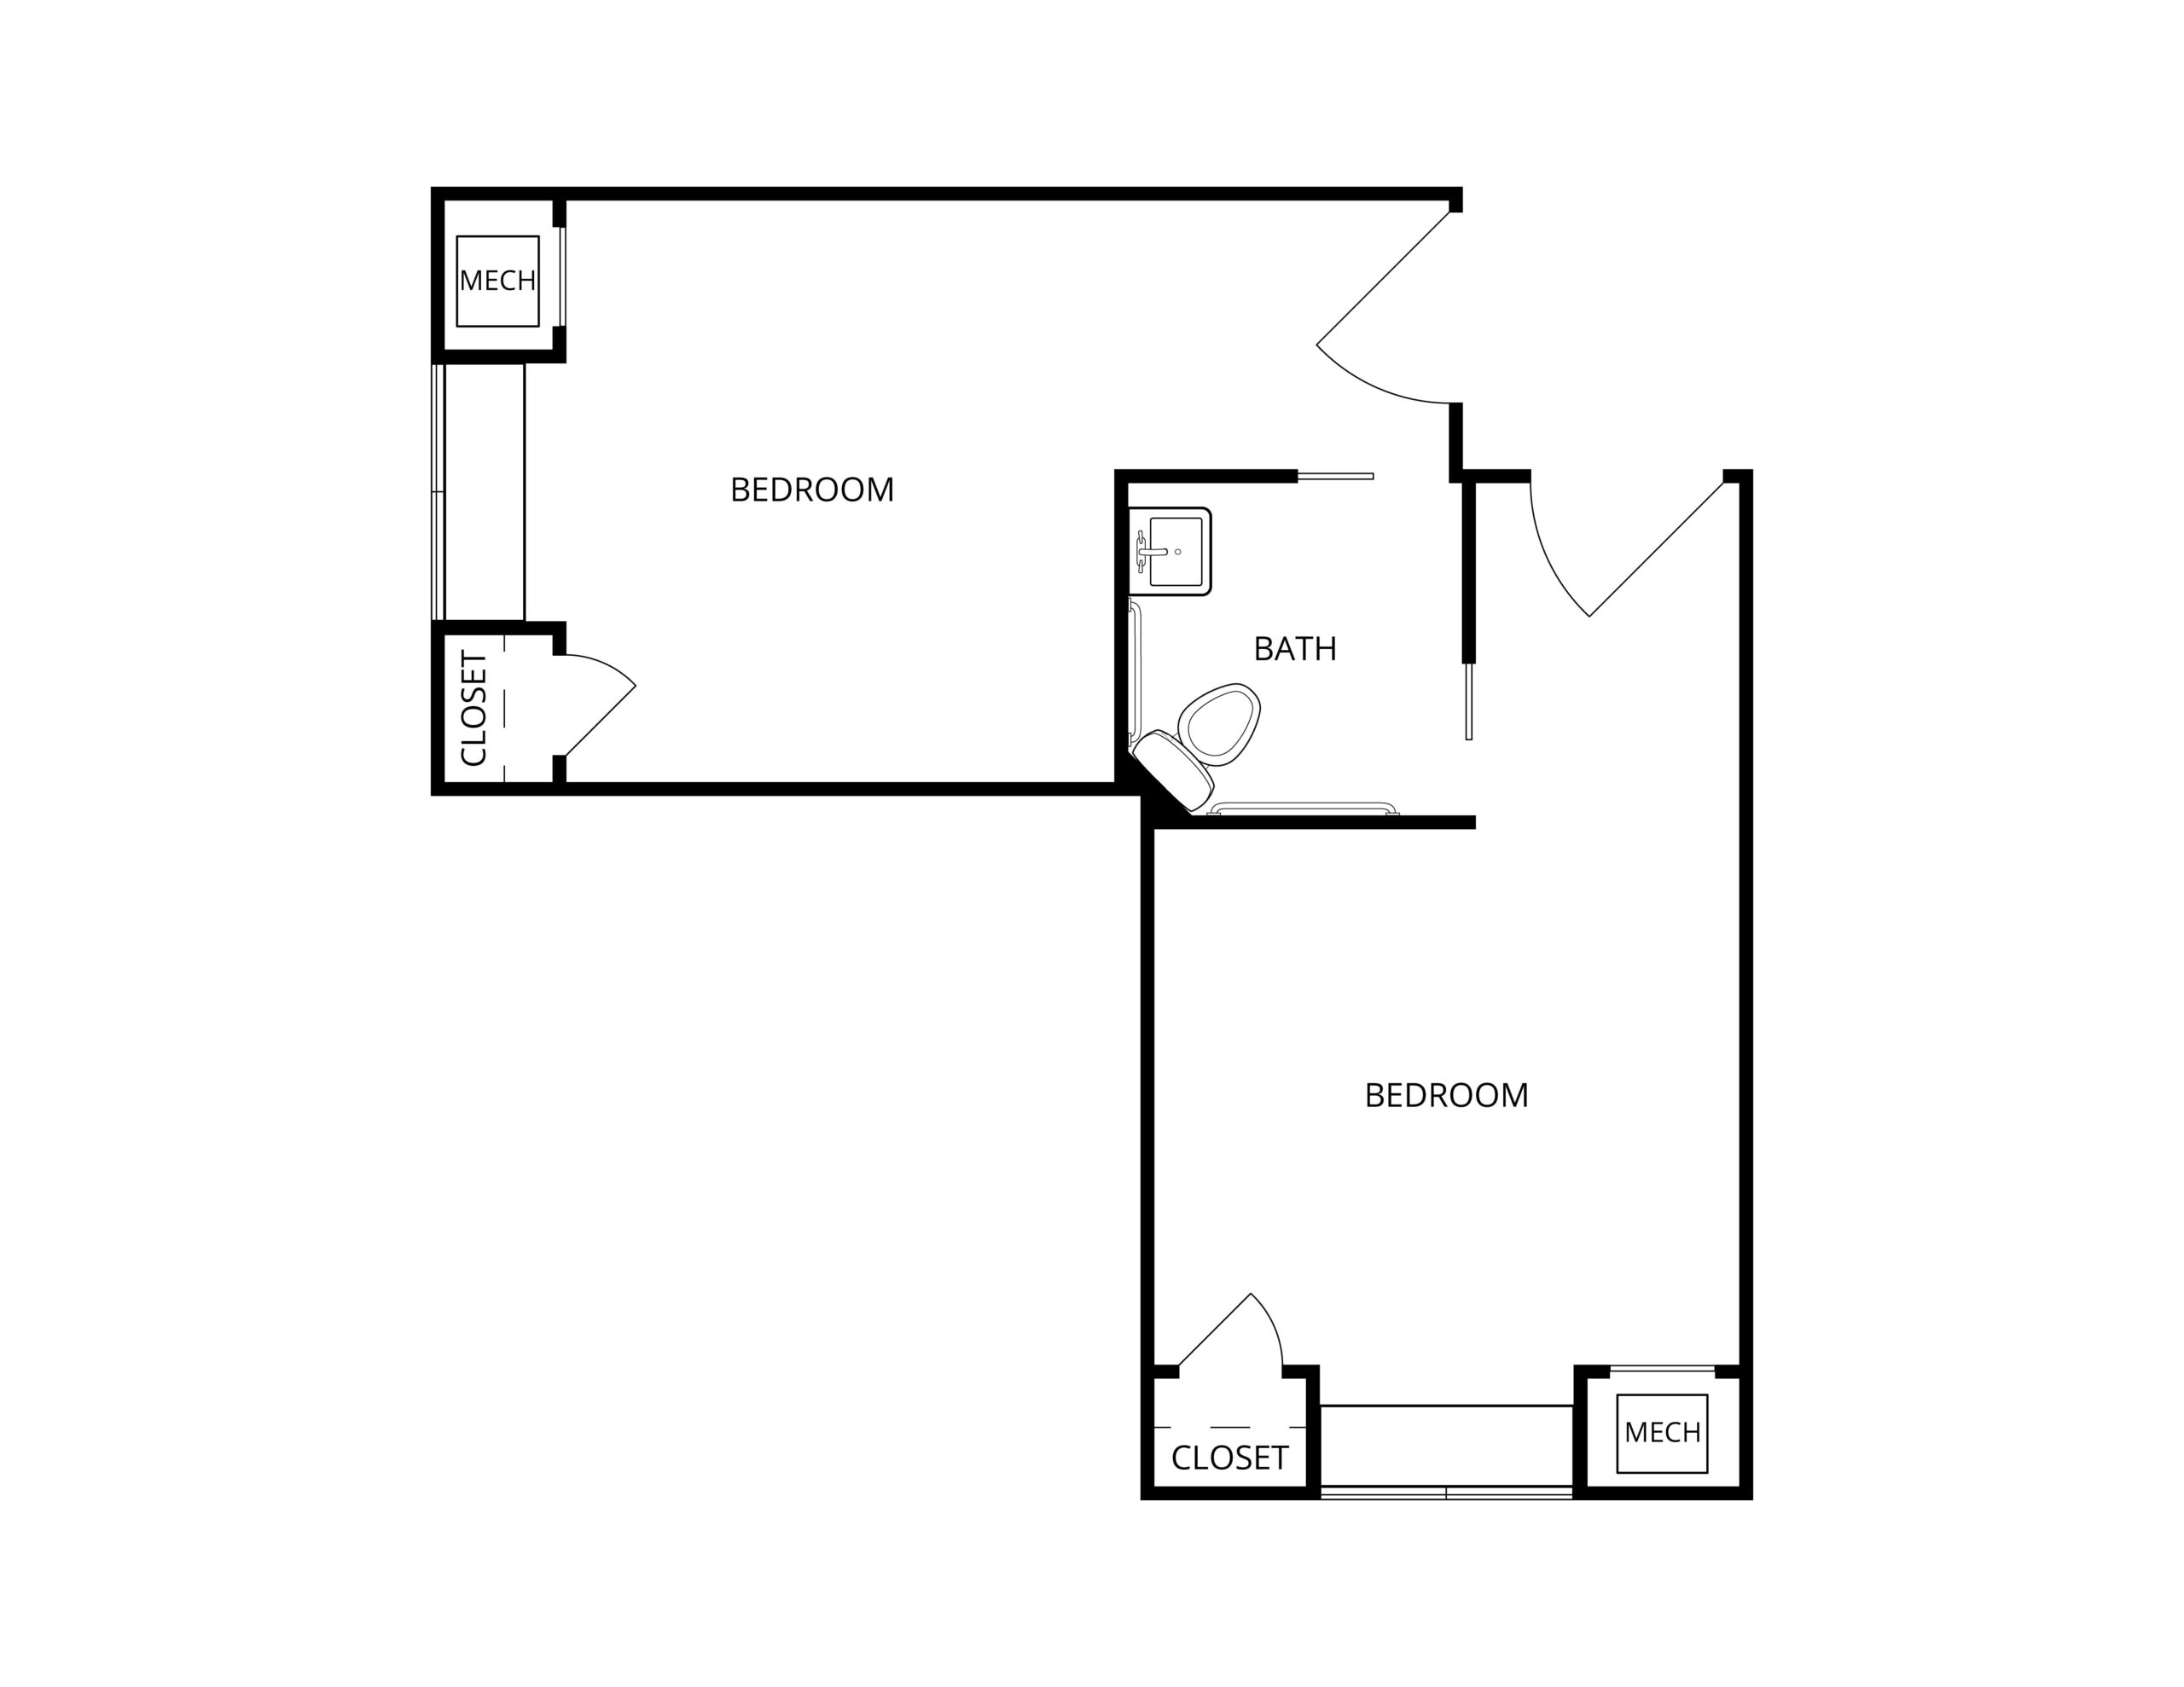
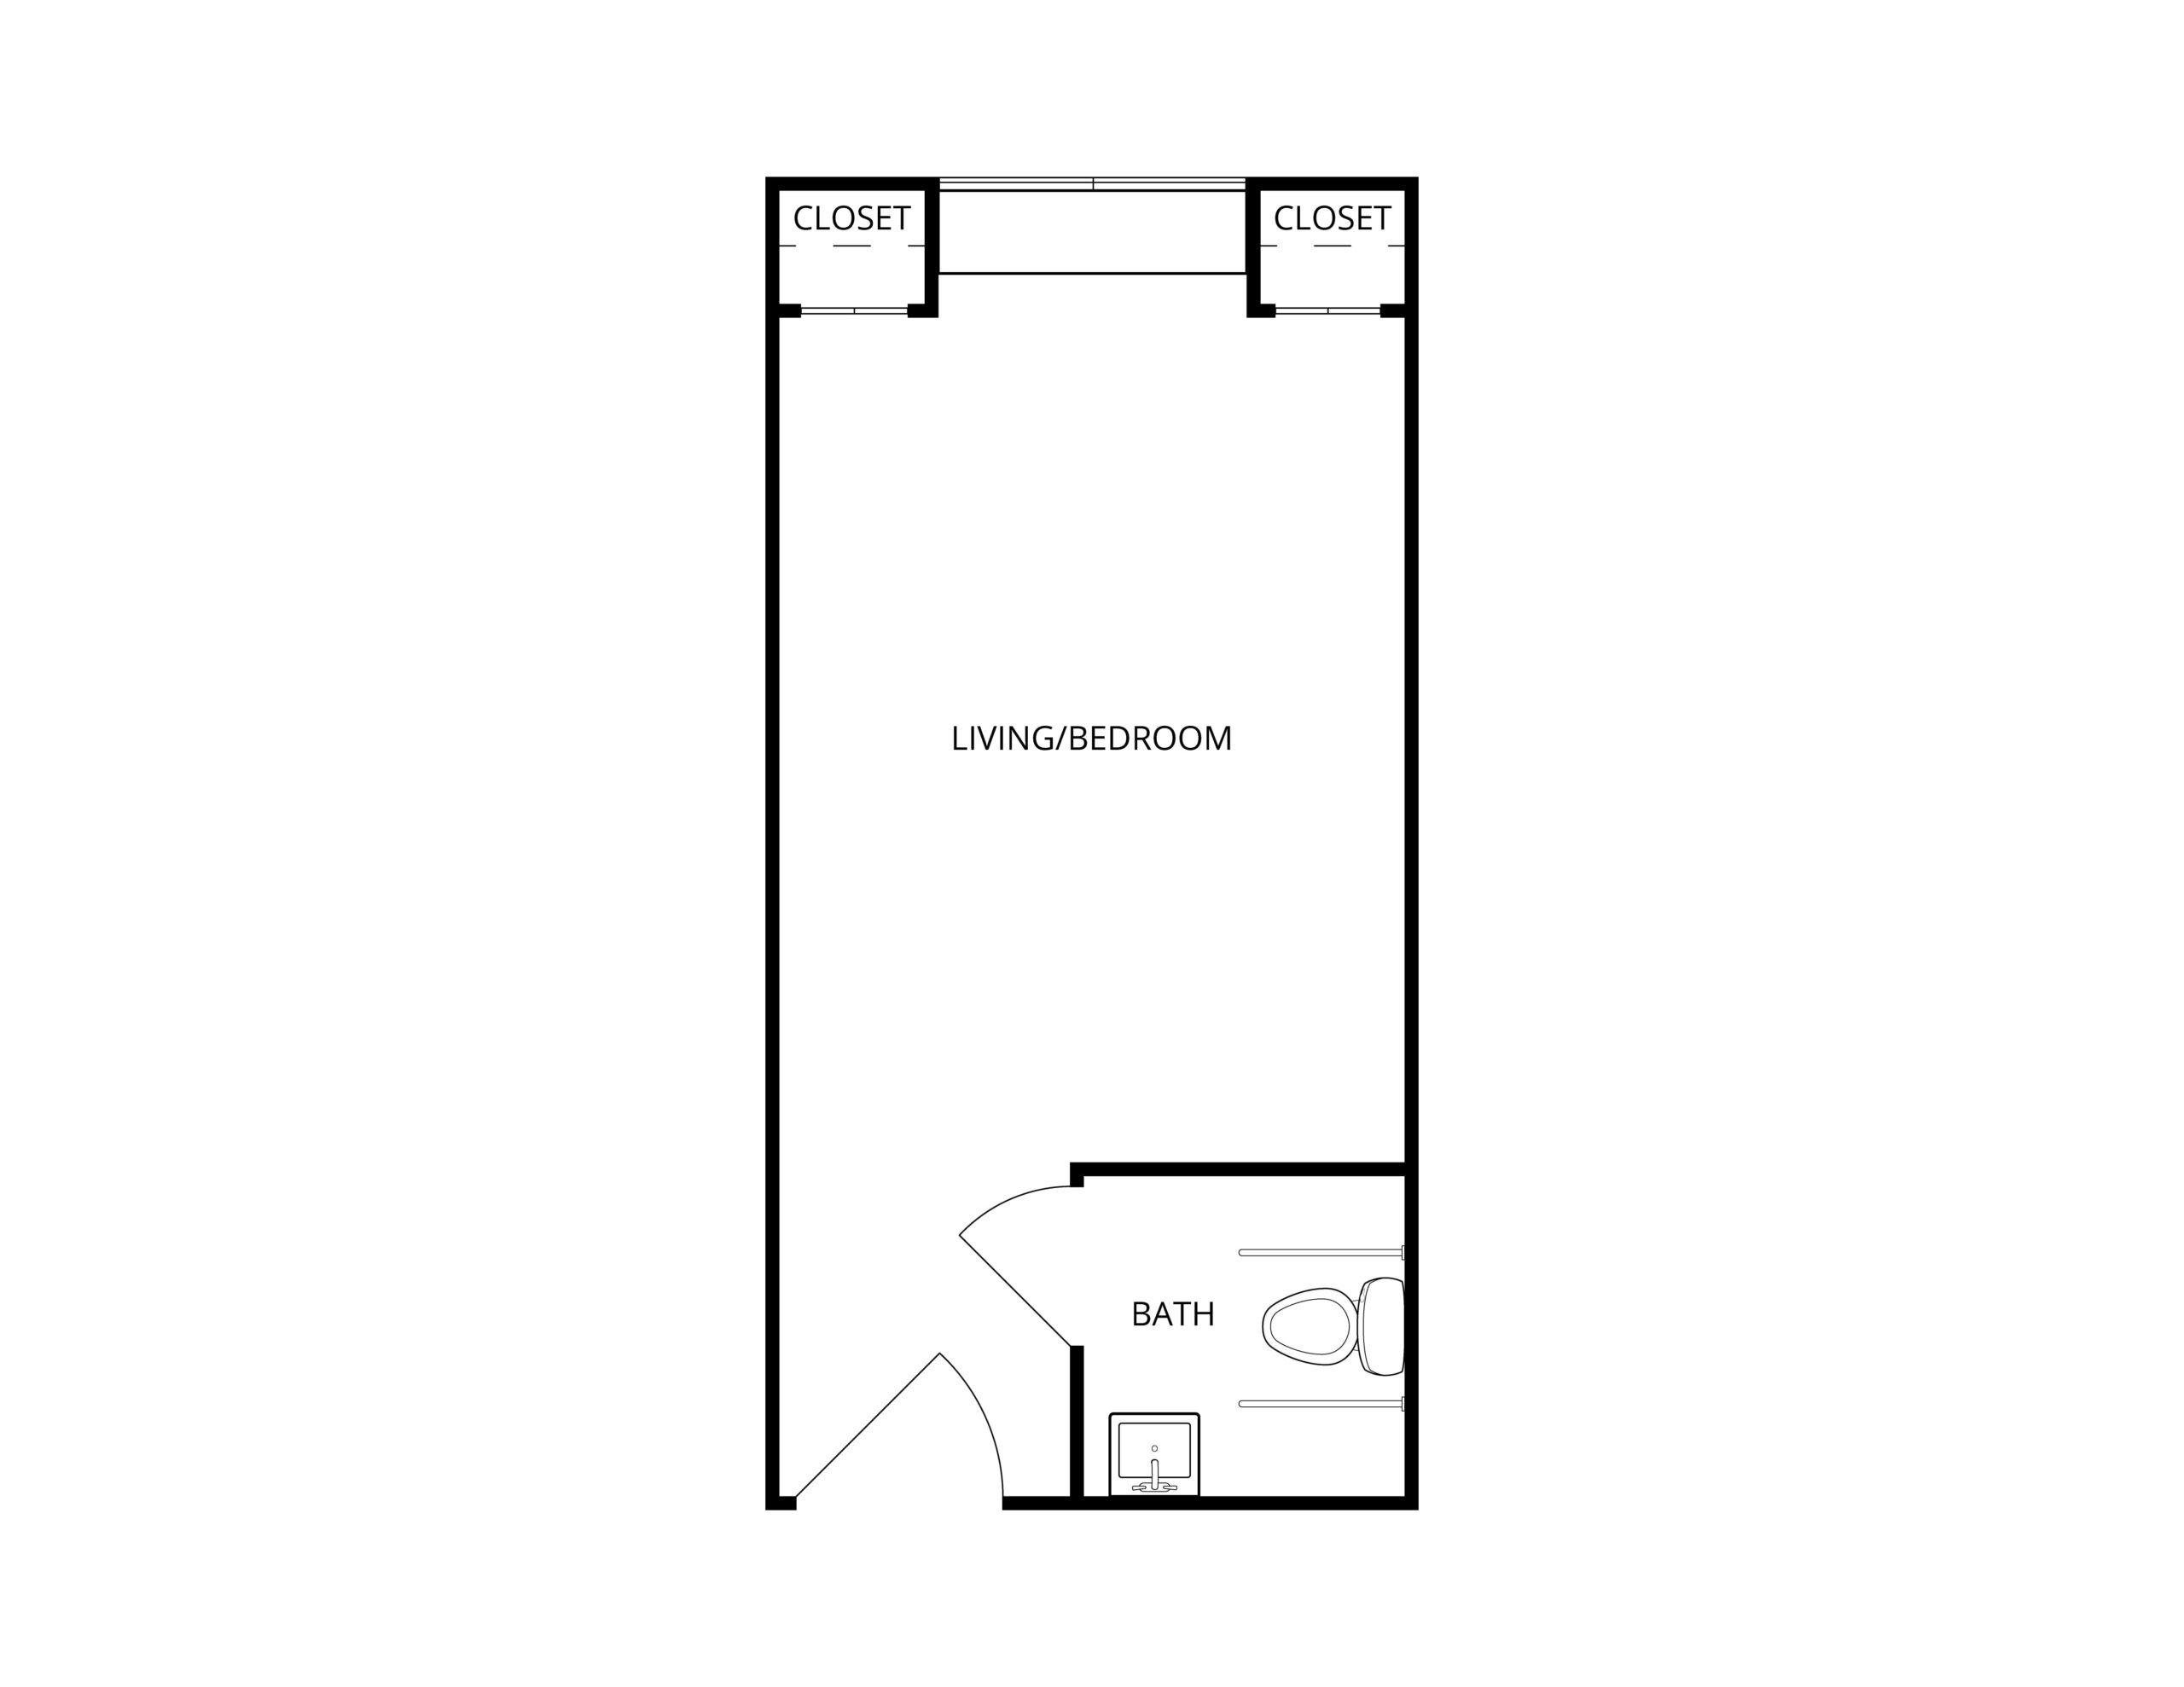
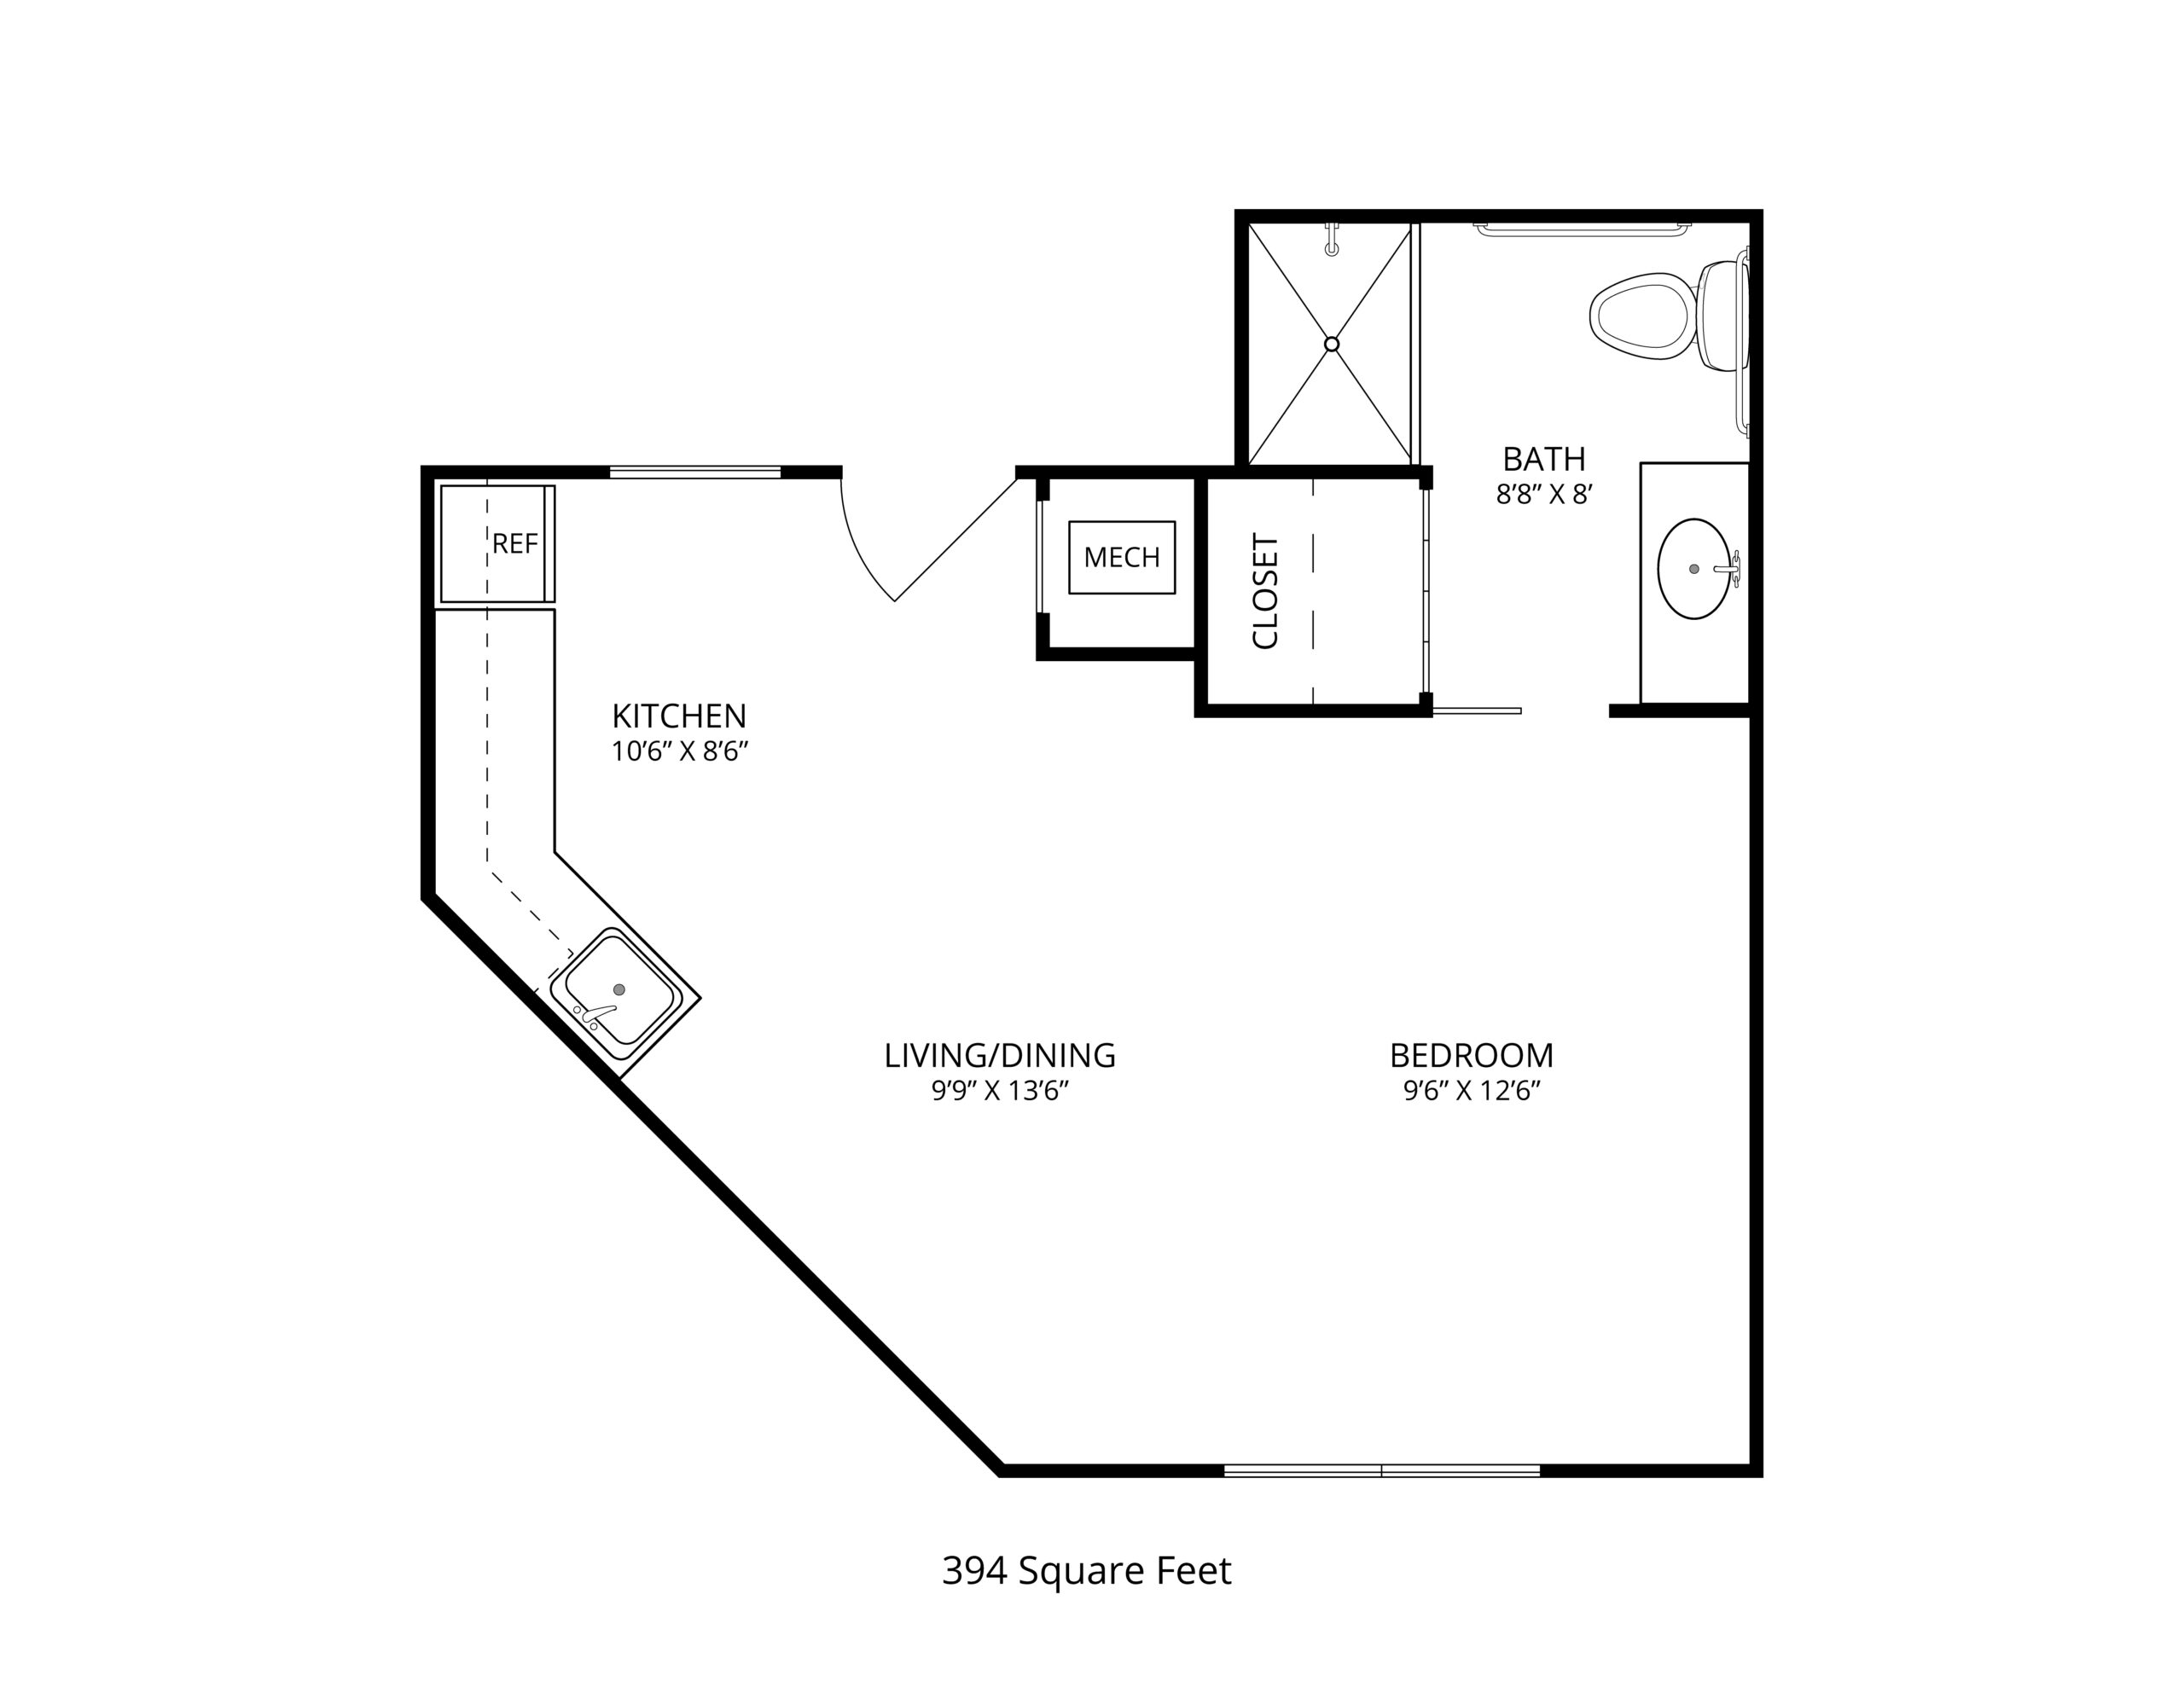
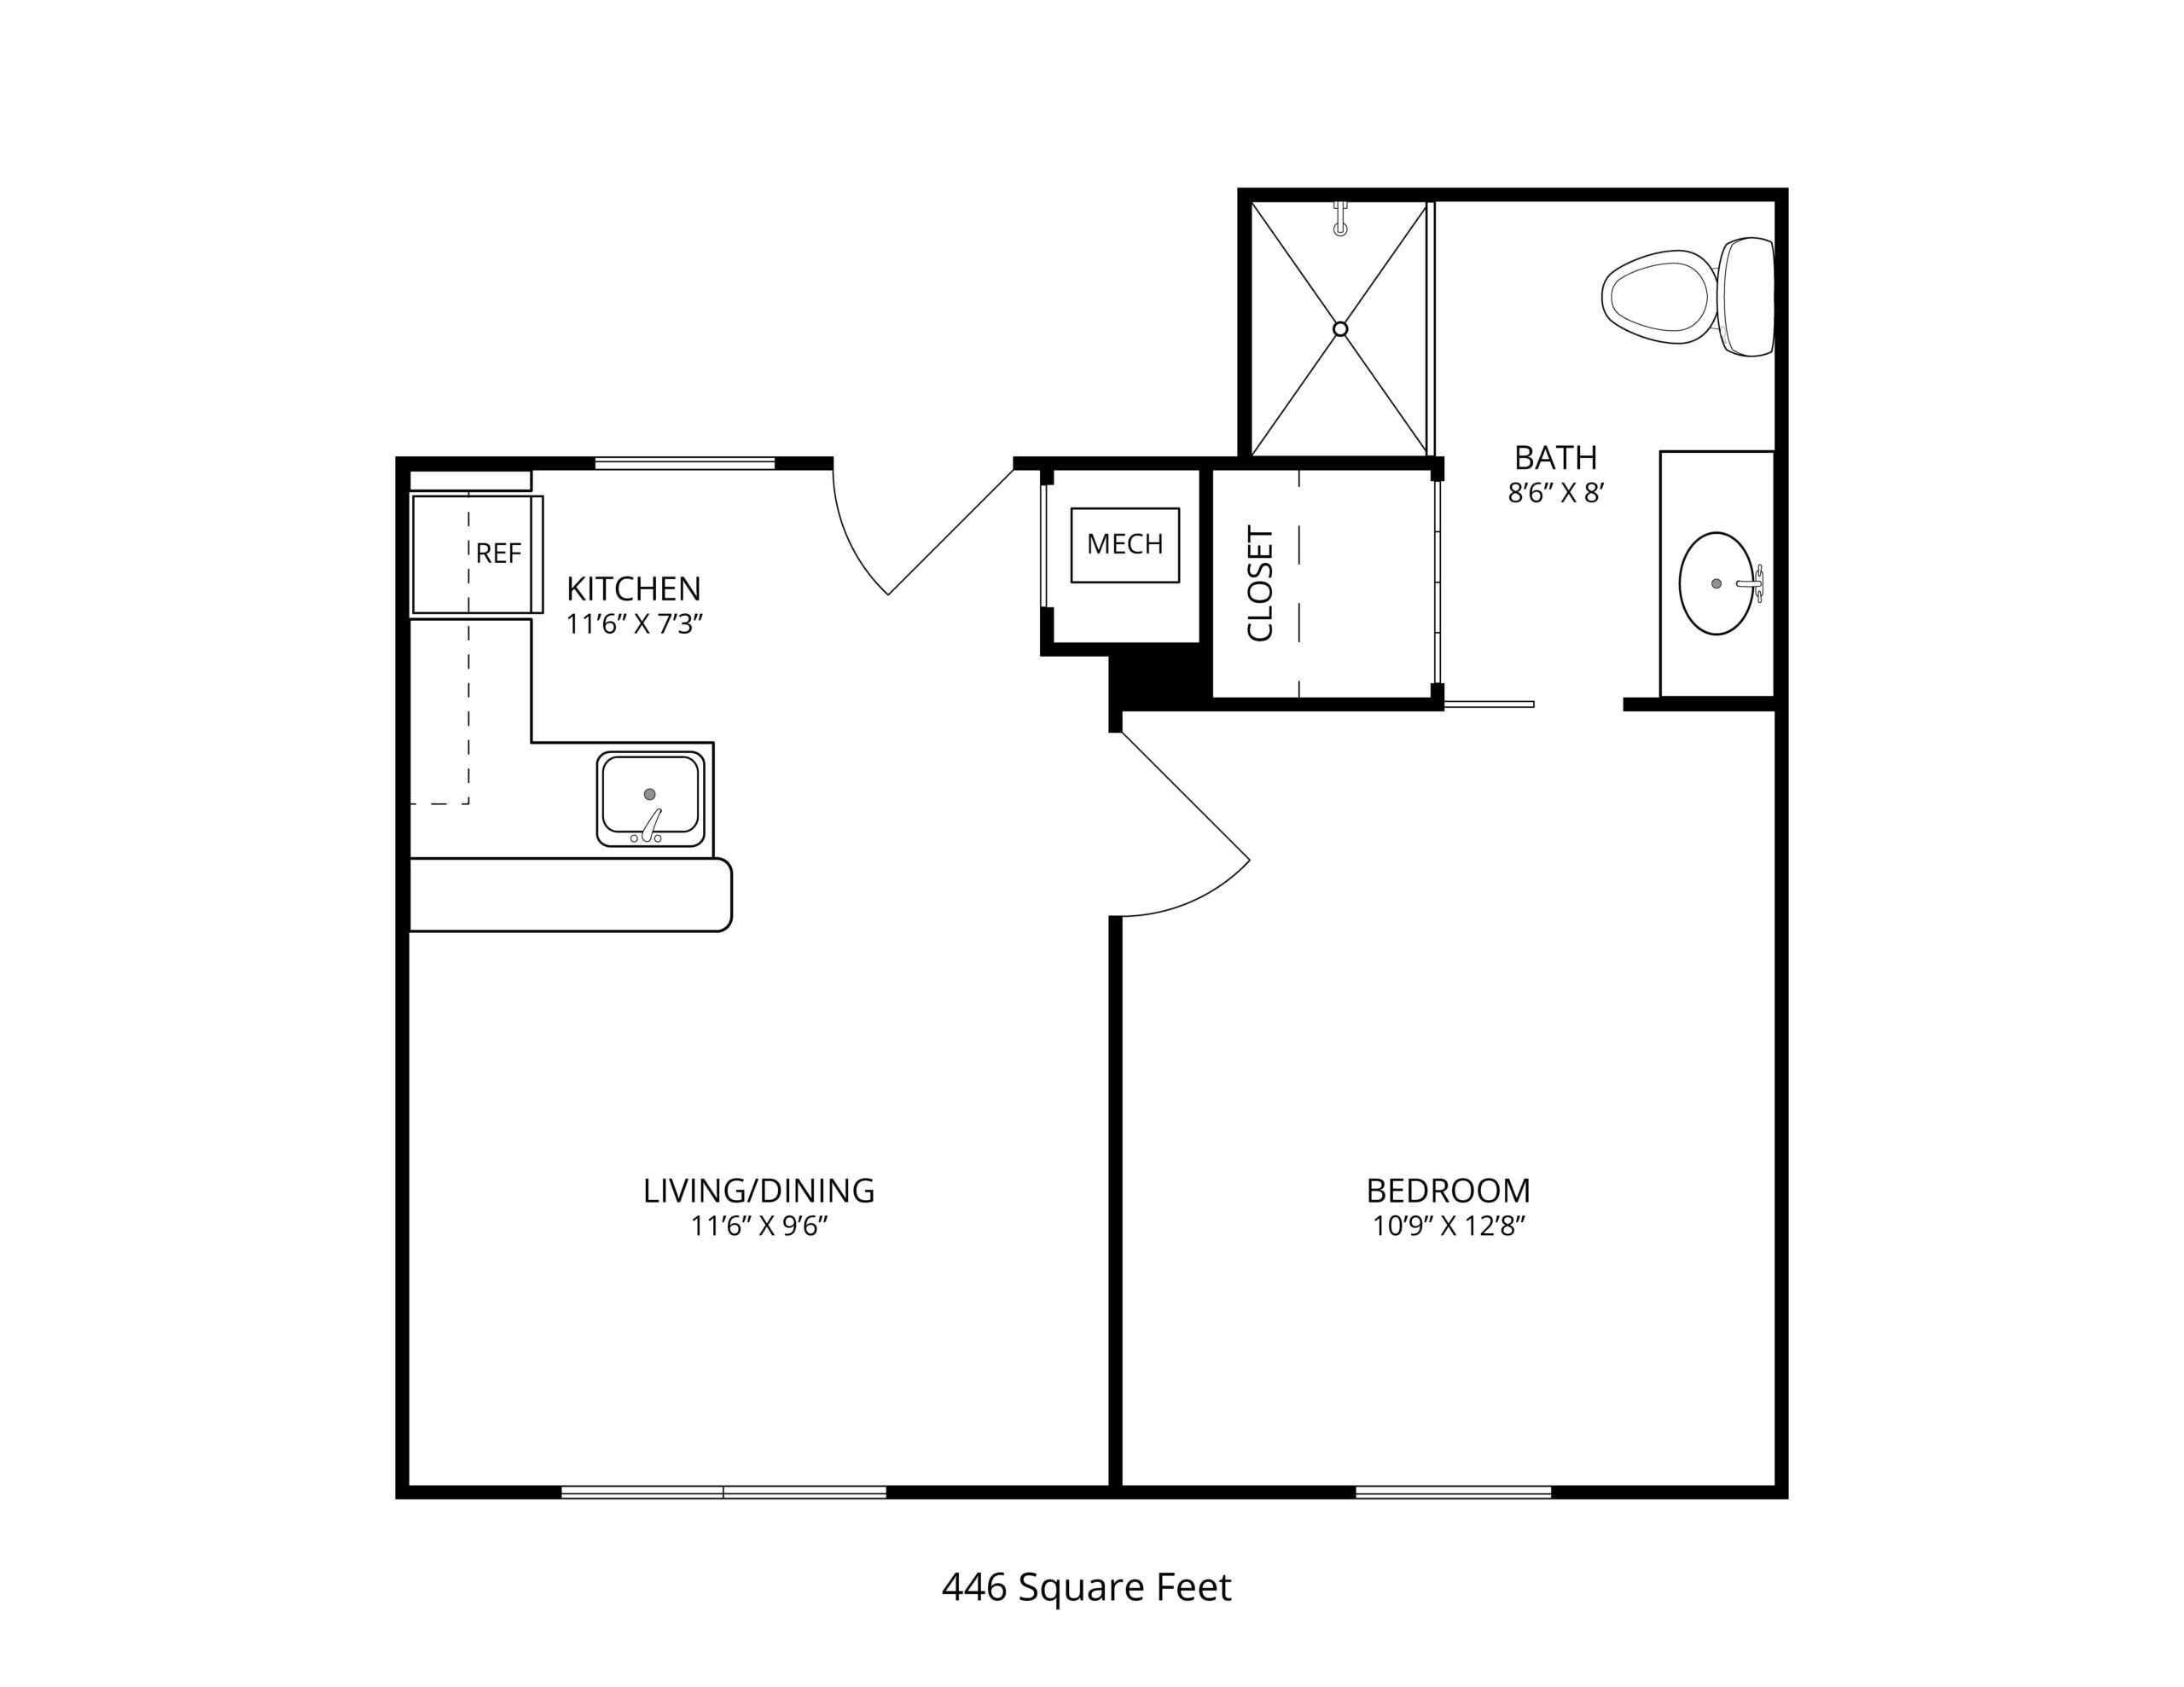
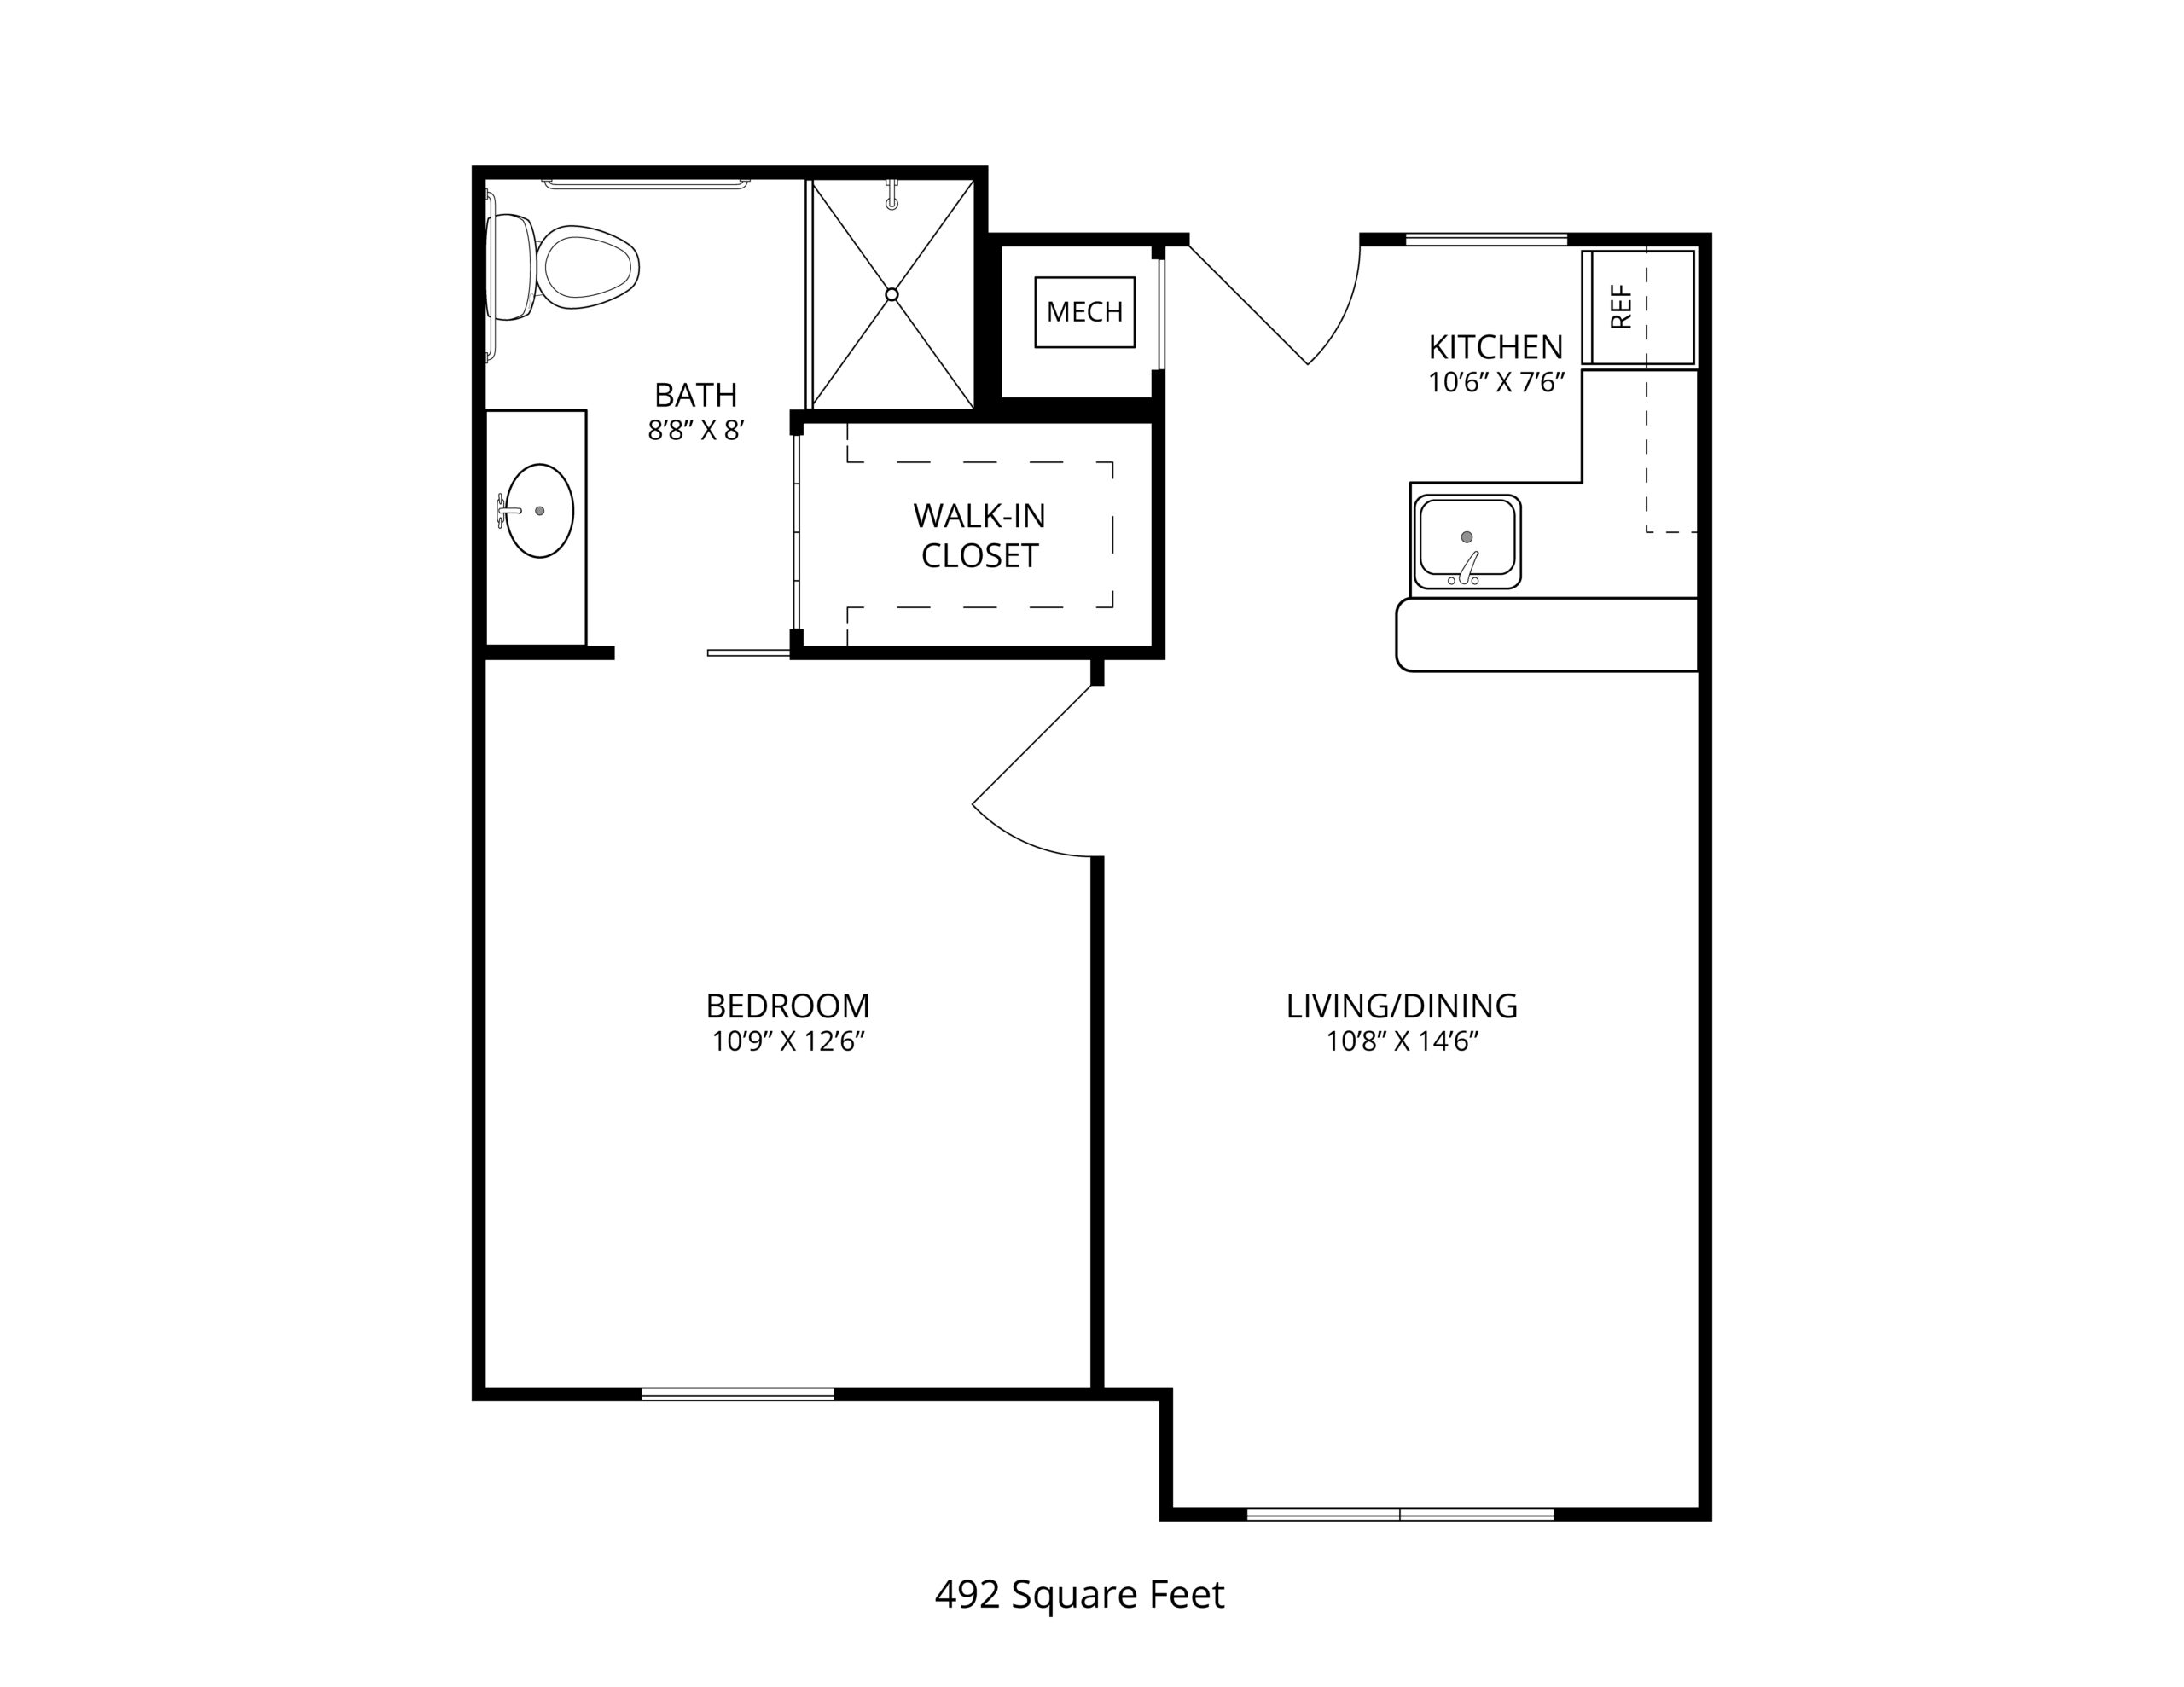
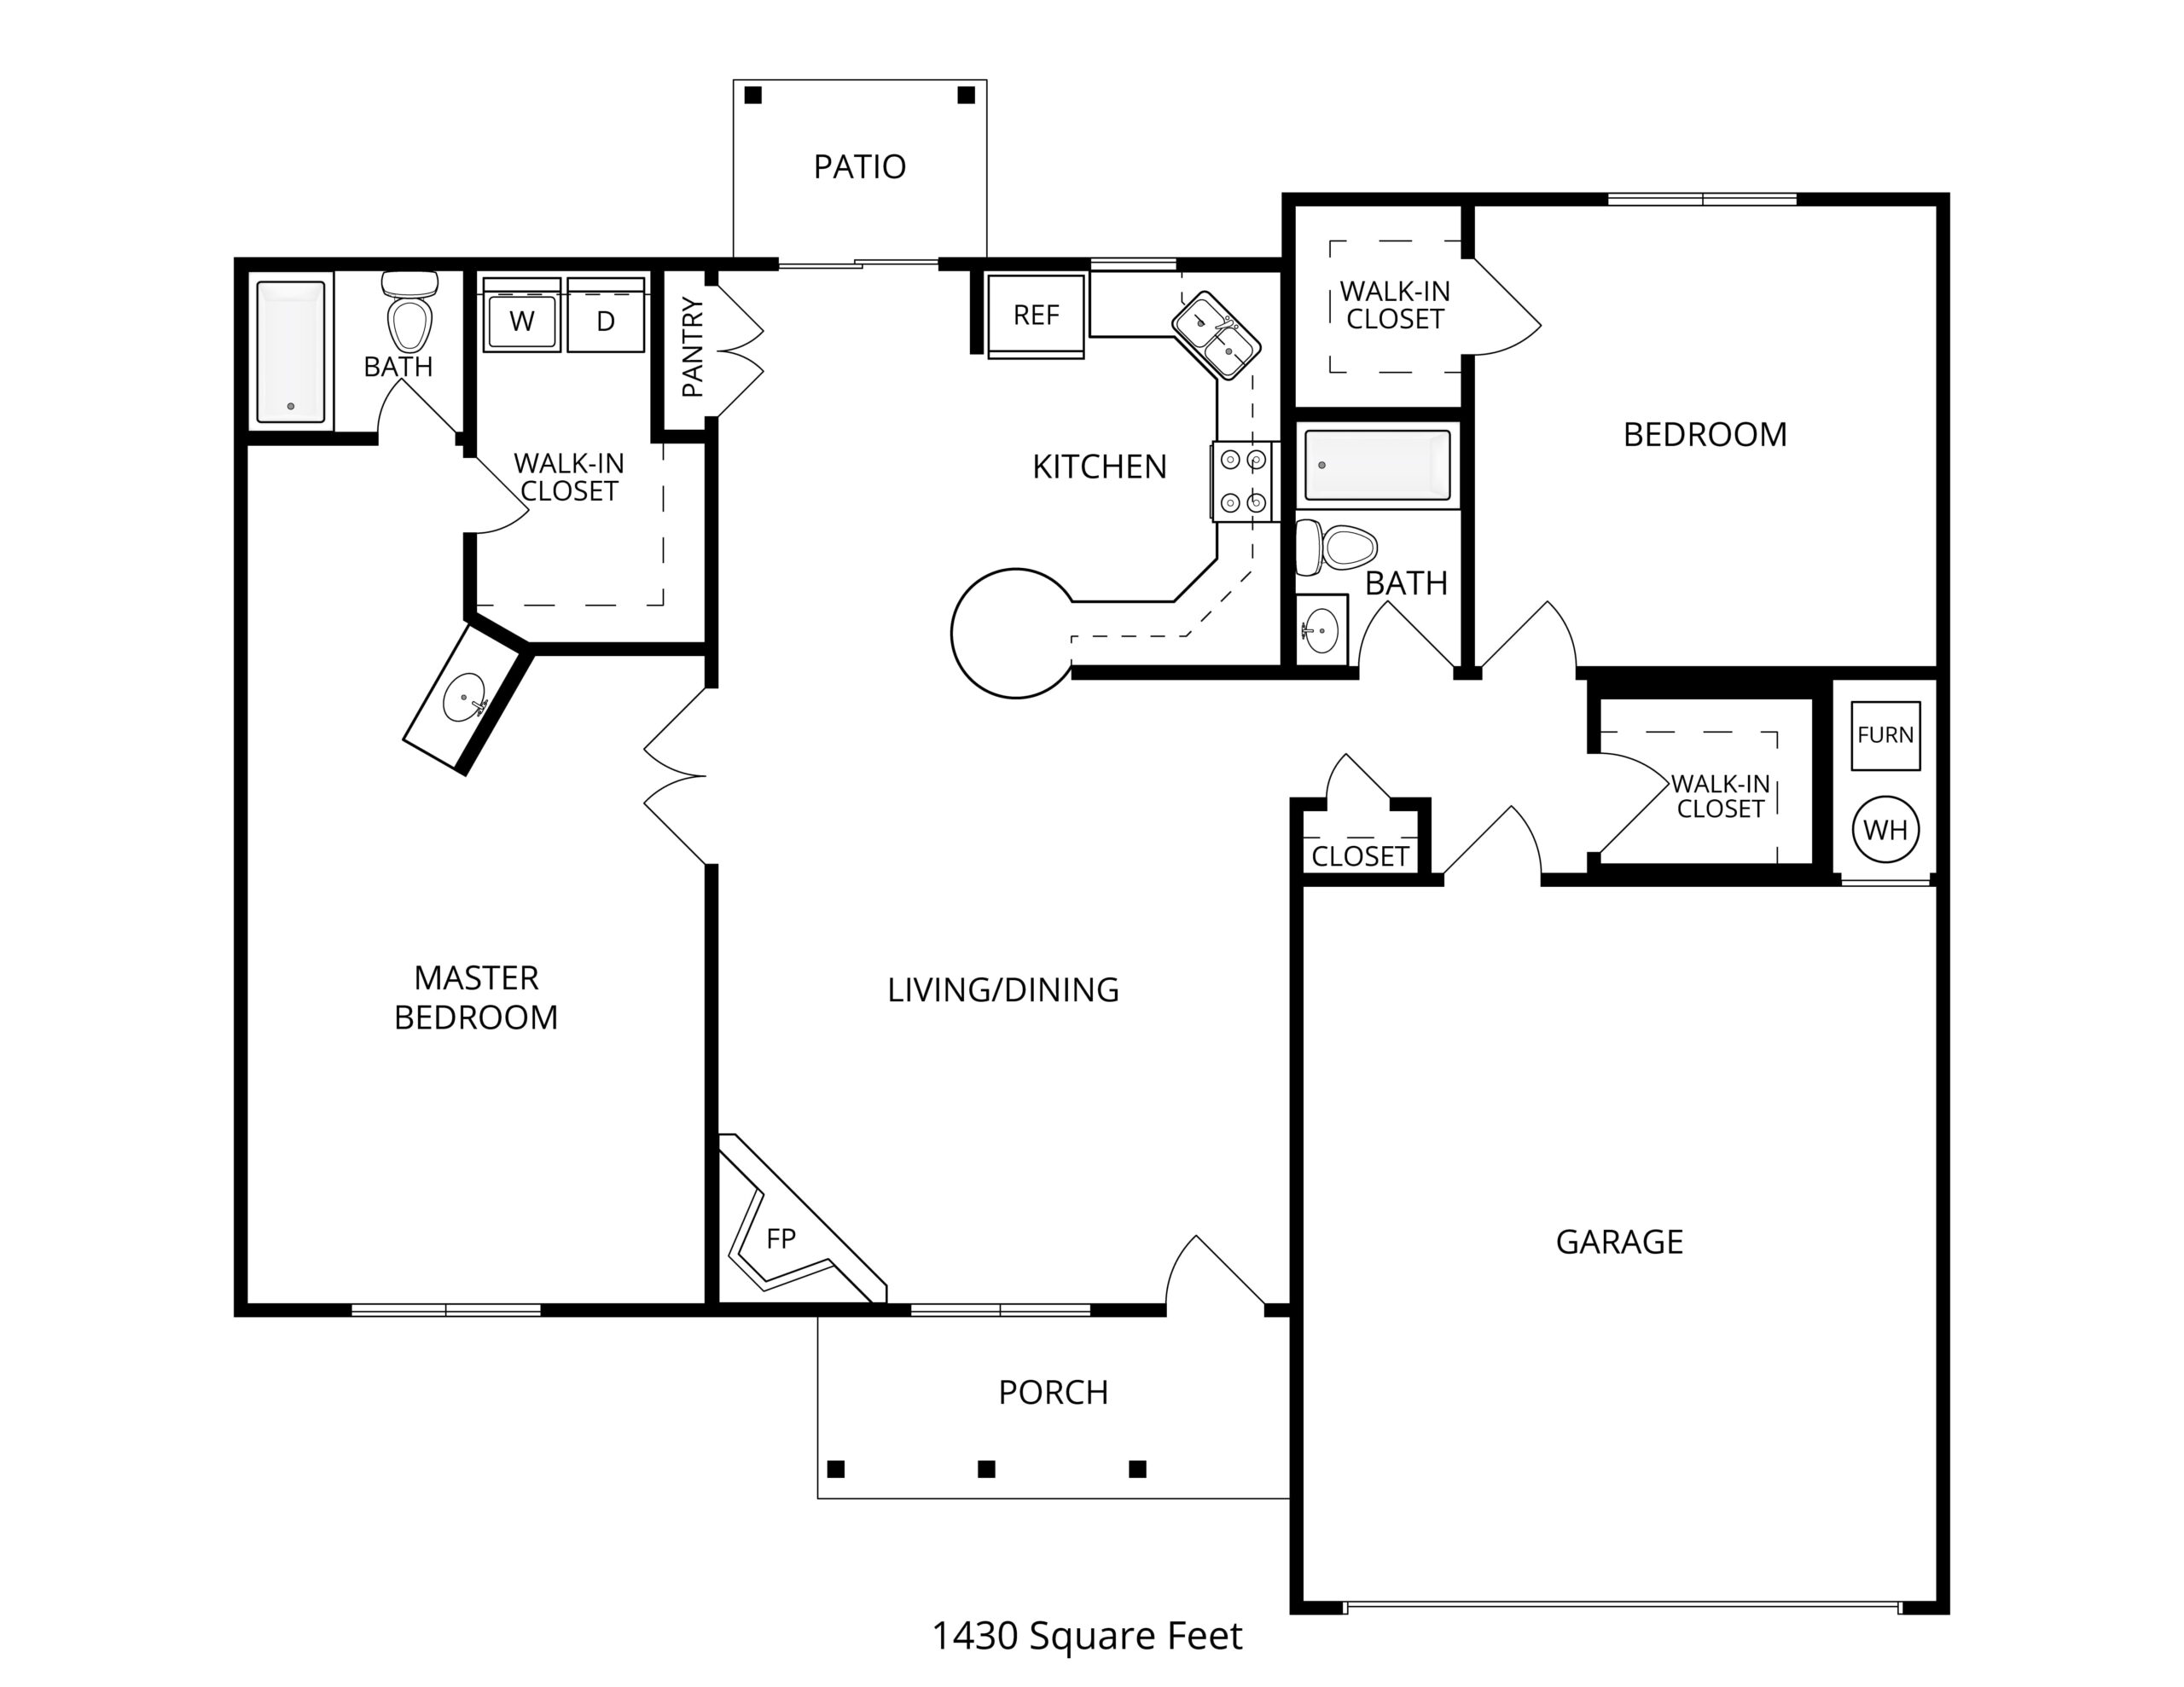
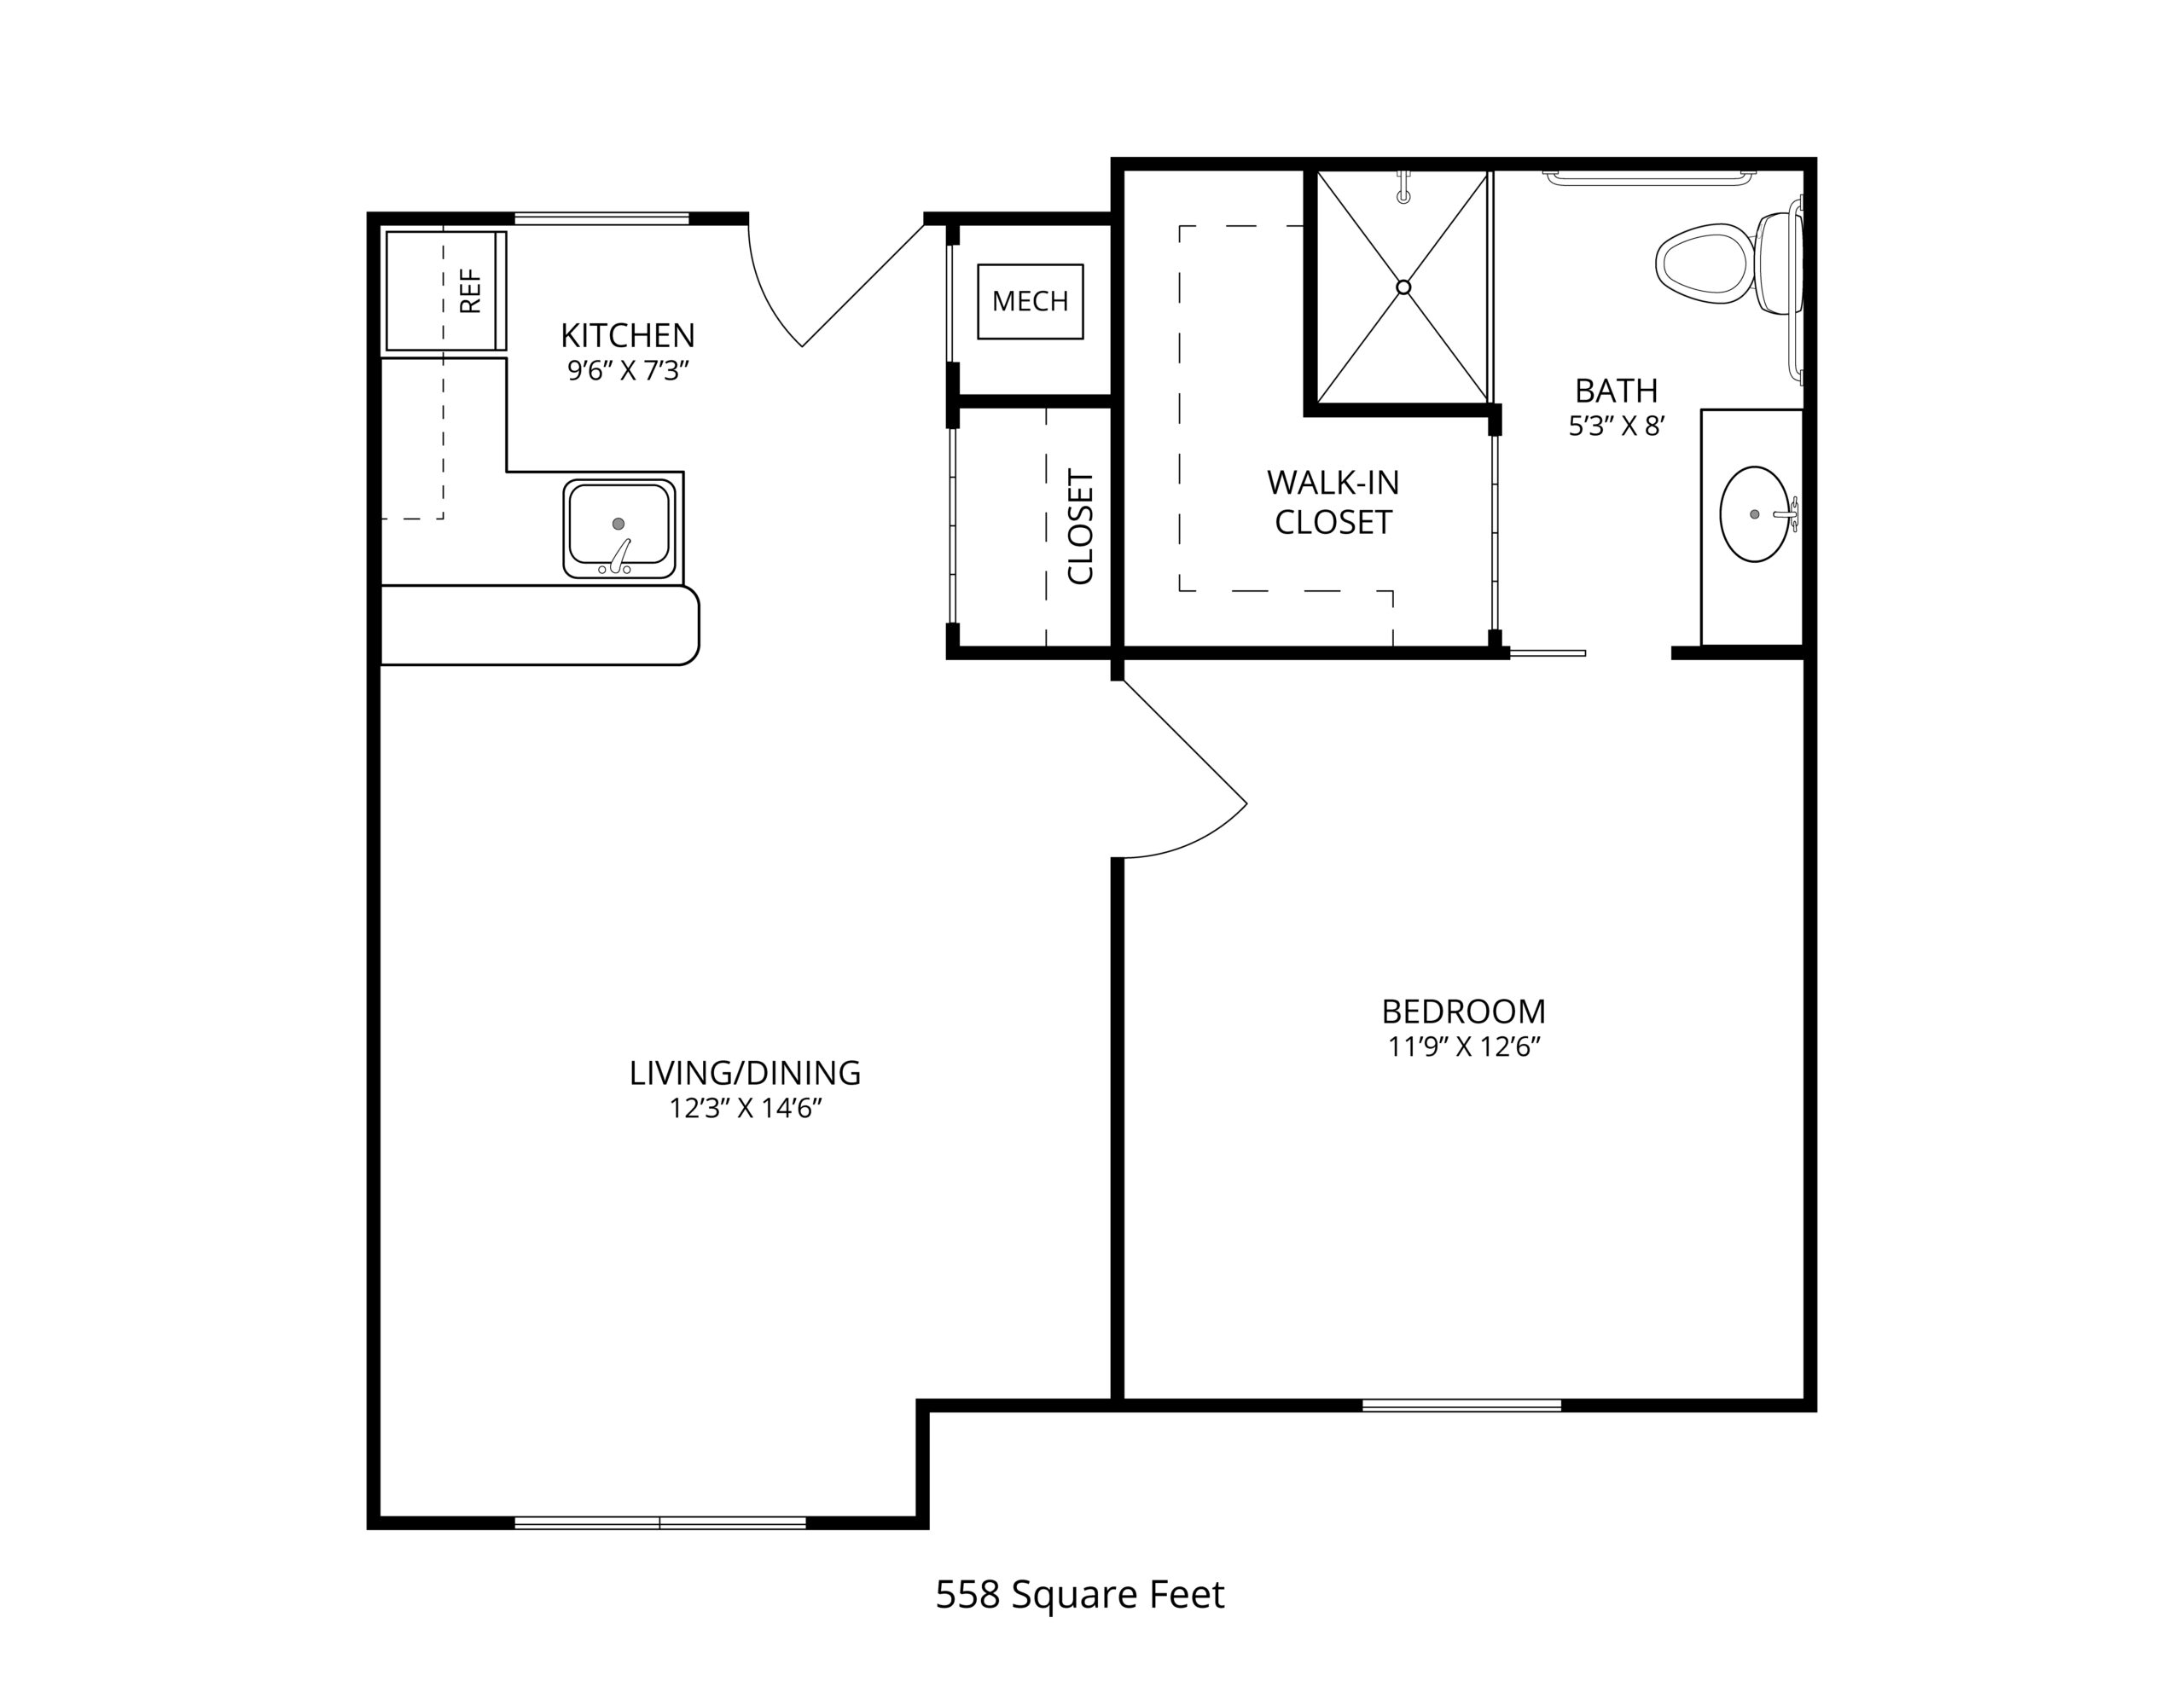
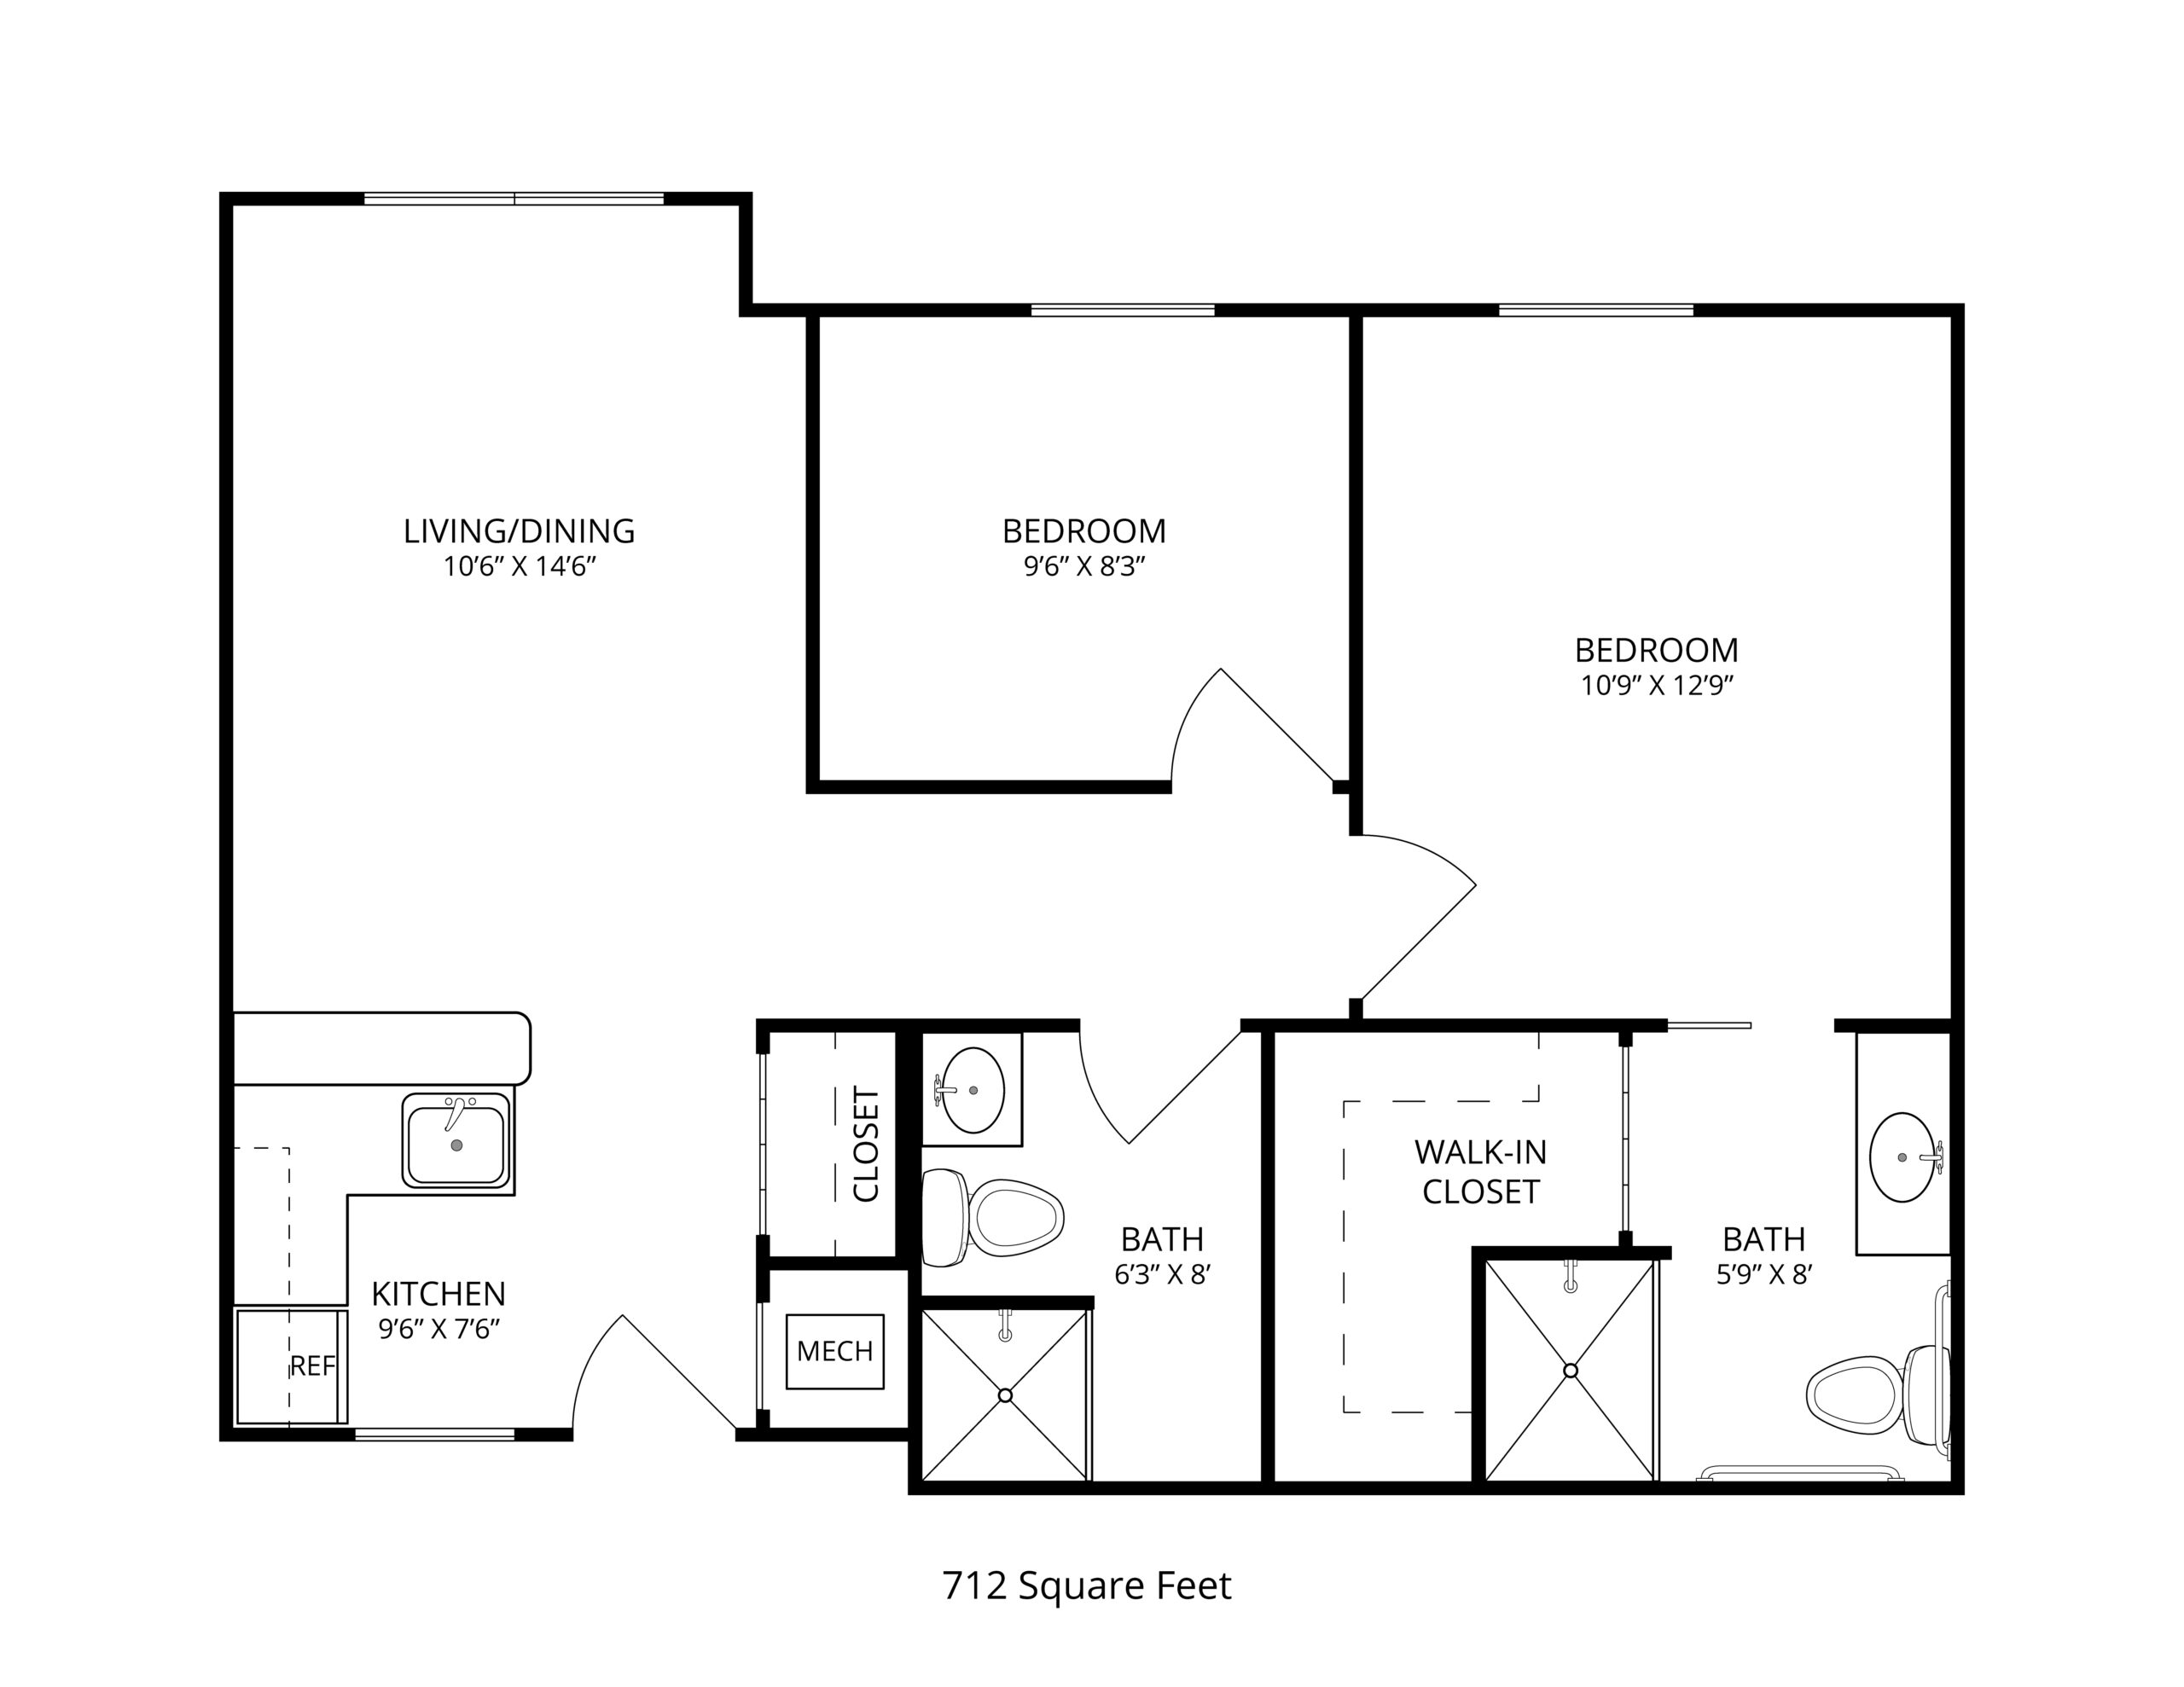
Room Sizes: 206 - 282 / 394 - 712 / 1,430 sq. ft

Housing options icon

Housing Options: Studio / 1 Bed / 2 Bed

Building type icon
Building type icon

Building Type: Single-story

Transportation services icon

Transportation Services

Social and recreational activities icon

Social and Recreational Activities

Security systems icon

Security Systems

Who this home usually serves

TYPE OF STAY

Mix of rehab and long-term care

This home supports both short-term rehab and long-term care, with residents staying for a wide range of durations.

Most new residents arrive under private pay (57% of admissions), and a typical private pay stay runs around 6 - 7 months.

Admissions
366 total

Coverage residents most often arrive under.

Medicare 43%
Private pay 57%
Discharges
322 total

Coverage residents most often leave under.

Medicare 31%
Private pay 69%

Living Spaces & Floor Plans for Ascension Living Via Christi Village Manhattan

Places of interest near Ascension Living Via Christi Village Manhattan

Address 3.0 miles from city center Info Estimated distance in miles from Manhattan's city center to Ascension Living Via Christi Village Manhattan's address, calculated via Google Maps.

Calculate Travel Distance to Ascension Living Via Christi Village Manhattan

Add your location

Address

Compare Nursing Homes around the area

The information below is reported by the Kansas Department for Aging and Disability Services.

Ascension Living Via Christi Village Manhattan
NH
AL
IL
Manhattan (Willow Grove Road) -129 - 10 Studio / 1 Bed / 2 Bed
Homestead of Osawatomie
NH
AL
Osawatomie -40 - 13 Suite
Brookdale Rosehill
NH
AL
Shawnee -92 A+ 54 Studio / 1 Bed
Meadowlark Hills Retirement Community
NH
HC
IL
NC
Manhattan (Meadowlark Road) -134 - 28 1 Bed / 2 Bed / 3 Bed
Ascension Living Via Christi Village McLean
NH
AL
IL
MC
Wichita (Indian Hills) -95 - 47 Studio / 1 Bed

Frequently Asked Questions about Ascension Living Via Christi Village Manhattan

What neighborhood is Ascension Living Via Christi Village Manhattan in?

Ascension Living Via Christi Village Manhattan is in the Willow Grove Road neighborhood of Manhattan.

Who is the owner of Ascension Living Via Christi Village Manhattan?

Ascension Living Via Christi Village Manhattan is legally operated by City Of Manhattan, and administered by Michael Fuchs.

Is Ascension Living Via Christi Village Manhattan in a walkable area?

Ascension Living Via Christi Village Manhattan has a walk score of 10. Car-dependent. Most errands require a car, with limited nearby walkable options.

What is the license number of Ascension Living Via Christi Village Manhattan?

According to KS state health department records, Ascension Living Via Christi Village Manhattan's license number is 175100.

What is the occupancy rate at Ascension Living Via Christi Village Manhattan?

Ascension Living Via Christi Village Manhattan's occupancy is 93%.

Does Ascension Living Via Christi Village Manhattan have different floorplan options?

Yes — see the floorplan options available at Ascension Living Via Christi Village Manhattan on this page.

Does Ascension Living Via Christi Village Manhattan operate as a for-profit or non-profit?

Ascension Living Via Christi Village Manhattan is registered as a non-profit in KS.

Guides for Better Senior Living

Care Cost Calculator: See Prices in Your Area

Nursing Home Data Explorer

Don’t Wait Too Long: 7 Red Flag Signs Your Parent Needs Assisted Living Now

The True Cost of Assisted Living in 2025 – And How Families Are Paying For It

Understanding Senior Living Costs: Pricing Models, Discounts & Financial Assistance