Prairie Sunset Home
Nursing Home, Assisted Living, Independent Living, Palliative Care & Respite Care · Pretty Prairie, KS
CMS overall rating Info CMS (the Centers for Medicare & Medicaid Services) is the federal agency that rates nursing home quality. Its Overall Rating runs from 1 to 5 stars, combining health inspections, staffing, and quality measures, with inspections weighted most heavily.

Prairie Sunset Home

Nursing Home, Assisted Living, Independent Living, Palliative Care & Respite Care · Pretty Prairie, KS
CMS overall rating Info CMS (the Centers for Medicare & Medicaid Services) is the federal agency that rates nursing home quality. Its Overall Rating runs from 1 to 5 stars, combining health inspections, staffing, and quality measures, with inspections weighted most heavily.
Calculator: See prices in your area
Prairie Sunset Home accepts Medicaid, Medicare, and private pay.

Overview of Prairie Sunset Home

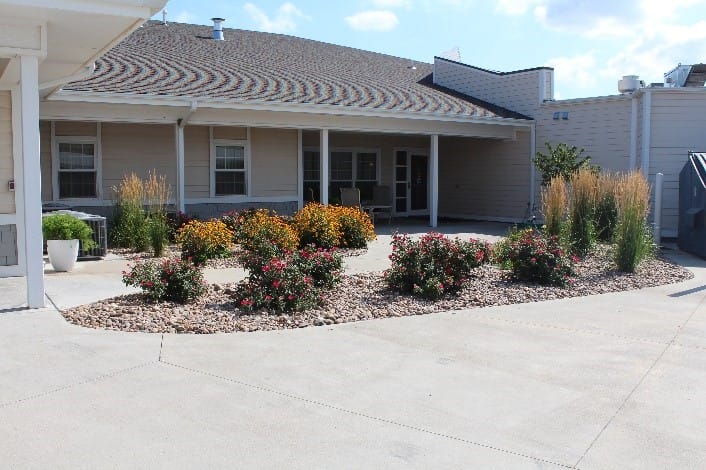
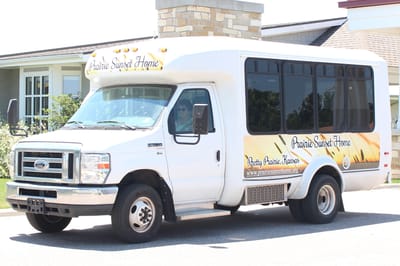
An 88 percent occupancy rate keeps things moving at Prairie Sunset Home, a 43-bed skilled nursing facility that has been operating for 31 years in Pretty Prairie, Kansas. Run by administrator Aaron D. Kelley Jr. and Prairie Sunset Home, Inc., the billing office accepts standard payment setups like private pay, Medicare, and Medicaid. Because the rural location has a Walk Score of 23, visiting family members and guests will need a car to get around and run errands.

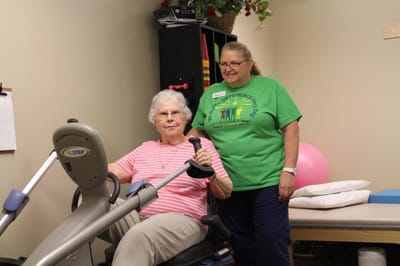
Long-term care is a major part of the daily routine here, with residents staying for an average of 442 days. To keep up with these extended medical needs, the floor staff logs an average of 5 hours and 34 minutes of direct nursing care per resident every day. That daily time breaks down to 3 hours and 43 minutes from nurse aides, 44 minutes from registered nurses, and 36 minutes from licensed practical nurses, all working under a staff with an average caregiver tenure of nearly six years.

While past state reviews flagged issues with care planning, food sanitation, and infection control, the facility cleared those up and was found in full compliance during its most recent inspection.

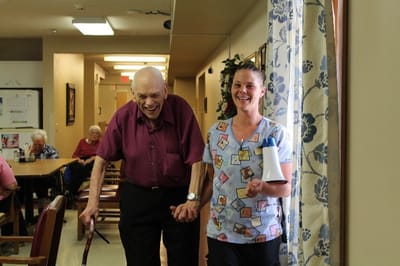
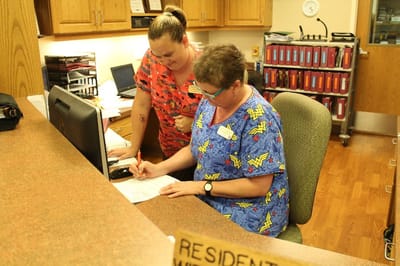
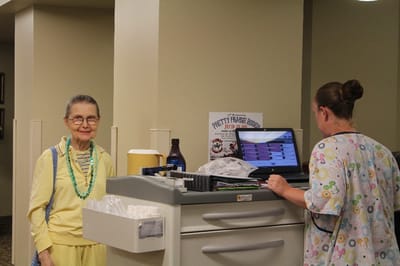
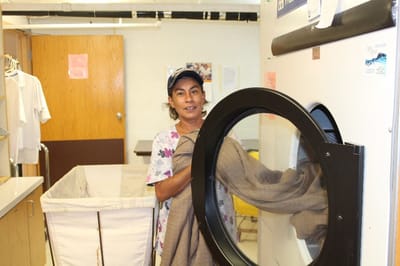
Older adults can call the main desk to set up a walkthrough of the building, look over the therapy areas, and see the kitchen where fresh meals are made daily. The administrative team coordinates these visits while answering questions about laundry options, housekeeping, local transportation, and the scheduled group activities.

Quality ratings

Measured by Centers for Medicare & Medicaid Services (CMS)

Overall rating Info The Overall CMS Rating combines results from health inspections, staffing levels and quality measures. Health inspections carry the most weight. Staffing and quality scores can increase or decrease the final rating based on performance compared to state and national standards.
Health Inspection Info Based on the results of the facility's three most recent standard inspections and any complaint investigations. CMS reviews the number, scope, and severity of deficiencies, with more recent findings weighted more heavily.
Staffing Info Measures average nursing staff hours per resident per day, including Registered Nurses (RNs) and total nursing staff. Ratings are adjusted based on the level of care residents require and are compared to state and national benchmarks.
Quality Measures Info Based on clinical and physical health indicators reported to CMS, such as hospital readmissions, falls, pressure ulcers, and improvements in mobility. These measures reflect how well residents' health needs are being managed.

Staffing hours breakdown

Info Daily nursing hours per resident by staff type, reported to CMS. Higher is generally better — compare this facility to state and national averages to see where staffing stands.

Hours per resident per day — compared to state averages

Total nursing care / resident Info Total adjusted nursing hours per resident per day, combining RN, LPN, and aide time. CMS adjusts this for case-mix so facilities can be fairly compared.
5h 34m per day
vs avg

3 of 6 metrics below state avg

Standout metric Nurse Aide is +39% above state avg
Staff typeHours / Day / Residentvs state avg
Registered Nurse (RN) Info RNs hold the highest nursing license and can assess residents, interpret test results, and direct care plans. More RN hours per day often signals stronger clinical oversight and faster response to health changes. 44m per day ■ Avg State avg: 43m per day · National avg: 41m per day
LPN / LVN Info Licensed Practical Nurses (LPNs) or Licensed Vocational Nurses (LVNs) deliver routine hands-on care — medication administration, wound dressing, and monitoring vital signs. They work under RN supervision and make up a large share of daily bedside care. 36m per day ▼ 11% State avg: 40m per day · National avg: 52m per day
Nurse Aide Info Certified Nurse Aides (CNAs) provide the most direct day-to-day assistance: bathing, dressing, feeding, and mobility. Nurse aide hours are typically the largest staffing category and directly affect residents' quality of life. 3h 43m per day ▲ 39% State avg: 2h 41m per day · National avg: 2h 20m per day
Weekend Total Nursing Info Combined nursing hours (RN + LPN + Nurse Aide) per resident per day on weekends. Staffing often drops on weekends — this figure reveals whether the facility maintains adequate coverage outside of weekday hours. 4h 9m per day ▲ 16% State avg: 3h 35m per day · National avg: 3h 26m per day
Physical Therapist Info Hours per resident per day provided by licensed Physical Therapists (PTs) or PT Assistants. PT services help residents recover mobility after injury or illness and are especially important for post-acute (short-stay) rehabilitation. 1m per day ▼ 59% State avg: 2m per day · National avg: 4m per day
Weekend RN Info Registered nurse hours specifically on weekends. Facilities sometimes reduce RN presence on Saturdays and Sundays — a low weekend RN figure compared to weekday hours can indicate reduced clinical oversight when most administrative staff are absent. 22m per day ▼ 27% State avg: 30m per day · National avg: 28m per day

Capacity and availability

Avg. Length of Stay
442 days
Bed community size
43-bed community Rank #184 / 224Bed count — State benchmarkedThis home is ranked 184th out of 224 homes in Kansas. Shows this facility's certified or reported bed count compared to other Kansas facilities. Larger communities may offer more amenities, programs, and on-site services for residents and families.Rankings are based only on facilities in Kansas that report data for that category. Facilities without available data are excluded from the ranking.Click the rank badge to see the full State ranking.Click here to see the full State ranking.
A moderately sized community that may balance personal attention with shared amenities and social activities.
Years in operation
31 years in operation
A longer operating history, which may indicate experience navigating regulations and delivering ongoing care.
Walk Score
Walk Score: 23 / 100 Rank #294 / 363Walk Score — State benchmarkedThis home is ranked 294th out of 363 homes in Kansas. Shows how walkable this facility's neighborhood is compared to the average Walk Score across Kansas facilities. Higher scores benefit residents, families, and staff.Rankings are based only on facilities in Kansas that report data for that category. Facilities without available data are excluded from the ranking.Click the rank badge to see the full State ranking.Click here to see the full State ranking.
Car-dependent. Most errands require a car, with limited nearby walkable options.

About this community

Occupancy

Occupancy rate
88%
Higher than the Kansas average: 79.5%
Occupied beds
38 / 43
Average occupied beds in Kansas homes 50 beds

License Details

Facility TypeNursing Facility | Assisted Living Facility
StatusActive
CountyReno
License Number175489
CMS Certification Number175489

Ownership & Operating Entity

Prairie Sunset Home is administered by Aaron D. Kelley, Jr..

Owner NamePrairie Sunset Home Incorporated

Staffing

Key information about the people who lead and staff this community.

Leadership

ContactRex Maris, Administrator

Payment & Insurance

2 services
Accept Medicaid
Accept Medicare

Therapy & Rehabilitation

3 services
Rehabilitation Services
Respite Care
Short-Term Rehab

Staffing & Medical

2 services
24-Hour Staffing
Caregiver Turnover: 5.9 years average seniority

Additional Services

1 service
Cottages & Independent Living

Amenities & Lifestyle

Specific ProgramsActivities and Life Enrichment, Housekeeping, Laundry, Maintenance, Food and Nutrition, Rehabilitation & Fitness, Transportation
Volunteer Program
Operating Hours24 hours a day

Contact Prairie Sunset Home

Inspection History

In Kansas, the Department for Aging and Disability Services, Survey and Certification Commission performs the unannounced inspections required for facility licensing and federal certification.

Since 2013 · 13 years of data 293 deficiencies

Inspection Scorecard Info This scorecard compares key inspection, deficiency, and complaint metrics at this facility against the Kansas state average. Metrics rated ≥15% worse than average are highlighted in red; those ≥15% better are highlighted in green.

Since 2013 vs. Kansas state average
Overall vs. KS average 2 Worse Metrics worse than Kansas average:
• Total deficiencies (193% above)
• Deficiencies per year (192% above)
0 Better No metrics in this bucket.
Latest Inspection March 14, 2025

Deficiencies Info Deficiencies are formal regulatory issues recorded during state inspections.

This FacilityKS Averagevs. KS Avg
Total deficiencies Info Formal regulatory issues recorded by inspectors across all inspection types. 293100 This facility has 193% more total deficiencies than a typical Kansas assisted living residence (293 vs. KS avg 100).↑ 193% worse
Deficiencies per year Info Average deficiencies per year since 2013. 22.57.7 This facility has 192% more deficiencies per year than a typical Kansas assisted living residence (22.5 vs. KS avg 7.7).↑ 192% worse

Inspection Reports Summary Info An editor-reviewed summary of the themes and findings across this facility's recent inspection reports.

  • The most recent inspection on April 14, 2025, found the facility in compliance with all regulations and no deficiencies were cited. Prior inspections showed a pattern of deficiencies primarily related to care planning, pain management, staffing documentation, psychotropic medication use, food sanitation, and infection control, with corrective actions implemented after each survey. Complaint investigations were generally unsubstantiated, except for a notable substantiated case in 2019 involving inadequate care for residents with pressure ulcers and urinary incontinence. Enforcement actions occurred in earlier years, including denial of payment for new admissions due to deficiencies related to physical restraints and safety hazards, but no fines or license suspensions were listed in the available reports. The trend indicates improvement over time, with recent inspections showing correction of prior issues and compliance maintained at the latest survey.

Health Inspection History

Inspections since 2021
Total health inspections 3

State average N/A


Last Health inspection on Mar 2025

Total health citations
18

State average N/A

Citations per inspection
6

State average N/A


Health citations are formal notices following inspections when they fail to comply with safety and care standards.

All 18 citations resulted from standard inspections.

Breakdown of citation severity (last 5 years)
Critical health citations
0
In line with State average

State average: N/A


Serious health citations
1
In line with State average

State average: N/A

0 critical citations State average: N/A

1 serious citation State average: N/A

16 moderate citations State average: N/A

1 minor citation State average: N/A
Citations history (last 5 years)
Infection Control moderate citation Mar 05, 2025
Corrected

Nursing Services minor citation Mar 05, 2025
Corrected

Nutrition moderate citation Mar 05, 2025
Corrected

Pharmacy moderate citation Mar 05, 2025
Corrected

Staffing Data

Reporting period: October 1 – December 31, 2025 (Q4 2025). Source: CMS Payroll-Based Journal report.

Total staff 73
Employees 64
Contractors 9
Staff to resident ratio 2.03 : 1
0% compared with State average

State average ratio: 0 : 0

Avg staff/day 32
Average shift 7.1 hours
0% compared with State average

State average: 0 hours

Total staff hours (quarter) 21,026

Nursing staff breakdown

Q4 2025 · Oct 1 – Dec 31 More info This data comes from the CMS Payroll-Based Journal report covering October 1 – December 31, 2025.
Registered Nurse

Manages medical care and health needs.

RN Staff Info All 5 RN Staff are full-time employees. No contractors work on this role. 5
Average shift length Info Average shift length. Calculated as total hours divided by days worked and average staff per day. 7.9 hours
Licensed Practical Nurse

Assists with medical care and medications.

LPN Staff Info All 5 LPN Staff are full-time employees. No contractors work on this role. 5
Average shift length Info Average shift length. Calculated as total hours divided by days worked and average staff per day. 9 hours
Certified Nursing Assistant

Helps with daily care and mobility.

CNA Staff Info All 27 CNA Staff are full-time employees. No contractors work on this role. 27
Average shift length Info Average shift length. Calculated as total hours divided by days worked and average staff per day. 6.8 hours

Contractor staffing

Q4 2025 · Oct 1 – Dec 31 More info This data comes from the CMS Payroll-Based Journal report covering October 1 – December 31, 2025.

Total hours from contractors

4.7%

995 contractor hours this quarter

Physical Therapy Aide: 2 Speech Language Pathologist: 1 Occupational Therapy Aide: 1 Respiratory Therapy Technician: 1 Qualified Social Worker: 1 Physical Therapy Assistant: 1 Medical Director: 1 Occupational Therapy Assistant: 1

Staff by category

Q4 2025 · Oct 1 – Dec 31 More info This data comes from the CMS Payroll-Based Journal report covering October 1 – December 31, 2025.
Certified Nursing Assistant270277,10392100%6.8
Medication Aide/Technician180186,03592100%7.7
Licensed Practical Nurse5052,10492100%9
Registered Nurse5051,71092100%7.9
Dental Services Staff1015169098%5.7
Administrator1015086470%7.9
Clinical Nurse Specialist1014926166%8.1
Occupational Therapy Aide1124285964%6.9
Other Dietary Services Staff1014186267%6.7
Therapeutic Recreation Specialist1013896368%6.2
Nurse Practitioner2023614650%7.8
Qualified Social Worker0113294043%8.2
Speech Language Pathologist0113146773%4.7
Physical Therapy Aide0222075863%3.6
Respiratory Therapy Technician011492022%2.4
Physical Therapy Assistant011271415%1.9
Occupational Therapy Assistant0112433%8
Medical Director0111089%1.2
Mental Health Service Worker101422%1.8
27 Certified Nursing Assistant
% of Days 100%
18 Medication Aide/Technician
% of Days 100%
5 Licensed Practical Nurse
% of Days 100%
5 Registered Nurse
% of Days 100%
1 Dental Services Staff
% of Days 98%
1 Administrator
% of Days 70%
1 Clinical Nurse Specialist
% of Days 66%
2 Occupational Therapy Aide
% of Days 64%
1 Other Dietary Services Staff
% of Days 67%
1 Therapeutic Recreation Specialist
% of Days 68%
2 Nurse Practitioner
% of Days 50%
1 Qualified Social Worker
% of Days 43%
1 Speech Language Pathologist
% of Days 73%
2 Physical Therapy Aide
% of Days 63%
1 Respiratory Therapy Technician
% of Days 22%
1 Physical Therapy Assistant
% of Days 15%
1 Occupational Therapy Assistant
% of Days 3%
1 Medical Director
% of Days 9%
1 Mental Health Service Worker
% of Days 2%

Penalties and fines

Federal penalties imposed by CMS for regulatory violations, including civil money penalties (fines) and denials of payment for new Medicare/Medicaid admissions.

Source: CMS Penalties Database

No penalties in the past 3 years

No civil money penalties or payment denials were reported in the last 3 years.

Quality of care over time

These measures show how residents usually do over time at this home, based on health outcomes and preventive care.

High-risk clinical events score Info A composite score based on pressure ulcers, falls with injury, weight loss, walking ability decline, and activities of daily living decline. 9.6
8% better than State average

State average: 10.5

Functional decline score Info A composite score based on activities of daily living decline, walking ability decline, and incontinence. 22.9
11% worse than State average

State average: 20.7

Long-stay resident measures
Below average State avg: 3.0 Info CMS star rating based on long-stay quality measure performance. 5 stars = significantly above average, 1 star = significantly below average.
Need for Help with Daily Activities Increased Info Percent of long-stay residents whose need for help with daily activities has increased 20.9%
10% worse than State average

State average: 19.0%

Walking Ability Worsened Info Percent of long-stay residents whose ability to move independently worsened 14.5%
25% better than State average

State average: 19.4%

Low Risk Residents with Bowel/Bladder Incontinence Info Percent of low risk long-stay residents who lose control of their bowels or bladder 33.3%
40% worse than State average

State average: 23.8%

Falls with Major Injury Info Percent of long-stay residents experiencing one or more falls with major injury 4.5%
In line with State average

State average: 4.4%

High Risk Residents with Pressure Ulcers Info Percent of long-stay high risk residents with pressure ulcers 6.0%
30% worse than State average

State average: 4.6%

Urinary Tract Infection Info Percent of long-stay residents with a urinary tract infection 4.7%
50% worse than State average

State average: 3.1%

Lost Too Much Weight Info Percent of long-stay residents who lose too much weight 2.4%
54% better than State average

State average: 5.1%

Depressive Symptoms Info Percent of long-stay residents who have depressive symptoms 16.8%
226% worse than State average

State average: 5.2%

Antipsychotic Use Info Percent of long-stay residents who received an antipsychotic medication 10.0%
41% better than State average

State average: 16.9%

Pneumococcal Vaccine Info Percent of long-stay residents assessed and appropriately given the pneumococcal vaccine 97.8%
6% better than State average

State average: 91.9%

Influenza Vaccine Info Percent of long-stay residents assessed and appropriately given the seasonal influenza vaccine 100.0%
5% better than State average

State average: 95.5%

Hospitalizations per 1,000 days Info Number of hospitalizations per 1,000 long-stay resident days. 2.28
24% worse than State average

State average: 1.84

ED visits per 1,000 days Info Number of outpatient emergency department visits per 1,000 long-stay resident days. 3.62
68% worse than State average

State average: 2.16

Short-stay resident measures
Average State avg: 2.6 Info CMS star rating based on short-stay quality measure performance. 5 stars = much above average, 1 star = much below average.
Pneumococcal Vaccine Info Percent of short-stay residents assessed and appropriately given the pneumococcal vaccine 80.3%
6% better than State average

State average: 75.6%

Antipsychotic medication increase Info Percent of short-stay residents who newly received an antipsychotic medication 5.3%
143% worse than State average

State average: 2.2%

Falls with major injury Info Percentage of SNF residents who experience falls with major injury during their stay. 3.0%
294% worse than State average

State average: 0.8%

Ability to care for self at discharge Info Percentage of residents at or above expected ability to care for themselves at discharge. 53.6%
In line with State average

State average: 53.7%

Successful return to home or community Info Rate of successful return to home or community from a skilled nursing facility. 47.6%
6% worse than State average

State average: 50.6%

Breakdown by payment type

Medicare

54% of new residents, usually for short-term rehab.

Typical stay 2 - 3 months

Private pay

18% of new residents, often for short stays.

Typical stay 2 - 3 years

Medicaid

29% of new residents, often for long-term daily care.

Typical stay 2 - 3 years

Facility Characteristics

Source: CMS Long-Term Care Facility Characteristics (Data as of Jan 2026)

Total residents 36
Medicare
2
5.6% of residents
Medicaid
19
52.8% of residents
Private pay or other
15
41.7% of residents
Programs & Services
Residents Group

Residents meet regularly to discuss policies, care quality, and activities

Active Resident Council

Organized group of residents that meets regularly to discuss facility policies, quality of life, and activities.

Finances and operations

Based on CMS SNF Cost Report for fiscal year ending in 12/2023.

Nonprofit
Nonprofit Corporation
Net patient revenue Info Net patient revenue — what the home actually collects for resident care, after contractual allowances, bad debt and discounts are subtracted from its gross charges (CMS cost report, Worksheet G-3). It covers resident care only; money the home earns from other sources is shown separately as "Other income."
$4.0M
Net patient income Info Net patient income: net patient revenue minus the home's total operating expenses. A positive figure means it earns more from resident care than it spends to deliver it; a negative figure means the opposite. It excludes non-operating "other income."
-$527.0K
Nonprofit Nonprofit Corporation
Net patient revenue Info Net patient revenue — what the home actually collects for resident care, after contractual allowances, bad debt and discounts are subtracted from its gross charges (CMS cost report, Worksheet G-3). It covers resident care only; money the home earns from other sources is shown separately as "Other income."
$4.0M
Net patient income Info Net patient income: net patient revenue minus the home's total operating expenses. A positive figure means it earns more from resident care than it spends to deliver it; a negative figure means the opposite. It excludes non-operating "other income."
-$527.0K
Other income Info Money the home earns outside of resident care — such as investments, grants, rentals and other non-operating sources (CMS cost report, Worksheet G-3). It is tracked separately from net patient revenue: it is not part of that figure, and it is not included in net patient income.
$536.4K
Payroll costs Info Staff salaries plus wage-related costs — benefits such as payroll taxes, health insurance and retirement — from the home's own accounting records (CMS cost report, Worksheet A). Contract or agency labor is counted separately, under other operating costs.
$2.8M 70.3% of net patient revenue Info Payroll as a share of revenue: staff salaries and wage-related benefits divided by net patient revenue. A higher figure means more of each revenue dollar goes to staff pay.
Other operating costs Info Everything it costs to run the home apart from payroll — food, utilities, supplies, maintenance, contract labor and administration. Calculated as total operating expense minus payroll (staff salaries and wage-related benefits).
$1.7M
Total costs Info The home's total operating expense for the year — all the costs of running it, salaries included (CMS cost report, Worksheet G-3).
$4.5M

Who this home usually serves

TYPE OF STAY

Mostly short-term rehab stays

Most residents typically stay for a few weeks or months before returning home or moving on.

Most new residents arrive under Medicare (54% of admissions), and a typical Medicare stay runs around 2 - 3 months.

Admissions
28 total

Coverage residents most often arrive under.

Medicare 54%
Private pay 18%
Medicaid 29%
Discharges
29 total

Coverage residents most often leave under.

Medicare 52%
Private pay 10%
Medicaid 38%

Places of interest near Prairie Sunset Home

Address 0.0 miles from city center Info Estimated distance in miles from Pretty Prairie's city center to Prairie Sunset Home's address, calculated via Google Maps.

Calculate Travel Distance to Prairie Sunset Home

Add your location

Address

Compare Nursing Homes around the area

The information below is reported by the Kansas Department for Aging and Disability Services.

Prairie Sunset Home
NH
AL
IL
PC
RC
Pretty Prairie -43 - 23 -
Homestead of Osawatomie
NH
AL
Osawatomie -40 - 13 Suite
Brookdale Rosehill
NH
AL
Shawnee -92 A+ 54 Studio / 1 Bed
Meadowlark Hills Retirement Community
NH
HC
IL
NC
Manhattan (Meadowlark Road) -134 - 28 1 Bed / 2 Bed / 3 Bed
Ascension Living Via Christi Village McLean
NH
AL
IL
MC
Wichita (Indian Hills) -95 - 47 Studio / 1 Bed

Frequently Asked Questions about Prairie Sunset Home

Is Prairie Sunset Home in a walkable area?

Prairie Sunset Home has a walk score of 23. Car-dependent. Most errands require a car, with limited nearby walkable options.

What is the license number of Prairie Sunset Home?

According to KS state health department records, Prairie Sunset Home's license number is 175489.

What is the occupancy rate at Prairie Sunset Home?

Prairie Sunset Home's occupancy is 88%.

Does Prairie Sunset Home operate as a for-profit or non-profit?

Prairie Sunset Home is registered as a non-profit in KS.

Who is the administrator of Prairie Sunset Home?

Jr. Aaron D. Kelley is the administrator of Prairie Sunset Home.

How many beds does Prairie Sunset Home have?

Prairie Sunset Home has 43 beds.

Are there photos of Prairie Sunset Home?

Yes — there are 9 photos of Prairie Sunset Home in the photo gallery on this page.

Guides for Better Senior Living

Care Cost Calculator: See Prices in Your Area

Nursing Home Data Explorer

Don’t Wait Too Long: 7 Red Flag Signs Your Parent Needs Assisted Living Now

The True Cost of Assisted Living in 2025 – And How Families Are Paying For It

Understanding Senior Living Costs: Pricing Models, Discounts & Financial Assistance