

Total staff
197
Employees
154
Contractors
43

We arrange tours, appointments, and even moving support so you don’t have to
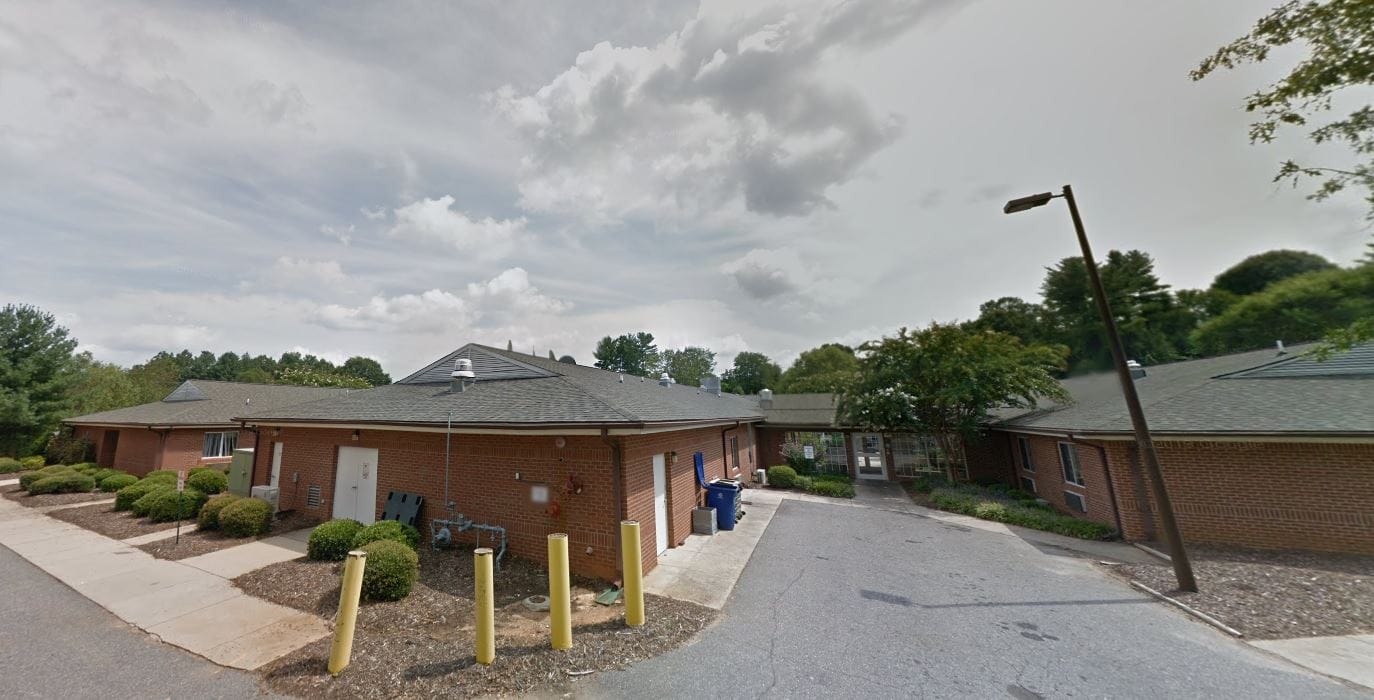
College Pines Health & Rehabilitation in Connelly Springs, North Carolina delivers expert rehabilitative services to seniors requiring a higher level of care than what is available at home. Their physical therapists, nutritionists, and registered nurses work together to develop customized treatment strategies for each patient, ensuring they receive the support they need every step.
The facility is fully equipped with skilled nurses, comfortable beds, and engaging events to make the recovery process more relaxing and delightful. They are immensely committed to providing well-rounded care to its residents, whether for a short-term stay or long-term care. At College Pines Health & Rehabilitation, seniors can expect to find a nurturing and encouraging community that provides a haven while they recover.
| Staff type | Hours / Day / Resident | vs state avg |
|---|---|---|
|
Registered Nurse (RN)
| 29m per day | ▼ 17% State avg: 35m per day · National avg: 41m per day |
|
LPN / LVN
| 50m per day | ▼ 4% State avg: 52m per day · National avg: 52m per day |
|
Nurse Aide
| 2h 35m per day | ▲ 12% State avg: 2h 19m per day · National avg: 2h 21m per day |
|
Weekend Total Nursing
| 3h 23m per day | ■ Avg State avg: 3h 20m per day · National avg: 3h 26m per day |
|
Physical Therapist
| 3m per day | ▼ 40% State avg: 5m per day · National avg: 4m per day |
|
Weekend RN
| 33m per day | ▲ 43% State avg: 23m per day · National avg: 29m per day |
Reporting period: October 1 – December 31, 2025 (Q4 2025). Source: CMS Payroll-Based Journal report.
Manages medical care and health needs.
Assists with medical care and medications.
Helps with daily care and mobility.
Total hours from contractors
4,722 contractor hours this quarter
| Certified Nursing Assistant | 93 | 0 | 93 | 24,147 | 92 | 100% | 8.5 |
| Licensed Practical Nurse | 29 | 0 | 29 | 7,076 | 92 | 100% | 9.2 |
| Registered Nurse | 16 | 0 | 16 | 4,316 | 92 | 100% | 9.3 |
| Speech Language Pathologist | 0 | 15 | 15 | 1,769 | 88 | 96% | 6.7 |
| Other Dietary Services Staff | 4 | 0 | 4 | 1,115 | 92 | 100% | 6.6 |
| RN Director of Nursing | 3 | 0 | 3 | 1,072 | 64 | 70% | 8 |
| Physical Therapy Aide | 0 | 6 | 6 | 1,053 | 82 | 89% | 7.3 |
| Physical Therapy Assistant | 0 | 5 | 5 | 543 | 79 | 86% | 6.1 |
| Respiratory Therapy Technician | 0 | 5 | 5 | 521 | 76 | 83% | 6.8 |
| Qualified Social Worker | 0 | 7 | 7 | 501 | 66 | 72% | 7 |
| Nurse Practitioner | 1 | 0 | 1 | 488 | 61 | 66% | 8 |
| Administrator | 1 | 0 | 1 | 465 | 59 | 64% | 7.9 |
| Mental Health Service Worker | 1 | 0 | 1 | 421 | 54 | 59% | 7.8 |
| Dietitian | 1 | 0 | 1 | 374 | 54 | 59% | 6.9 |
| Nurse Aide in Training | 2 | 0 | 2 | 271 | 27 | 29% | 6.6 |
| Occupational Therapy Aide | 0 | 2 | 2 | 139 | 66 | 72% | 1.9 |
| Occupational Therapy Assistant | 0 | 1 | 1 | 118 | 13 | 14% | 9.1 |
| Medical Director | 0 | 1 | 1 | 60 | 10 | 11% | 6 |
| Clinical Nurse Specialist | 2 | 1 | 3 | 42 | 6 | 7% | 7 |
| Other Physician | 1 | 0 | 1 | 5 | 1 | 1% | 5 |
Includes penalties issued in 2024
Federal penalties imposed by CMS for regulatory violations, including civil money penalties (fines) and denials of payment for new Medicare/Medicaid admissions.
Source: CMS Penalties Database (Data as of Jan 2026)
North Carolina average: $76K
North Carolina average: 2.3
North Carolina average: 0.4
Penalties are imposed by CMS for violations of federal nursing home regulations.
2 penalties in the past 3 years
Multiple penalties were reported in the last 3 years.
Last updated: Jan 2026
These measures show how residents usually do over time at this home, based on health outcomes and preventive care.
North Carolina average: 11.5
North Carolina average: 20.6
North Carolina average: 17.5%
North Carolina average: 23.3%
North Carolina average: 21.4%
North Carolina average: 3.6%
North Carolina average: 6.3%
North Carolina average: 2.6%
North Carolina average: 7.4%
North Carolina average: 4.4%
North Carolina average: 13.4%
North Carolina average: 91.6%
North Carolina average: 94.1%
North Carolina average: 1.77
North Carolina average: 1.82
North Carolina average: 79.9%
North Carolina average: 1.5%
North Carolina average: 78.1%
North Carolina average: 22.9%
North Carolina average: 13.2%
North Carolina average: 0.8%
North Carolina average: 53.7%
North Carolina average: 50.6%
Quality measures are calculated from Minimum Data Set (MDS) assessments. For most measures, lower percentages indicate better care quality.
52% of new residents, usually for short-term rehab.
40% of new residents, often for short stays.
8% of new residents, often for long-term daily care.
Source: CMS Long-Term Care Facility Characteristics (Data as of Jan 2026)
Residents meet regularly to discuss policies, care quality, and activities
Organized group of residents that meets regularly to discuss facility policies, quality of life, and activities.
Data sourced from CMS Long-Term Care Facility Characteristics quarterly report. Payer mix reflects the current resident census by primary payment source.
Historical financial and operational data for College Pines Health and Rehabilitation Center based on CMS SNF Cost Reports.
Most residents typically stay for a few weeks or months before returning home or moving on.
![]() 184.0 miles from city center
184.0 miles from city center
![]() Estimated distance in miles from Connelly Springs's city center to College Pines Health and Rehabilitation Center's address, calculated via Google Maps.
— 7.73 miles to nearest hospital (UNC Health Blue Ridge)
Estimated distance in miles from Connelly Springs's city center to College Pines Health and Rehabilitation Center's address, calculated via Google Maps.
— 7.73 miles to nearest hospital (UNC Health Blue Ridge)
Add your location
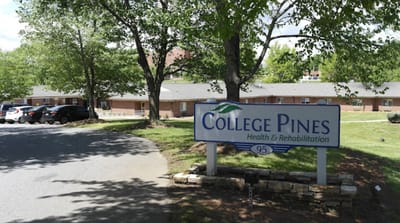
College Pines Health and Rehabilitation Center is located in Connelly Springs, North Carolina.
Here are the financial assistance programs available to residents in North Carolina.
The information below is reported by the North Carolina Department of Health and Human Services, Division of Health Service Regulation.
| Perry Creek Health & Rehabilitation Center |
NH Nursing Home Licensed facility providing 24/7 skilled nursing care for residents with complex, ongoing medical needs. Staffed by RNs, LPNs, and CNAs. Inspected and star-rated annually by CMS. Accepts Medicare (short-term rehab) and Medicaid (long-term care). | Raleigh (Northeast Raleigh) | 90
Facility
90
NC AVG
76
Rank
#130 / 390 | - | - | 3.81 | +33% | -4% | $0 | 2 | 2.0 | - | 84 |
24
Facility
24
NC AVG
33
Rank
#349 / 572 | - | $12.8M | $5.5M | 42.7% | 345003 | ||||
| College Pines Health and Rehabilitation Center |
NH Nursing Home Licensed facility providing 24/7 skilled nursing care for residents with complex, ongoing medical needs. Staffed by RNs, LPNs, and CNAs. Inspected and star-rated annually by CMS. Accepts Medicare (short-term rehab) and Medicaid (long-term care).
AL Assisted Living A licensed, long-term care setting for seniors or individuals with disabilities who need help with daily activities — like bathing, dressing, and medication management — but not 24-hour skilled nursing. Offers housing, meals, and around-the-clock support while aiming to maximize resident independence. | Connelly Springs (Locust Street) | 104
Facility
104
NC AVG
76
Rank
#83 / 390 | - | - | 3.98 | -11% | 0% | $16.8k | 4 | 2.0 | 2 | 92 |
6
Facility
6
NC AVG
33
Rank
#484 / 572 | - | $15.2M | $7.7M | 50.8% | 345446 | ||||
| Capital Nursing And Rehabilitation Center |
NH Nursing Home Licensed facility providing 24/7 skilled nursing care for residents with complex, ongoing medical needs. Staffed by RNs, LPNs, and CNAs. Inspected and star-rated annually by CMS. Accepts Medicare (short-term rehab) and Medicaid (long-term care).
AL Assisted Living A licensed, long-term care setting for seniors or individuals with disabilities who need help with daily activities — like bathing, dressing, and medication management — but not 24-hour skilled nursing. Offers housing, meals, and around-the-clock support while aiming to maximize resident independence.
HC Home Care Professional care delivered in the person's own home — from companionship and errands to skilled nursing and therapy. Allows seniors to age in place. Medicare covers skilled home health when medically necessary.
IL Independent Living Lifestyle-focused communities for older adults offering dining, activities, and transportation with minimal personal care. Best for active, independent seniors who want community without medical support. | Raleigh (East Raleigh) | 125
Facility
125
NC AVG
76
Rank
#37 / 390 | - | - | 3.43 | +1% | -14% | $0 | 14 | 2.8 | - | 100 |
43
Facility
43
NC AVG
33
Rank
#206 / 572 | Liberty Commons Nursing And Rehabilitation Center Of Wake County, LLC | $13.9M | $7.2M | 51.9% | 345202 | ||||
| Sunnybrook Rehabilitation Center |
NH Nursing Home Licensed facility providing 24/7 skilled nursing care for residents with complex, ongoing medical needs. Staffed by RNs, LPNs, and CNAs. Inspected and star-rated annually by CMS. Accepts Medicare (short-term rehab) and Medicaid (long-term care). | Raleigh (East Raleigh) | 95
Facility
95
NC AVG
76
Rank
#122 / 390 | 89.5% | +17% | 3.86 | +9% | -3% | $72.9k | 15 | 2.1 | 4 | 86 |
49
Facility
49
NC AVG
33
Rank
#161 / 572 | Hannah Mcintyre | $14.6M | $6.3M | 42.9% | 345077 | ||||
| Litchford Falls Health & Rehabilitation Center |
NH Nursing Home Licensed facility providing 24/7 skilled nursing care for residents with complex, ongoing medical needs. Staffed by RNs, LPNs, and CNAs. Inspected and star-rated annually by CMS. Accepts Medicare (short-term rehab) and Medicaid (long-term care). | Raleigh (North Raleigh) | 114
Facility
114
NC AVG
76
Rank
#70 / 390 | - | - | 3.53 | -34% | -11% | $168.7k | 16 | 3.2 | 3 | 86 |
51
Facility
51
NC AVG
33
Rank
#137 / 572 | Universal Health Care / Raleigh, Inc | $8.0M | $5.0M | 61.9% | 345499 |
College Pines Health and Rehabilitation Center is in the Locust Street neighborhood.
College Pines Health and Rehabilitation Center has a walk score of 6. Car-dependent. Most errands require a car, with limited nearby walkable options.
Yes — there are 2 photos of College Pines Health and Rehabilitation Center in the photo gallery on this page.
(828) 580-6800 will put you in contact with the team at College Pines Health and Rehabilitation Center.
Yes — College Pines Health and Rehabilitation Center is a CMS-certified provider of Medicare and Medicaid.
Care Cost Calculator: See Prices in Your Area
Nursing Home Data Explorer
Don’t Wait Too Long: 7 Red Flag Signs Your Parent Needs Assisted Living Now
The True Cost of Assisted Living in 2025 – And How Families Are Paying For It
Understanding Senior Living Costs: Pricing Models, Discounts & Financial Assistance


Thank you for your interest!
Our team will be in touch shortly to help with next steps.
