Capital Nursing And Rehabilitation Center

Nursing Home, Skilled Nursing, Hospice Care, Respite Care & Nursing Care · Raleigh, NC
CMS overall rating Info The Overall CMS Rating is scored from 1 to 5 stars and combines results from health inspections, staffing levels, and quality measures. Health inspections carry the most weight. Staffing and quality scores can increase or decrease the final rating based on performance compared to state and national standards.
Capital Nursing And Rehabilitation Center

Nursing Home in Raleigh

CMS overall rating Info The Overall CMS Rating is scored from 1 to 5 stars and combines results from health inspections, staffing levels, and quality measures. Health inspections carry the most weight. Staffing and quality scores can increase or decrease the final rating based on performance compared to state and national standards.
Calculator: See prices in your area
Capital Nursing And Rehabilitation Center accepts Medicare, Medicaid, and private pay.

Overview of Capital Nursing and Rehabilitation Center

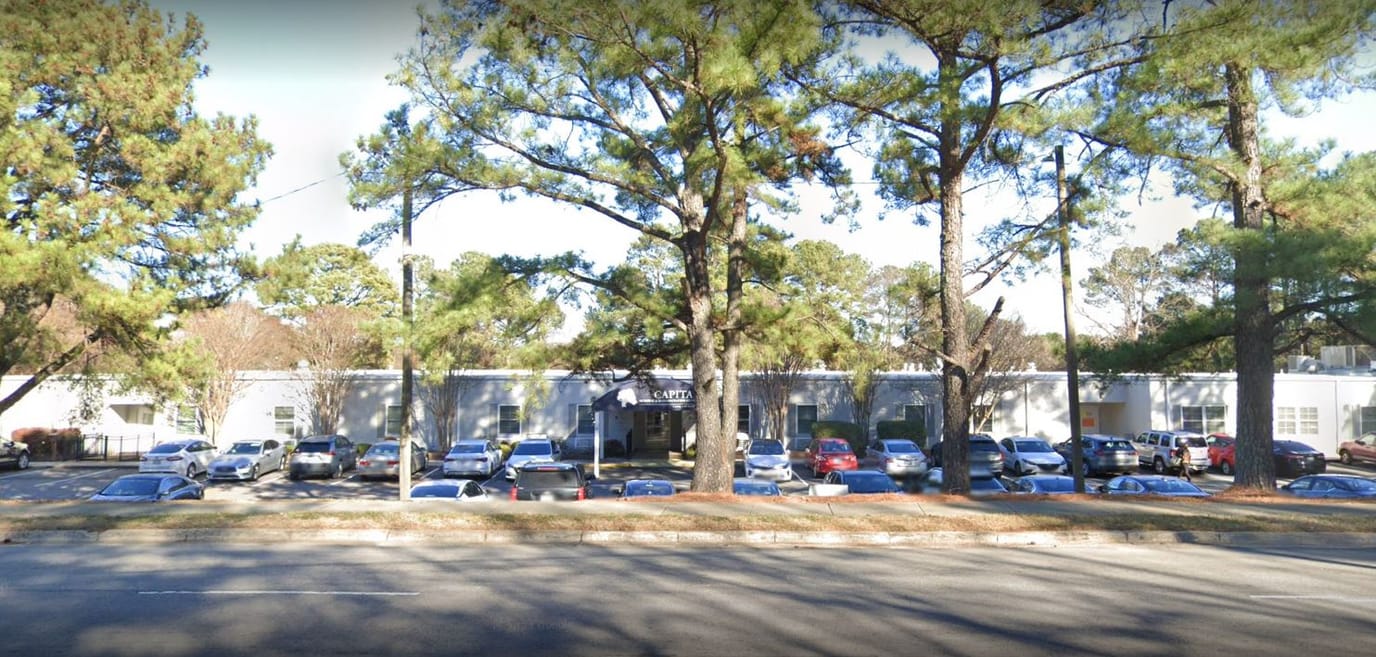
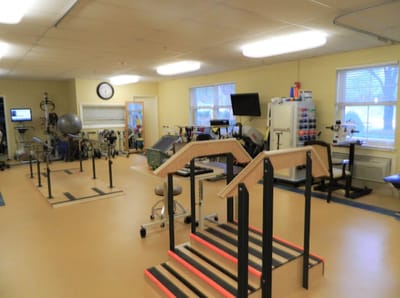
Capital Nursing and Rehabilitation Center is an award-winning senior living community in Holston Lane, Raleigh, NC, that is dedicated to improving seniors’ quality of life and provides a wide array of care services. These include short-term rehabilitation, skilled nursing, outpatient therapy, hospice care, palliative care, respite care, and long-term care. A team of compassionate and highly trained professionals welcomes seniors and takes care of their needs and aspirations.

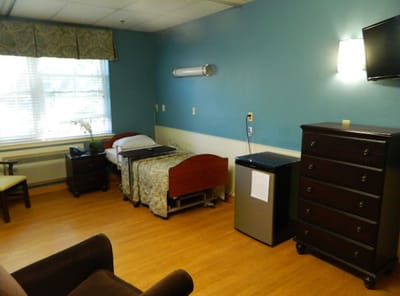
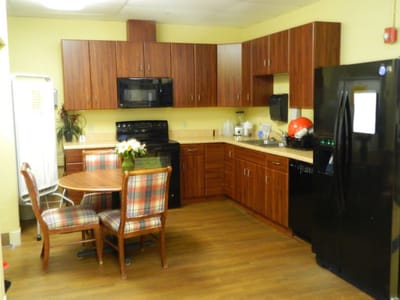
Remain well-engaged and do the things you enjoy with a well-thought-of calendar of enriching activities and exciting programs. Filled with extensive amenities, Capital Nursing and Rehabilitation Center strives to provide a comfortable and safe retirement for seniors to thrive and live their lives to the fullest.

(919) 231-6045

Quality ratings

Measured by Centers for Medicare & Medicaid Services (CMS)

Overall rating Info The Overall CMS Rating combines results from health inspections, staffing levels and quality measures. Health inspections carry the most weight. Staffing and quality scores can increase or decrease the final rating based on performance compared to state and national standards.
▲ 34.7% Above NC avg.
Health Inspection Info Based on the results of the facility's three most recent standard inspections and any complaint investigations. CMS reviews the number, scope, and severity of deficiencies, with more recent findings weighted more heavily.
▲ 17.6% Above NC avg.
Staffing Info Measures average nursing staff hours per resident per day, including Registered Nurses (RNs) and total nursing staff. Ratings are adjusted based on the level of care residents require and are compared to state and national benchmarks.
▼ 39.8% Below NC avg.
Quality Measures Info Based on clinical and physical health indicators reported to CMS, such as hospital readmissions, falls, pressure ulcers, and improvements in mobility. These measures reflect how well residents' health needs are being managed.
▲ 12.4% Above NC avg.

Staffing hours breakdown

Info Daily nursing hours per resident by staff type, reported to CMS. Higher is generally better — compare this facility to state and national averages to see where staffing stands.

Hours per resident per day — compared to North Carolina state averages

Total nursing care / resident Info This home is ranked 49th out of 60 homes in North Carolina.

Total adjusted nursing hours per resident per day, combining RN, LPN, and aide time. CMS adjusts this for case-mix so facilities can be fairly compared.
3h 26m per day
Rank #49 / 60Nurse hours — state benchmarkedThis home is ranked 49th out of 60 homes in North Carolina.Shows adjusted nurse hours per resident per day benchmarked to the North Carolina average, with a ranking across 60 North Carolina SNFs. More hours mean more direct care. The national average is about 3.5 hrs; below 3.0 is a red flag.
This facility North Carolina avg (4h 55m per day)
vs North Carolina avg
-30%

6 of 6 metrics below state avg

Staff typeHours / dayvs state avg
Registered Nurse (RN) Info RNs hold the highest nursing license and can assess residents, interpret test results, and direct care plans. More RN hours per day often signals stronger clinical oversight and faster response to health changes. 28m per day ▼ 20% State avg: 35m per day · National avg: 41m per day
LPN / LVN Info Licensed Practical Nurses (LPNs) or Licensed Vocational Nurses (LVNs) deliver routine hands-on care — medication administration, wound dressing, and monitoring vital signs. They work under RN supervision and make up a large share of daily bedside care. 50m per day ▼ 4% State avg: 52m per day · National avg: 52m per day
Nurse Aide Info Certified Nurse Aides (CNAs) provide the most direct day-to-day assistance: bathing, dressing, feeding, and mobility. Nurse aide hours are typically the largest staffing category and directly affect residents' quality of life. 2h 6m per day ▼ 9% State avg: 2h 19m per day · National avg: 2h 21m per day
Total Nursing (Weekend) Info Combined nursing hours (RN + LPN + Nurse Aide) per resident per day on weekends. Staffing often drops on weekends — this figure reveals whether the facility maintains adequate coverage outside of weekday hours. 3h 2m per day ▼ 9% State avg: 3h 20m per day · National avg: 3h 26m per day
Physical Therapist Info Hours per resident per day provided by licensed Physical Therapists (PTs) or PT Assistants. PT services help residents recover mobility after injury or illness and are especially important for post-acute (short-stay) rehabilitation. 3m per day ▼ 40% State avg: 5m per day · National avg: 4m per day
RN (Weekend) Info Registered nurse hours specifically on weekends. Facilities sometimes reduce RN presence on Saturdays and Sundays — a low weekend RN figure compared to weekday hours can indicate reduced clinical oversight when most administrative staff are absent. 19m per day ▼ 17% State avg: 23m per day · National avg: 29m per day

Capacity and availability

This home usually has availability

Occupancy lower than 85% suggests more openings may be available.

Similar occupancy to the North Carolina average: 76.4%
Occupancy rate 75.9% Rank #47 / 66Occupancy rate — state benchmarkedThis home is ranked 47th out of 66 homes in North Carolina.Shows this facility's occupancy rate versus the North Carolina average, with its statewide rank out of 66. Higher occupancy signals strong local demand and financial stability.
Avg. Length of Stay 103 days
Occupancy rate
75.9% Rank #47 / 66Occupancy rate — state benchmarkedThis home is ranked 47th out of 66 homes in North Carolina.Shows this facility's occupancy rate versus the North Carolina average, with its statewide rank out of 66. Higher occupancy signals strong local demand and financial stability.
Avg. Length of Stay
103 days

Who this home usually serves

TYPE OF STAY

Primarily short stays

Residents typically stay for brief periods, with frequent admissions and discharges throughout the year.

Breakdown by payment type

Medicare

26% of new residents, usually for short-term rehab.

Typical stay 27 days

Private pay

66% of new residents, often for short stays.

Typical stay 1 - 2 months

Medicaid

9% of new residents, often for long-term daily care.

Typical stay 2 years

Finances and operations

Privately-owned community
Operated by a business corporation.
Home revenue
$13.9M
Profit
$490.1K
Privately-owned community Operated by a business corporation.
Home revenue
$13.9M Rank #41 / 67Revenue — state benchmarkedThis home is ranked 41st out of 67 homes in North Carolina.Shows this facility's annual revenue compared to the North Carolina SNF average. Higher revenue generally means more resources for staffing and capital — read alongside Payroll %.
Profit
$490.1K
Payroll costs Info The portion of the home's budget spent on staff, including nurses, caregivers, and other employees who support care and operations. Rank #37 / 67Payroll — state benchmarkedThis home is ranked 37th out of 67 homes in North Carolina.Shows total annual staff payroll benchmarked to the North Carolina average. Higher payroll investment relative to peers often signals better staffing and less reliance on cheaper contract labor.
$7.2M
51.9% of revenue Rank #26 / 67Payroll % — state benchmarkedThis home is ranked 26th out of 67 homes in North Carolina.Shows payroll as a percentage of revenue versus the North Carolina average. Well-run SNFs often land around 55–65%. Below 25% may signal understaffing or heavy agency use — read with Staffing ratings.
Other operating costs Info All remaining costs needed to run the home, such as food, utilities, building maintenance, supplies and administrative expenses.
$6.2M
Total costs $13.4M
Years in operation
20 years in operation
A longer operating history, which may indicate experience navigating regulations and delivering ongoing care.
Walk Score
Walk Score: 43 / 100 Rank #15 / 63Walk Score — state benchmarkedThis home is ranked 15th out of 63 homes in North Carolina.Shows how walkable this facility's neighborhood is compared to the average Walk Score across North Carolina SNFs. Higher scores benefit residents, families, and staff.
Somewhat walkable. A few nearby services may be reachable on foot, but most trips require transportation.
BBB Rating
BBB Rating: B- (Not Accredited)
An independent rating from the Better Business Bureau based on factors such as complaint history, transparency, and business practices.
How BBB ratings work

License Details

CMS Certification Number345202

Ownership & Operating Entity

Profit StatusFor-Profit

Staffing

Key information about the people who lead and staff this community.

Leadership

ContactMr. Ronnie McNeil, Co-Owner

Memory & Specialized Care

1 service
No Alzheimer's certification

What does this home offer?

Building type icon
Building type icon

Building Type: Single-story

Types of Care at Capital Nursing And Rehabilitation Center

Skilled Nursing Hospice Care Respite Care Nursing Care

Contact Capital Nursing And Rehabilitation Center

Inspection History

In North Carolina, the Department of Health and Human Services, Division of Health Service Regulation conducts unannounced surveys to ensure nursing and adult care homes meet safety standards.

The data displayed corresponds to the last 4 years.

5 visits/inspections Info Inspections are mandatory, regular evaluations conducted by state health departments or regulatory agencies. They ensure the community provides safe, compliant care, covering areas like resident health, staff and management.

Latest inspection

Date August 7, 2025
Routine

20 deficiencies

Deficiencies indicate regulatory issues. A higher number implies the facility had several areas requiring improvement.

North Carolina average: 46 deficiencies

Inspection Report Summary for Capital Nursing And Rehabilitation Center

The most recent inspection on August 7, 2025, identified deficiencies related to medication management, pressure ulcer assessments, wound treatment order transcription, and required assessments for residents on antipsychotic medications. Earlier inspections showed a pattern of issues with wound care documentation, accident hazard prevention, and maintaining a safe environment, including a substantiated complaint investigation in June 2025 involving a resident fall due to inadequate supervision. Prior reports also noted problems with care plan revisions, discharge notifications, and quality assurance processes. Complaint investigations were mostly substantiated or lacked clear resolution, with no fines or enforcement actions listed in the available reports. The facility’s inspection history reflects ongoing challenges primarily in wound care management and resident safety, with no clear trend of improvement or worsening over time.

Health Inspection History

Inspections
Total health inspections 5

North Carolina average 4


Last Health inspection on Aug 2025

Total health citations
14 Rank #34 / 65Health citations — state benchmarkedThis home is ranked 34th out of 65 homes in North Carolina.Shows this facility's total health deficiency citations benchmarked to the North Carolina state average, with a ranking across all 65 NC SNFs. Lower citation counts earn a better rank.

North Carolina average 20.9

Citations per inspection
2.8 Rank #25 / 65Citations per inspection — state benchmarkedThis home is ranked 25th out of 65 homes in North Carolina.Shows average deficiency citations per CMS inspection for this facility versus the North Carolina mean across 65 SNFs with citation data. Lower is better.

North Carolina average 4.99


Health citations are formal notices following inspections when they fail to comply with safety and care standards.

8 of 14 citations resulted from standard inspections; 2 of 14 resulted from complaint investigations; and 4 of 14 came from combined inspections (standard and complaint).

Breakdown of citation severity (last 3 years)
Critical Health citations More info
0
100% better than North Carolina average

North Carolina average: 1.3


Serious Health citations More info 0
100% better than North Carolina average

North Carolina average: 0.9

0 critical citations More info North Carolina average: 1.3

0 serious citations More info North Carolina average: 0.9

10 moderate citations More info North Carolina average: 17.1

4 minor citations More info North Carolina average: 1.6
Citations history (last 3 years)
Abuse/Neglect moderate citation Info Issues related to protecting resident's from harm, including abuse, neglect, or mistreatment. Aug 07, 2025
Corrected

Pharmacy moderate citation Info Issues related to medication management, including how drugs are stored, administered, and monitored. Aug 07, 2025
Corrected

Quality of Care moderate citation Info Issues related to how well residents receive appropriate treatment and support for their medical and daily care needs. Aug 07, 2025
Corrected

Care Planning minor citation Info Issues related to creating and updating personalized care plans for residents based on their needs and conditions. Aug 07, 2025
Corrected

Financial Assistance for
Nursing Home in North Carolina

Capital Nursing And Rehabilitation Center is located in Raleigh, North Carolina.
Here are the financial assistance programs available to residents in North Carolina.

Get Financial aid guidance

Community Alternatives Program for Disabled Adults

NC Medicaid CAP/DA

Age 65+ or disabled
General North Carolina resident, Medicaid- eligible, nursing home-level care need.
Income Limits (2025) ~$2,829/month 300% FBR, individual
Asset Limits $2,000 (individual), $3,000 (couple).
NC

High demand; waitlists common in urban areas.

Benefits
Personal care (5-7 hours/day) Respite (240 hours/year) Adult day care ($60/day) Home modifications ($1,500 avg.)

North Carolina Senior Care Options

NC SCO (via NFCSP)

Age Caregiver of someone 60+ (or with dementia)
General North Carolina resident.
Income Limits No strict limit; prioritizes low-income.
Asset Limits Not applicable.
NC

Limited slots; rural/urban balance.

Benefits
In-home respite (4-6 hours/day) Adult day care (~$60/day) Short-term facility care (up to 5 days)

Program of All-Inclusive Care for the Elderly (PACE)

North Carolina PACE (e.g., PACE of the Triad)

Age 55+
General NC resident (specific counties), NFLOC, safe with PACE support.
Income Limits (2025) ~$2,829/month (Medicaid-eligible); private pay option available.
Asset Limits $2,000 (individual), $3,000 (couple) for Medicaid enrollees.
NC

Available in 10+ counties (e.g., Guilford, Wake); multiple providers (e.g., PACE of the Southern Piedmont).

Benefits
Personal care (5-7 hours/day) Medical care Meals Transportation Respite Therapies

In-Home Aide Services

North Carolina In-Home Aide Services

Age 60+
General NC resident, unable to perform 1+ ADL, at risk of nursing home placement.
Income Limits (2025) No strict cap; prioritizes low-income ~$24,980/year
Asset Limits Not assessed; need-based.
NC

Family can be aides; varies by county funding.

Benefits
Personal care (5-20 hours/week) Meal prep Respite (~5 days/year) Errands

Medicare Savings Program (MSP)

North Carolina Medicare Savings Program

Age 65+ or disabled
General NC resident, Medicare Part A/B.
Income Limits (2025) ~$2,510/month (QMB), ~$3,380/month (SLMB), ~$3,598/month (QI)—individual.
Asset Limits $9,430 (individual), $14,130 (couple).
NC

Three tiers; no waitlist; includes Extra Help for Part D.

Benefits
Covers Part B premiums ($174.70/month) Deductibles ($240/year) Copays (~20%)

Low-Income Energy Assistance Program (LIHEAP)

North Carolina LIHEAP

Age 60+ prioritized
General NC resident, low-income household.
Income Limits (2025) ~$3,970/month individual, 185% FPL
Asset Limits Not assessed; income-focused.
NC

Covers oil, gas, electric; emergency aid via Crisis Intervention Program (CIP).

Benefits
Heating/cooling aid ($300-$1,000/season) Emergency fuel ($600 max via CIP)

Senior Community Service Employment Program (SCSEP)

North Carolina SCSEP

Age 55+
General unemployed, low-income, NC resident.
Income Limits (2025) ~$1,983/month 125% FPL
Asset Limits Not specified; income-focused.
NC

Priority for veterans, rural residents; AARP partnership.

Benefits
Paid training (~20 hours/week at ~$7.25/hour) Job placement

VA Aid and Attendance (A&A) and Housebound Benefits

North Carolina VA Aid and Attendance/Housebound

Age 65+ or disabled veteran/spouse
General NC resident, wartime service, need for ADL help (A&A) or homebound.
Income Limits (2025) Net income < ~$1,984/month (veteran with dependent, A&A); pension offsets income.
Asset Limits ~$155,356 net worth limit
NC

High veteran demand in rural/urban areas.

Benefits
Cash (~$1,433-$2,642/month veteran, ~$951-$1,318 spouse) for care costs (e.g., in-home, assisted living)

Urgent Repair Program (URP)

North Carolina Urgent Repair Program

Age 60+ prioritized
General NC resident, homeowner, low-income.
Income Limits (2025) ~$30,258/year 50% AMI, varies by county
Asset Limits Not strictly assessed; home value considered.
NC

Forgivable at $2,000/year; statewide via local partners.

Benefits
Repairs (~$8,000-$12,000 avg.) for safety (e.g., roofs, heating, accessibility)

State/County Special Assistance (SA)

North Carolina Special Assistance

Age 65+ (or disabled)
General NC resident, in licensed adult care home, low-income.
Income Limits (2025) ~$1,255/month (individual, 100% FPL); varies by facility rate.
Asset Limits $2,000 individual
NC

Covers assisted living; counties supplement state funds.

Benefits
Cash (~$1,200-$1,500/month) for room/board; Medicaid covers care services

Places of interest near Capital Nursing And Rehabilitation Center

Address 3.7 miles from city center Info Estimated distance in miles from Raleigh's city center to Capital Nursing And Rehabilitation Center's address, calculated via Google Maps. — 0.41 miles to nearest hospital (Heart & Vascular - Cardiovascular & Thoracic Surgery - Raleigh Campus)

Calculate Travel Distance to Capital Nursing And Rehabilitation Center

Add your location

Address

Staffing Data (Q2 2025)

This data corresponds to Q2 2025 and is based on CMS Payroll-Based Journal.

Total staff 118
Employees 99
Contractors 19
Staff to resident ratio 1.18:1
36% worse than North Carolina average

North Carolina average ratio: 1.85:1

Avg staff/day 48
Average shift 7.8 hours
0% compared with North Carolina average

North Carolina average: 8 hours

Total staff hours (quarter) 34,053
Nursing staff breakdown
Registered Nurse

Manages medical care and health needs.

Total count 9
Average shift length Info Average shift length. Calculated as total hours divided by days worked and average staff per day. 8.1 hours

No contractors work on this role.

Licensed Practical Nurse

Assists with medical care and medications.

Total count 23
Average shift length Info Average shift length. Calculated as total hours divided by days worked and average staff per day. 8.8 hours

No contractors work on this role.

Certified Nursing Assistant

Helps with daily care and mobility.

Total count 59
Average shift length Info Average shift length. Calculated as total hours divided by days worked and average staff per day. 7.7 hours

No contractors work on this role.

Contractor staffing

Total hours from contractors

8.5%

2,882 contractor hours this quarter

Respiratory Therapy Technician: 4 Speech Language Pathologist: 4 Qualified Social Worker: 3 Physical Therapy Aide: 3 Physical Therapy Assistant: 2 Nurse Practitioner: 1 Occupational Therapy Assistant: 1 Medical Director: 1
Staff by category
Certified Nursing Assistant5905918,57691100%7.7
Licensed Practical Nurse230238,07591100%8.8
Registered Nurse9091,94091100%8.1
Clinical Nurse Specialist3031,0656976%8
Physical Therapy Assistant0225896571%6.3
Speech Language Pathologist0445876774%6
Nurse Practitioner1125116167%8
Dietitian1015116470%8
Physical Therapy Aide0335017987%6.1
Dental Services Staff1014896167%8
Administrator1014806167%7.9
Respiratory Therapy Technician0443344549%6.9
Qualified Social Worker0333336470%5
Occupational Therapy Assistant011551213%4.6
RN Director of Nursing101522%2.7
Medical Director011333%1
59 Certified Nursing Assistant
% of Days 100%
23 Licensed Practical Nurse
% of Days 100%
9 Registered Nurse
% of Days 100%
3 Clinical Nurse Specialist
% of Days 76%
2 Physical Therapy Assistant
% of Days 71%
4 Speech Language Pathologist
% of Days 74%
2 Nurse Practitioner
% of Days 67%
1 Dietitian
% of Days 70%
3 Physical Therapy Aide
% of Days 87%
1 Dental Services Staff
% of Days 67%
1 Administrator
% of Days 67%
4 Respiratory Therapy Technician
% of Days 49%
3 Qualified Social Worker
% of Days 70%
1 Occupational Therapy Assistant
% of Days 13%
1 RN Director of Nursing
% of Days 2%
1 Medical Director
% of Days 3%

Facility Characteristics

Source: CMS Long-Term Care Facility Characteristics (Data as of Jan 2026)

Total residents 100
Medicare
9
9% of residents
Medicaid
71
71% of residents
Private pay or other
20
20% of residents
Programs & Services
Residents Group

Residents meet regularly to discuss policies, care quality, and activities

Active Resident Council

Organized group of residents that meets regularly to discuss facility policies, quality of life, and activities.

Quality of care over time

These measures show how residents usually do over time at this home, based on health outcomes and preventive care.

High-risk clinical events score Info A composite score based on pressure ulcers, falls with injury, weight loss, walking ability decline, and activities of daily living decline. 4.8
58% better than North Carolina average

North Carolina average: 11.5

Functional decline score Info A composite score based on activities of daily living decline, walking ability decline, and incontinence. 14.0
32% better than North Carolina average

North Carolina average: 20.6

Long-stay resident measures
Significantly above average North Carolina avg: 2.9 Info CMS star rating based on long-stay quality measure performance. 5 stars = significantly above average, 1 star = significantly below average.
Need for Help with Daily Activities Increased Info Percent of long-stay residents whose need for help with daily activities has increased 6.9%
61% better than North Carolina average

North Carolina average: 17.5%

Walking Ability Worsened Info Percent of long-stay residents whose ability to move independently worsened 9.1%
61% better than North Carolina average

North Carolina average: 23.3%

Low Risk Residents with Bowel/Bladder Incontinence Info Percent of low risk long-stay residents who lose control of their bowels or bladder 26.1%
22% worse than North Carolina average

North Carolina average: 21.4%

Falls with Major Injury Info Percent of long-stay residents experiencing one or more falls with major injury 0.9%
75% better than North Carolina average

North Carolina average: 3.6%

High Risk Residents with Pressure Ulcers Info Percent of long-stay high risk residents with pressure ulcers 3.3%
48% better than North Carolina average

North Carolina average: 6.3%

Urinary Tract Infection Info Percent of long-stay residents with a urinary tract infection 1.9%
29% better than North Carolina average

North Carolina average: 2.6%

Lost Too Much Weight Info Percent of long-stay residents who lose too much weight 3.8%
48% better than North Carolina average

North Carolina average: 7.4%

Depressive Symptoms Info Percent of long-stay residents who have depressive symptoms 0.7%
85% better than North Carolina average

North Carolina average: 4.4%

Antipsychotic Use Info Percent of long-stay residents who received an antipsychotic medication 12.2%
9% better than North Carolina average

North Carolina average: 13.4%

Pneumococcal Vaccine Info Percent of long-stay residents assessed and appropriately given the pneumococcal vaccine 98.2%
7% better than North Carolina average

North Carolina average: 91.6%

Influenza Vaccine Info Percent of long-stay residents assessed and appropriately given the seasonal influenza vaccine 95.2%
In line with North Carolina average

North Carolina average: 94.1%

Short-stay resident measures
Average North Carolina avg: 2.9 Info CMS star rating based on short-stay quality measure performance. 5 stars = much above average, 1 star = much below average.
Pneumococcal Vaccine Info Percent of short-stay residents assessed and appropriately given the pneumococcal vaccine 92.5%
16% better than North Carolina average

North Carolina average: 79.9%

Antipsychotic medication increase Info Percent of short-stay residents who newly received an antipsychotic medication 0.6%
62% better than North Carolina average

North Carolina average: 1.5%

Influenza Vaccine Info Percent of short-stay residents assessed and appropriately given the seasonal influenza vaccine 79.4%
In line with North Carolina average

North Carolina average: 78.1%

Re-hospitalized after SNF stay Info Percentage of short-stay residents who were re-hospitalized after their nursing home admission. 20.0%
13% better than North Carolina average

North Carolina average: 22.9%

Emergency department visits Info Percentage of short-stay residents who had an outpatient emergency department visit. 12.2%
8% better than North Carolina average

North Carolina average: 13.2%

Falls with major injury Info Percentage of SNF residents who experience falls with major injury during their stay. 1.3%
62% worse than North Carolina average

North Carolina average: 0.8%

Ability to care for self at discharge Info Percentage of residents at or above expected ability to care for themselves at discharge. 43.8%
19% worse than North Carolina average

North Carolina average: 53.7%

Successful return to home or community Info Rate of successful return to home or community from a skilled nursing facility. 52.2%
In line with North Carolina average

North Carolina average: 50.6%

Penalties and fines

Federal penalties imposed by CMS for regulatory violations, including civil money penalties (fines) and denials of payment for new Medicare/Medicaid admissions.

Source: CMS Penalties Database

No penalties in the past 3 years

No civil money penalties or payment denials were reported in the last 3 years.

Compare Nursing Home around Raleigh The information below is reported by the North Carolina Department of Health and Human Services, Division of Health Service Regulation.

5 facilities compared · CMS & NC Dept. of Health data · Updated May 2026

Filter by care type
College Pines Health and Rehabilitation Center
NH

Nursing Home Licensed facility providing 24/7 skilled nursing care for residents with complex, ongoing medical needs. Staffed by RNs, LPNs, and CNAs. Inspected and star-rated annually by CMS. Accepts Medicare (short-term rehab) and Medicaid (long-term care).

AL

Assisted Living A licensed, long-term care setting for seniors or individuals with disabilities who need help with daily activities — like bathing, dressing, and medication management — but not 24-hour skilled nursing. Offers housing, meals, and around-the-clock support while aiming to maximize resident independence.

Connelly Springs (Locust Street)104 88.6% +16%3.98 -2%0%242.0292- 6 -$15.2M$5.2M34.1%345446
Capital Nursing And Rehabilitation Center
NH

Nursing Home Licensed facility providing 24/7 skilled nursing care for residents with complex, ongoing medical needs. Staffed by RNs, LPNs, and CNAs. Inspected and star-rated annually by CMS. Accepts Medicare (short-term rehab) and Medicaid (long-term care).

AL

Assisted Living A licensed, long-term care setting for seniors or individuals with disabilities who need help with daily activities — like bathing, dressing, and medication management — but not 24-hour skilled nursing. Offers housing, meals, and around-the-clock support while aiming to maximize resident independence.

HC

Home Care Professional care delivered in the person's own home — from companionship and errands to skilled nursing and therapy. Allows seniors to age in place. Medicare covers skilled home health when medically necessary.

IL

Independent Living Lifestyle-focused communities for older adults offering dining, activities, and transportation with minimal personal care. Best for active, independent seniors who want community without medical support.

Raleigh (East Raleigh)125 75.9% -1%3.43 -16%-14%0142.8-100B- 43 Liberty Commons Nursing And Rehabilitation Center Of Wake County, Llc$13.9M$5.4M38.7%345202
Hillcrest Raleigh At Crabtree Valley
NH

Nursing Home Licensed facility providing 24/7 skilled nursing care for residents with complex, ongoing medical needs. Staffed by RNs, LPNs, and CNAs. Inspected and star-rated annually by CMS. Accepts Medicare (short-term rehab) and Medicaid (long-term care).

AL

Assisted Living A licensed, long-term care setting for seniors or individuals with disabilities who need help with daily activities — like bathing, dressing, and medication management — but not 24-hour skilled nursing. Offers housing, meals, and around-the-clock support while aiming to maximize resident independence.

Raleigh (North Hills)134 73.7% -4%4.27 +34%+7%1126.01100A+ 31 Hillcrest Convalescent Center, Inc.$21.6M$6.5M30.1%345555
Raleigh Rehabilitation Center
NH

Nursing Home Licensed facility providing 24/7 skilled nursing care for residents with complex, ongoing medical needs. Staffed by RNs, LPNs, and CNAs. Inspected and star-rated annually by CMS. Accepts Medicare (short-term rehab) and Medicaid (long-term care).

AL

Assisted Living A licensed, long-term care setting for seniors or individuals with disabilities who need help with daily activities — like bathing, dressing, and medication management — but not 24-hour skilled nursing. Offers housing, meals, and around-the-clock support while aiming to maximize resident independence.

Raleigh (Five Points)157 80.8% +6%3.54 +35%-11%3265.24140- 48 Jackson, Christina$18.9M$6.2M32.8%345049
Hayes Barton Place -
AL

Assisted Living A licensed, long-term care setting for seniors or individuals with disabilities who need help with daily activities — like bathing, dressing, and medication management — but not 24-hour skilled nursing. Offers housing, meals, and around-the-clock support while aiming to maximize resident independence.

IL

Independent Living Lifestyle-focused communities for older adults offering dining, activities, and transportation with minimal personal care. Best for active, independent seniors who want community without medical support.

MC

Memory Care Secured, specialized care for people living with Alzheimer's or dementia. Staff trained in cognitive impairment, with higher staff-to-resident ratios and an environment designed to reduce confusion and wandering risk.

NH

Nursing Home Licensed facility providing 24/7 skilled nursing care for residents with complex, ongoing medical needs. Staffed by RNs, LPNs, and CNAs. Inspected and star-rated annually by CMS. Accepts Medicare (short-term rehab) and Medicaid (long-term care).

Raleigh (Five Points)---------0----- 59 -----

Guides for Better Senior Living

Care Cost Calculator: See Prices in Your Area

Nursing Home Data Explorer

Don’t Wait Too Long: 7 Red Flag Signs Your Parent Needs Assisted Living Now

The True Cost of Assisted Living in 2025 – And How Families Are Paying For It

Understanding Senior Living Costs: Pricing Models, Discounts & Financial Assistance

Frequently Asked Questions about Capital Nursing And Rehabilitation Center

What neighborhood is Capital Nursing And Rehabilitation Center in?

Capital Nursing And Rehabilitation Center is in the East Raleigh neighborhood of Raleigh.

Is Capital Nursing And Rehabilitation Center in a walkable area?

Capital Nursing And Rehabilitation Center has a walk score of 43. Somewhat walkable. A few nearby services may be reachable on foot, but most trips require transportation.

Does Capital Nursing And Rehabilitation Center operate as a for-profit or non-profit?

Capital Nursing And Rehabilitation Center is registered as a for-profit in NC.

Who is the administrator of Capital Nursing And Rehabilitation Center?

field_administrator is the administrator of Capital Nursing And Rehabilitation Center.

What is the address of Capital Nursing And Rehabilitation Center?

Capital Nursing And Rehabilitation Center is located at 3000 Holston Ln, Raleigh, NC 27610, United States.

What is the phone number of Capital Nursing And Rehabilitation Center?

(919) 231-6045 will put you in contact with the team at Capital Nursing And Rehabilitation Center.

Is Capital Nursing And Rehabilitation Center Medicare or Medicaid certified?

Yes — Capital Nursing And Rehabilitation Center is a CMS-certified provider of Medicare and Medicaid.

Explore Open Rooms
1 Contact details
2 What type of senior care service are you looking for?
3 What budget do you have in mind for senior care?
4 How soon do you need to find care?
5 Additional details

Thank you for your interest!

Our team will be in touch shortly to help with next steps.