

 Every person who worked here at any point in the quarter, employees and contractors. It is not how many are on site at once: that is the "on an average day" figure.
76
59 employees · 17 contractors · 14 on an average day
Hayes Barton Place
Nursing Home, Assisted Living, Continuing Care Retirement Community, Independent Living, Memory Care & Skilled Nursing · Raleigh, NC
Hayes Barton Place
Nursing Home, Assisted Living, Continuing Care Retirement Community, Independent Living, Memory Care & Skilled Nursing · Raleigh, NC
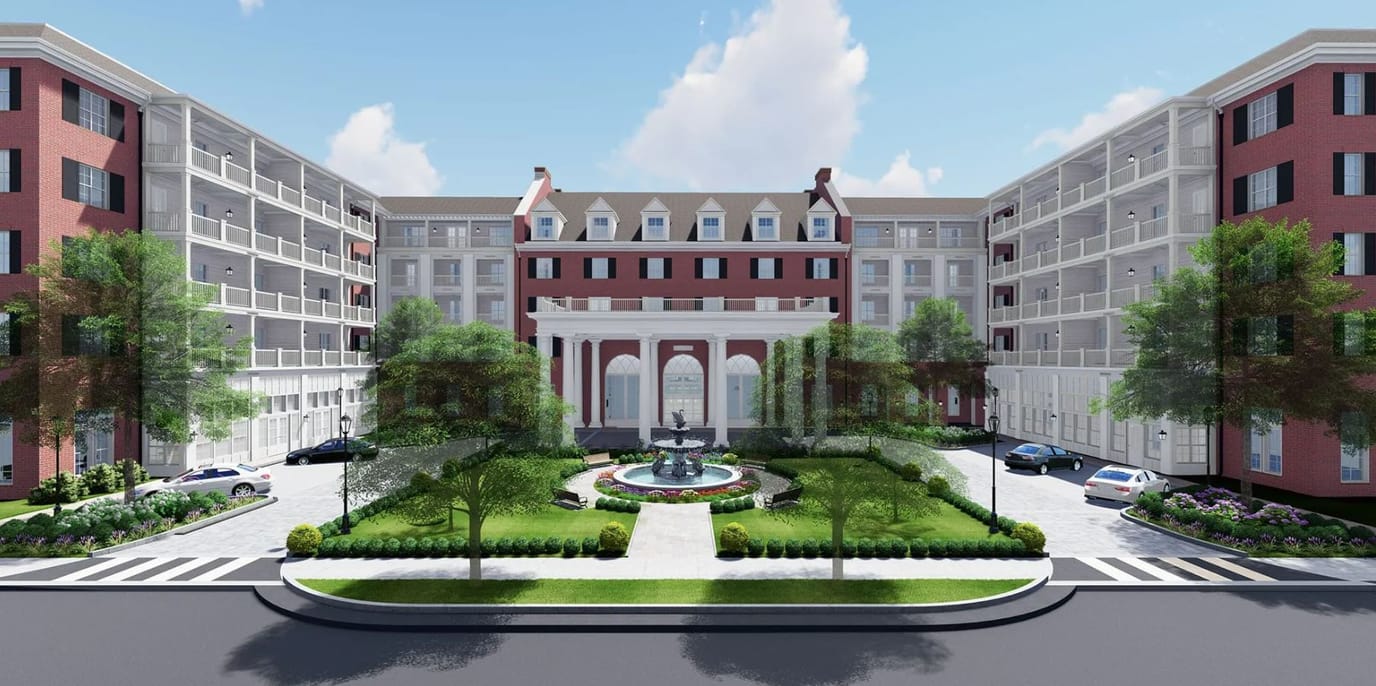
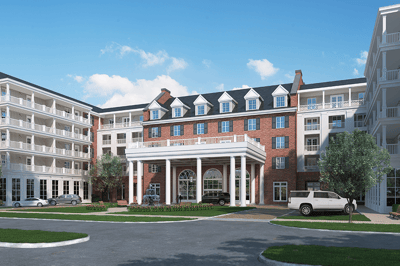
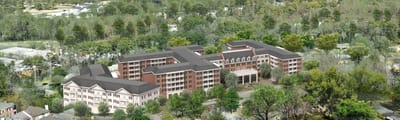
Overview of Hayes Barton Place


Hayes Barton Place in Raleigh, NC, is structured around the continuing care retirement community model, with independent living, assisted living, memory care, and skilled nursing levels. Independent living offers a private home where community services are accessible but daily care is not provided. Staff in assisted living handle bathing, dressing, medication, and other daily activities for residents.
Memory care here means a supervised area that is secured. Skilled nursing maintains licensed nurses present around the clock. A resident who begins at one level and requires more later can advance without relocating to another community.
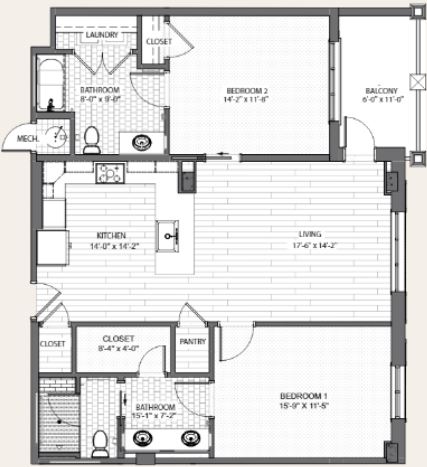
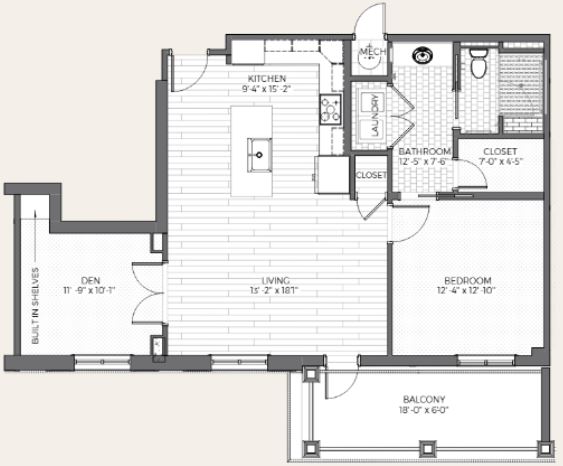
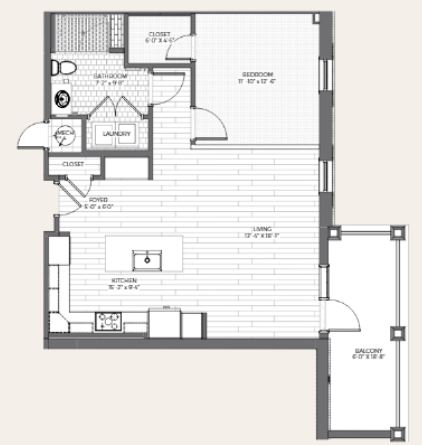
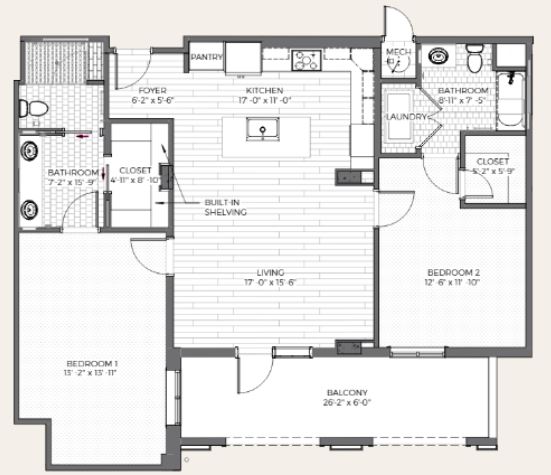
Each apartment in this location is designed as a one-bedroom. Respite allows a family’s regular caregiver time to recuperate or travel while the individual they support remains here temporarily. Residents are allowed to bring their pets.
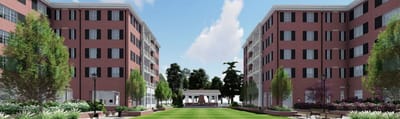
A saltwater pool is available, along with a group fitness studio and a spa that has a beauty salon next to it. Pickleball appears on the list of activities. Walking paths, a library, and arts and crafts complete the choices for fitness, reading, and creative work.
At 59, the Walk Score is classified as somewhat walkable, allowing for certain errands to be within walking distance. Hayes Barton Place is located in the Five Points neighborhood of Raleigh.
Quality ratings
The Overall CMS Rating combines results from health inspections, staffing levels and quality measures. Health inspections carry the most weight. Staffing and quality scores can increase or decrease the final rating based on performance compared to state and national standards.
Newly certified nursing home with less than 12-15 months of data available or the nursing home opened less than 6 months ago, and there were no data to submit or claims for this measure.
Based on the results of the facility's three most recent standard inspections and any complaint investigations. CMS reviews the number, scope, and severity of deficiencies, with more recent findings weighted more heavily.
Newly certified nursing home with less than 12-15 months of data available or the nursing home opened less than 6 months ago, and there were no data to submit or claims for this measure.
Measures average nursing staff hours per resident per day, including Registered Nurses (RNs) and total nursing staff. Ratings are adjusted based on the level of care residents require and are compared to state and national benchmarks.
Newly certified nursing home with less than 12-15 months of data available or the nursing home opened less than 6 months ago, and there were no data to submit or claims for this measure.
Based on clinical and physical health indicators reported to CMS, such as hospital readmissions, falls, pressure ulcers, and improvements in mobility. These measures reflect how well residents' health needs are being managed.
Newly certified nursing home with less than 12-15 months of data available or the nursing home opened less than 6 months ago, and there were no data to submit or claims for this measure.
Staffing
Data period: Q2 2026 (April 1 – June 30, 2026).
Nursing care per resident per day and state rankings: CMS Provider Information.
Headcount, shifts and contractors: CMS Payroll-Based Journal (PBJ).
Resident count: CMS Long-Term Care Facility Characteristics (data as of Sep 2026).
Daily care time per resident, by role
Physical therapist
Hours per resident per day provided by licensed Physical Therapists (PTs) or PT Assistants. PT services help residents recover mobility after injury or illness and are especially important for post-acute (short-stay) rehabilitation.
40m
Hours per resident per day provided by licensed Physical Therapists (PTs) or PT Assistants. PT services help residents recover mobility after injury or illness and are especially important for post-acute (short-stay) rehabilitation.
RN, weekends
Registered nurse hours specifically on weekends. Facilities sometimes reduce RN presence on Saturdays and Sundays — a low weekend RN figure compared to weekday hours can indicate reduced clinical oversight when most administrative staff are absent.
Sat–Sun
1h 16m
↑ 209% · NC 24mThis facility: 1h 16m per resident per day, 209% above the North Carolina average of 24m (among North Carolina facilities reporting a recent figure).
Registered nurse hours specifically on weekends. Facilities sometimes reduce RN presence on Saturdays and Sundays — a low weekend RN figure compared to weekday hours can indicate reduced clinical oversight when most administrative staff are absent.
Sat–SunUS average: 29m.Green: 5% or more better than the state average. Yellow: within 5%. Red: 5% or more worse. US 29m
Headcount
Every person who worked here at any point in the quarter, employees and contractors. It is not how many are on site at once: that is the "on an average day" figure.
76
59 employees · 17 contractors · 14 on an average day
76 total staff / 1 resident. Residents: CMS Long-Term Care Facility Characteristics (data as of Sep 2026); staff: CMS Payroll-Based Journal (Q2 2026).Residents and staff come from two different CMS releases, so the two counts can be a few months apart.
76.00 : 1
76 staff ÷ 1 residents
See full North Carolina ranking →
Average hours one staff member works on a day they are on shift, across every role.
7.4 h
↓ 8% · NC 8 hThis facility: 7.4 h, 8% below the North Carolina average of 8 h (among North Carolina facilities reporting a recent figure).Green: 5% or more better than the state average. Yellow: within 5%. Red: 5% or more worse.
9,428 staff hours this quarter
See full North Carolina ranking →95.1% of staff hours were worked by the facility's own employees
North Carolina average: 87.3% · Contractors this quarter: Licensed Practical Nurse (6), Certified Nursing Assistant (5), Registered Nurse (4), Medical Director (1), Occupational Therapy Assistant (1)
Why it matters: employees work here week after week and get to know each resident's routines and needs. Agency contractors often rotate between facilities, so a higher employee share usually means more consistent care.
By The Numbers
Community insights.
Bed count
A smaller, more intimate setting that may offer a quieter environment and closer staff-resident interactions.
31
Rank #77 / 86Bed count — State benchmarked This nursing home is ranked 77th out of 86 nursing homes we track in North Carolina for bed count. Shows this facility's certified or reported bed count compared to other North Carolina facilities. Larger communities may offer more amenities, programs, and on-site services for residents and families. Communities with the same value for a metric share the same rank. Rankings compare like with like: every nursing home we track in North Carolina that reports data for that category. Nursing homes without available data are excluded, so the pool size varies from metric to metric.
A smaller, more intimate setting that may offer a quieter environment and closer staff-resident interactions.
31
Rank #77 / 86Bed count — State benchmarked This nursing home is ranked 77th out of 86 nursing homes we track in North Carolina for bed count. Shows this facility's certified or reported bed count compared to other North Carolina facilities. Larger communities may offer more amenities, programs, and on-site services for residents and families. Communities with the same value for a metric share the same rank. Rankings compare like with like: every nursing home we track in North Carolina that reports data for that category. Nursing homes without available data are excluded, so the pool size varies from metric to metric.Smaller home · May offer a more intimate, personalized care environment.
Walk Score
Somewhat walkable. Some errands can be accomplished on foot, with a mix of nearby amenities.
Rank #18 / 111Walk Score — State benchmarked This nursing home is ranked 18th out of 111 nursing homes we track in North Carolina for walk score. Shows how walkable this facility's neighborhood is compared to the average walk score across North Carolina facilities. Higher scores benefit residents, families, and staff. Communities with the same value for a metric share the same rank. Rankings compare like with like: every nursing home we track in North Carolina that reports data for that category. Nursing homes without available data are excluded, so the pool size varies from metric to metric.
Somewhat walkable. Some errands can be accomplished on foot, with a mix of nearby amenities.
Rank #18 / 111Walk Score — State benchmarked This nursing home is ranked 18th out of 111 nursing homes we track in North Carolina for walk score. Shows how walkable this facility's neighborhood is compared to the average walk score across North Carolina facilities. Higher scores benefit residents, families, and staff. Communities with the same value for a metric share the same rank. Rankings compare like with like: every nursing home we track in North Carolina that reports data for that category. Nursing homes without available data are excluded, so the pool size varies from metric to metric.
59
/ 100
Occupancy rate
Occupancy lower than 85% suggests more openings may be available.
Rank #76 / 76Occupancy rate — State benchmarked This nursing home is ranked 76th out of 76 nursing homes we track in North Carolina for occupancy. Shows this facility's occupancy rate versus the North Carolina average, with its Statewide rank out of 76. Higher occupancy signals strong local demand and financial stability. Communities with the same value for a metric share the same rank. Rankings compare like with like: every nursing home we track in North Carolina that reports data for that category. Nursing homes without available data are excluded, so the pool size varies from metric to metric.
Occupancy lower than 85% suggests more openings may be available.
Rank #76 / 76Occupancy rate — State benchmarked This nursing home is ranked 76th out of 76 nursing homes we track in North Carolina for occupancy. Shows this facility's occupancy rate versus the North Carolina average, with its Statewide rank out of 76. Higher occupancy signals strong local demand and financial stability. Communities with the same value for a metric share the same rank. Rankings compare like with like: every nursing home we track in North Carolina that reports data for that category. Nursing homes without available data are excluded, so the pool size varies from metric to metric.
22.3%
This home usually has availability
 Lower than the North Carolina average: 82.1%
Residents per day (avg)
The average number of residents living at this facility on a given day. CMS calculates this figure from the facility's Minimum Data Set (MDS) assessments and uses this value for other measures like Hours Per Resident Per Day (HPRD) and 5-Star Staffing rating.
The average number of residents living at this facility on a given day. CMS calculates this figure from the facility's Minimum Data Set (MDS) assessments and uses this value for other measures like Hours Per Resident Per Day (HPRD) and 5-Star Staffing rating.
7
Source: CMS Provider Information, average daily residents (data as of Oct 2026)
About This Community
Seed Oil Free Certified™ — Seed Oil Free Alliance (implied)An independent Seed Oil Free Alliance certification verifies covered cooking oils and fats through ingredient review, lab testing, and supply-chain audits, helping families identify dining that avoids seed oils.
NASM/AFAA fitness programming partnership — NASM/AFAAA specialty credential or certification held by the community or its staff, indicating training or standards beyond basic state licensure.
Respite CareRespite care provides families and unpaid caregivers with short-term relief from caregiving duties. Care can range from a few hours to a few weeks.
Valet Parking
Concierge
TransportationListed as: Scheduled transportation
Maintenance
Pets Allowed
Continuing Care Retirement Community (CCRC)
Beauty Salon
Spa
Putting Green
Garden
Library
Cable Tv
Wi-Fi
Saltwater Pool (Indoor, Heated)
Group Fitness Studio
Croquet Lawn
Outdoor Music Venue
Walking Paths
Activities
Group Fitness Classes
Pickleball
Bocce Ball
Arts & Crafts
- Fitness programming by NASM/AFAA-trained staff
Touring HoursMonday-Friday: 9am-5pm
Dining & Nutrition
Sourced directly from the team at Hayes Barton Place.
Dining & Nutrition
Sourced directly from the team at Hayes Barton Place.- Multiple dining venues.
- Outdoor dining option.
Building TypeMid-rise
Room Sizes
1874 sq. ft
2034 sq. ft
2682 - 2695 sq. ft
800 - 3100 sq. ft
Room Types
1 Bedroom
Cottage / Villa
Enforcement
Penalties and fines
Penalties and fines
Federal penalties imposed by CMS for regulatory violations, including civil money penalties (fines) and denials of payment for new Medicare/Medicaid admissions.
Source: CMS Penalties Database · Data as of Oct 2026
No penalties in the past 3 years
No civil money penalties or payment denials on record since Oct 2023.
Total fines
$0
NC avg $66KNorth Carolina average: $65,553. Average among the 234 North Carolina facilities with a penalty on record.US avg $66KUS average: $66,281, among the 6,725 US facilities with a penalty on record.
Number of fines
0
NC avg 2.06North Carolina average: 2.06. Average among the 234 North Carolina facilities with a penalty on record.US avg 1.88US average: 1.88, among the 6,725 US facilities with a penalty on record.
Payment denials
Serious action where Medicare and/or Medicaid temporarily stops payments for new residents until issues are fixed.
Serious action where Medicare and/or Medicaid temporarily stops payments for new residents until issues are fixed.
0
NC avg 0.31North Carolina average: 0.31. Average among the 234 North Carolina facilities with a penalty on record.US avg 0.35US average: 0.35, among the 6,725 US facilities with a penalty on record.
Health Outcomes
Quality of care over time
How residents at this home fare on health outcomes and preventive care, compared with the North Carolina average.
CMS star rating for the care of long-stay residents, who live at the home for 100 days or more. It is built from the long-stay quality measures below. 5 stars is the best.
Not Available
Newly certified nursing home with less than 12-15 months of data available or the nursing home opened less than 6 months ago, and there were no data to submit or claims for this measure.
CMS star rating for the care of short-stay residents, mostly people recovering after a hospital stay for under 100 days. It is built from the short-stay quality measures below. 5 stars is the best.
Not Available
Newly certified nursing home with less than 12-15 months of data available or the nursing home opened less than 6 months ago, and there were no data to submit or claims for this measure.
11 long-stay measures: 11 not available
5 short-stay measures: 2 better, 3 not available
Long-stay residents
People who live at the home · 11 measures
Daily care & independence
Needed more help with daily activities
Percent of long-stay residents whose need for help with daily activities has increased
Not Available
The number of residents or resident stays is too small to report. Call the facility to discuss this quality measure.
Percent of long-stay residents whose need for help with daily activities has increased
Not Available
The number of residents or resident stays is too small to report. Call the facility to discuss this quality measure.
Walking ability worsened
Percent of long-stay residents whose ability to move independently worsened
Not Available
The number of residents or resident stays is too small to report. Call the facility to discuss this quality measure.
Percent of long-stay residents whose ability to move independently worsened
Not Available
The number of residents or resident stays is too small to report. Call the facility to discuss this quality measure.
Bowel or bladder incontinence (low-risk residents)
Percent of low risk long-stay residents who lose control of their bowels or bladder
Not Available
The number of residents or resident stays is too small to report. Call the facility to discuss this quality measure.
Percent of low risk long-stay residents who lose control of their bowels or bladder
Not Available
The number of residents or resident stays is too small to report. Call the facility to discuss this quality measure.
Safety & clinical stability
Urinary tract infection
Percent of long-stay residents with a urinary tract infection
Not Available
The number of residents or resident stays is too small to report. Call the facility to discuss this quality measure.
Percent of long-stay residents with a urinary tract infection
Not Available
The number of residents or resident stays is too small to report. Call the facility to discuss this quality measure.
Falls with major injury
Percent of long-stay residents experiencing one or more falls with major injury
Not Available
The number of residents or resident stays is too small to report. Call the facility to discuss this quality measure.
Percent of long-stay residents experiencing one or more falls with major injury
Not Available
The number of residents or resident stays is too small to report. Call the facility to discuss this quality measure.
Pressure ulcers (high-risk residents)
Percent of long-stay high risk residents with pressure ulcers
Not Available
The number of residents or resident stays is too small to report. Call the facility to discuss this quality measure.
Percent of long-stay high risk residents with pressure ulcers
Not Available
The number of residents or resident stays is too small to report. Call the facility to discuss this quality measure.
Physical & mental health
Lost too much weight
Percent of long-stay residents who lose too much weight
Not Available
The number of residents or resident stays is too small to report. Call the facility to discuss this quality measure.
Percent of long-stay residents who lose too much weight
Not Available
The number of residents or resident stays is too small to report. Call the facility to discuss this quality measure.
Depressive symptoms
Percent of long-stay residents who have depressive symptoms
Not Available
The number of residents or resident stays is too small to report. Call the facility to discuss this quality measure.
Percent of long-stay residents who have depressive symptoms
Not Available
The number of residents or resident stays is too small to report. Call the facility to discuss this quality measure.
Antipsychotic use
Percent of long-stay residents who received an antipsychotic medication
Not Available
The number of residents or resident stays is too small to report. Call the facility to discuss this quality measure.
Percent of long-stay residents who received an antipsychotic medication
Not Available
The number of residents or resident stays is too small to report. Call the facility to discuss this quality measure.
Preventive care
Pneumococcal vaccine
Percent of long-stay residents assessed and appropriately given the pneumococcal vaccine
Not Available
The number of residents or resident stays is too small to report. Call the facility to discuss this quality measure.
Percent of long-stay residents assessed and appropriately given the pneumococcal vaccine
Not Available
The number of residents or resident stays is too small to report. Call the facility to discuss this quality measure.
Flu vaccine
Percent of long-stay residents assessed and appropriately given the seasonal influenza vaccine
Not Available
The number of residents or resident stays is too small to report. Call the facility to discuss this quality measure.
Percent of long-stay residents assessed and appropriately given the seasonal influenza vaccine
Not Available
The number of residents or resident stays is too small to report. Call the facility to discuss this quality measure.
Short-stay residents
Rehab and recovery after a hospital stay · 5 measures
Physical & mental health
New antipsychotic medication
Percent of short-stay residents who newly received an antipsychotic medication
0.0%
↓ 100% · NC 1.4This facility: 0.0, 100% below the NC average of 1.4 (among NC facilities reporting a recent figure).Green: 5% or more better than the state average. Yellow: within 5%. Red: 5% or more worse.
Percent of short-stay residents who newly received an antipsychotic medication
0.0%
↓ 100% · NC 1.4This facility: 0.0, 100% below the NC average of 1.4 (among NC facilities reporting a recent figure).Green: 5% or more better than the state average. Yellow: within 5%. Red: 5% or more worse.Preventive care
Pneumococcal vaccine
Percent of short-stay residents assessed and appropriately given the pneumococcal vaccine
95.0%
↑ 17% · NC 81.4This facility: 95.0, 17% above the NC average of 81.4 (among NC facilities reporting a recent figure).Green: 5% or more better than the state average. Yellow: within 5%. Red: 5% or more worse.
Percent of short-stay residents assessed and appropriately given the pneumococcal vaccine
95.0%
↑ 17% · NC 81.4This facility: 95.0, 17% above the NC average of 81.4 (among NC facilities reporting a recent figure).Green: 5% or more better than the state average. Yellow: within 5%. Red: 5% or more worse.
Flu vaccine
Percent of short-stay residents assessed and appropriately given the seasonal influenza vaccine
Not Available
The number of residents or resident stays is too small to report. Call the facility to discuss this quality measure.
Percent of short-stay residents assessed and appropriately given the seasonal influenza vaccine
Not Available
The number of residents or resident stays is too small to report. Call the facility to discuss this quality measure.
Hospital & emergency visits
Re-hospitalized after admission
Percentage of short-stay residents who were re-hospitalized after their nursing home admission.
Percentage of short-stay residents who were re-hospitalized after their nursing home admission.
ER visits
Percentage of short-stay residents who had an outpatient emergency department visit.
Percentage of short-stay residents who had an outpatient emergency department visit.
Arrows show whether a figure is above or below the average. Green is better for residents, red is worse, and yellow means within 5% of the average. The line on each bar marks the average.
Quality measures are calculated by CMS from Minimum Data Set (MDS) resident assessments and Medicare claims.
Who this home usually serves
Residents split by who pays for their care: Medicare, Medicaid, or private pay and other sources.
Snapshot: CMS Long-Term Care Facility Characteristics (quarterly), Sep 2026
Resident snapshot
1 residents · Sep 2026
Residents counted on the date of the latest CMS report, which updates quarterly.
Medicare
0 · 0%
Medicaid
0 · 0%
Private pay & other
1 · 100%
Ginger Baker oversees day-to-day operations of the Hayes Barton Place campus, focusing on Bloomsbury at Hayes Barton Place. A nurse since 1995 with dual master’s degrees in Nursing and Healthcare Administration, she is a Certified Dementia Practitioner providing guidance to the memory support unit. Ginger is also active in community volunteering and enjoys family time and pageantry.
Living Spaces & Floor Plans for Hayes Barton Place
Places of interest near Hayes Barton Place
 2.0 miles from city center
Estimated distance in miles from Raleigh's city center to Hayes Barton Place's address, calculated via Google Maps.
— 2.41 miles to nearest hospital (Duke Raleigh Hospital, a Campus of Duke University Hospital)
Calculate Travel Distance to Hayes Barton Place
Add your location
Compare Nursing Homes around Raleigh
Info below is compiled from CMS reports & the NC Dept. of Health & Human Services (NCDHHS), senior community websites & trusted data sources such as Walk Score & BBB.
Communities are listed from highest-ranked to lowest-ranked based on our methodology.
The facility name. Click to view the full profile page on Assisted Living Magazine, including photos, services, and contact info.
|
CMS (Centers for Medicare & Medicaid Services, the federal agency that regulates nursing homes) Overall 5-star rating — a composite of Health Inspection, Staffing, and Quality Measures scores. 5 stars = top 10% nationally. 1 star = bottom 10%. The single most important number to start with when comparing facilities.
|
Care Types in This Table
AL (Assisted Living):
Housing with help for daily activities like bathing, dressing, and medication, without 24-hour skilled nursing.
NH (Nursing Home):
24/7 skilled nursing care for residents with complex, ongoing medical needs.
SNF (Skilled Nursing Facility):
Round-the-clock nursing care, often for recovery after surgery, injury, or illness.
MC (Memory Care):
Secured, specialized care for people living with Alzheimer's or dementia.
RC (Respite Care):
Short-term temporary care that gives family caregivers a break.
IL (Independent Living):
Community living with dining, activities, and transportation for active seniors who need little personal care.
HOS (Hospice Care):
Comfort-focused care for those with a terminal illness, prioritizing quality of life over treatment.
PC (Palliative Care):
Comfort-focused care for serious illness at any stage, including alongside curative treatment.
CCRC (Continuing Care Retirement Community):
A campus with multiple care levels so residents can age in place without moving.
|
Neighborhood or city area where the facility is located. Proximity to family, hospitals, and green space matters for both quality of life and ease of visitation. Consider drive time and transit access when evaluating location.
|
Licensed bed capacity. Larger facilities (300+ beds) often have more specialized programs but can feel institutional. Smaller homes (under 150 beds) tend to deliver more personalized care. Compare with Avg Res/Day to understand how full the facility typically runs.
|
Percentage of licensed beds filled on an average day. Color indicates financial health: green (90%+) = operationally strong, typically profitable. Amber (80–89%) = stable but leaving revenue on the table. Orange (70–79%) = financial strain likely, may struggle with fixed costs. Red (
|
This facility's occupancy rate compared to the statewide average for similar facilities. A positive number means above-average demand. Facilities running 5%+ above the state average are typically the most sought-after in their market — a strong proxy for reputation.
|
CMS-adjusted total nurse hours per resident per day (RN + LPN + CNA combined). The national average is approximately 3.5 hrs. Higher is better — more direct care time per resident. Below 3.0 is a red flag. CMS weights RN hours more heavily because RNs handle complex clinical decisions that CNAs cannot.
|
CMS Health Inspection star rating (1–5 stars), based on the 3 most recent annual state surveys plus any complaint investigations. This is the hardest rating to manipulate — it reflects real surveyor findings on-site. 5 stars = fewest deficiencies found. 1 star = most. It carries the heaviest weight in the Overall CMS rating.
|
CMS Staffing star rating (1–5 stars), based on daily nurse staffing hours submitted to CMS via verified payroll data. Compares RN, LPN, and CNA coverage relative to resident acuity level. 5 stars = well above expected staffing. Weekend staffing is evaluated separately, as that's where many facilities quietly reduce coverage.
|
CMS Quality Measures star rating (1–5 stars), based on 15 clinical outcome metrics including fall rates, pressure ulcers, antipsychotic drug use, and hospital readmissions. Captures actual resident health outcomes, not just compliance. High QM combined with low Health Inspection scores can indicate a facility with strong care but weak documentation practices.
|
Registered Nurse hours per resident/day compared to the statewide average. RNs are the highest-skilled nursing staff — they assess residents, manage medications, and respond to emergencies. A value of +50% means RN coverage is 50% above the state norm. Negative values are a concern for residents with complex or acute medical needs.
|
Total nursing staff hours (RN + LPN + CNA combined) per resident/day vs. the statewide average. A broader measure than RN vs State — it captures the entire care team. A facility can have high total staffing but low RN hours, meaning more aides and fewer nurses. Read both columns together for the full picture.
|
Total dollar amount of federal monetary fines (civil money penalties) issued by CMS in the past 3 years. Fines are only levied for serious violations — typically actual harm to residents, repeated uncorrected deficiencies, or systemic non-compliance. Even a single fine is noteworthy. Multiple fines strongly suggest a pattern, not isolated incidents.
|
Total health deficiency citations from the most recent standard inspection cycle. Minor citations (scope A–C) are common and often administrative in nature. Higher counts aren't always disqualifying, but should be read alongside Severe Citations to understand actual harm levels. Under 10 is strong for a large facility; 30+ warrants a closer look.
|
Average deficiency citations per CMS inspection (survey) in the reporting window — total citations divided by the number of inspections. Lower is better; compare alongside total Citations and Severe Citations for context.
|
Citations at CMS scope/severity level G or higher — G–I means actual harm occurred; J–L means residents were placed in immediate jeopardy. (D–F is potential for harm only). Examples include unaddressed falls, medication errors causing injury, neglect, or abuse.
|
Average number of residents in the building on any given day, derived from annual census data. Reflects true operating scale — a 400-bed facility running 200 residents/day operates very differently from one at 390. Higher resident counts generally mean more funded staffing hours.
|
Better Business Bureau rating (A+ to F). Reflects complaint history, business transparency, and how family disputes were resolved. A+ means no significant unresolved complaints. A blank (—) means the facility isn't BBB-accredited, which is common for healthcare providers and not necessarily a negative signal.
|
Walk Score® (0–100). Measures walkability of the surrounding area. 90–100 = Walker's Paradise. 70–89 = Very Walkable. 50–69 = Somewhat Walkable. Below 50 = Car-Dependent. Higher scores benefit family visitors, resident outings, and staff commuting.
|
The licensed owner or operator of record filed with CMS — the individual or organization legally accountable for the facility. Searching the operator name across other facilities can reveal chain or multi-site ownership, which matters: chain-operated homes tend to have more variable quality outcomes than independently run facilities.
|
What the home actually collects for resident care, after contractual allowances, bad debt and discounts — not gross billings. Taken from the latest complete annual cost report, so it is comparable across homes reporting the same period. Revenue alone doesn't indicate care quality, but it funds staffing and capital reinvestment. Pair with Payroll %. Figures are from each facility's most recent complete fiscal year — hover a value for the exact year; a * marks homes that report an older period than most facilities.
|
Staff salaries plus wage-related benefits from the latest complete annual cost report. Contract and agency labour is counted separately, under other operating costs, so a home leaning on agency staff can show a low figure here. Payroll is the cost most directly tied to care quality — compare with Payroll % for full context. Figures are from each facility's most recent complete fiscal year — hover a value for the exact year; a * marks homes that report an older period than most facilities.
|
Payroll as a share of NET PATIENT REVENUE (not gross revenue). Both figures come from the same cost-report year. A higher figure means more of each revenue dollar goes to staff pay. Read with the Staffing star rating to judge whether spend translates into coverage — and note that homes whose patient revenue covers only part of their operation can read implausibly high. The North Carolina average is: 61.1% Figures are from each facility's most recent complete fiscal year — hover a value for the exact year; a * marks homes that report an older period than most facilities.
|
CMS Certification Number: the unique federal identifier for this skilled nursing provider.
|
|---|---|---|---|---|---|---|---|---|---|---|---|---|---|---|---|---|---|---|---|---|---|---|---|---|
| The Rosewood Health Center – The Cypress of Raleigh | NH MC SNF | Raleigh (North Raleigh) | 57
Facility
57
NC AVG
93
Rank
#71 / 86 |
78.8%
Facility
78.8%
NC AVG
82.1%
Rank
#59 / 76 | -4% | 7.79
Facility
7.79
NC AVG
4.03
Rank
#2 / 80 | -10% | +93% | $0
Facility
$0
NC AVG
$67.5k
Rank
#1 / 86 | 7
Facility
7
NC AVG
18.3
Rank
#26 / 83 | 3.5
Facility
3.5
NC AVG
4.5
Rank
#37 / 83 | - | 45 | - |
71
Facility
71
NC AVG
33
Rank
#8 / 111 | The Cypress Of Raleigh LLC | $30.3MFiscal year ending 12/2024
Facility
$30.3MFiscal year ending 12/2024
NC AVG
$17.2M
Rank
#10 / 79 | $16.2MFiscal year ending 12/2024
Facility
$16.2MFiscal year ending 12/2024
NC AVG
$9.2M
Rank
#11 / 79 | 53.6%Fiscal year ending 12/2024
Facility
53.6%Fiscal year ending 12/2024
NC AVG
61.1%
Rank
#25 / 79 | 345546 | ||||
| College Pines Health and Rehabilitation Center | NH SNF | Connelly Springs | 100
Facility
100
NC AVG
93
Rank
#37 / 86 |
92.6%
Facility
92.6%
NC AVG
82.1%
Rank
#16 / 76 | +13% | 4.26
Facility
4.26
NC AVG
4.03
Rank
#37 / 80 | -21% | +6% | $16.8k
Facility
$16.8k
NC AVG
$67.5k
Rank
#55 / 86 | 6
Facility
6
NC AVG
18.3
Rank
#21 / 83 | 2.0
Facility
2.0
NC AVG
4.5
Rank
#15 / 83 | 2 | 93 | - |
6
Facility
6
NC AVG
33
Rank
#98 / 111 | - | $14.5MFiscal year ending 12/2024
Facility
$14.5MFiscal year ending 12/2024
NC AVG
$17.2M
Rank
#34 / 79 | $6.5MFiscal year ending 12/2024
Facility
$6.5MFiscal year ending 12/2024
NC AVG
$9.2M
Rank
#46 / 79 | 44.6%Fiscal year ending 12/2024
Facility
44.6%Fiscal year ending 12/2024
NC AVG
61.1%
Rank
#52 / 79 | 345446 | ||||
| Capital Nursing And Rehabilitation Center | NH AL HOS PC RC SNF | Raleigh (East Raleigh) | 125
Facility
125
NC AVG
93
Rank
#19 / 86 |
79.2%
Facility
79.2%
NC AVG
82.1%
Rank
#58 / 76 | -4% | 3.55
Facility
3.55
NC AVG
4.03
Rank
#62 / 80 | -8% | -12% | $0
Facility
$0
NC AVG
$67.5k
Rank
#1 / 86 | 14
Facility
14
NC AVG
18.3
Rank
#44 / 83 | 2.8
Facility
2.8
NC AVG
4.5
Rank
#25 / 83 | - | 99 | - |
43
Facility
43
NC AVG
33
Rank
#34 / 111 | Liberty Commons Nursing And Rehabilitation Center Of Wake County, LLC | $13.3MFiscal year ending 09/2024
Facility
$13.3MFiscal year ending 09/2024
NC AVG
$17.2M
Rank
#41 / 79 | $6.7MFiscal year ending 09/2024
Facility
$6.7MFiscal year ending 09/2024
NC AVG
$9.2M
Rank
#45 / 79 | 50.3%Fiscal year ending 09/2024
Facility
50.3%Fiscal year ending 09/2024
NC AVG
61.1%
Rank
#29 / 79 | 345202 | ||||
| Zebulon Rehabilitation Center | NH RC SNF | Zebulon | 60
Facility
60
NC AVG
93
Rank
#66 / 86 |
95.0%
Facility
95.0%
NC AVG
82.1%
Rank
#5 / 76 | +16% | 3.23
Facility
3.23
NC AVG
4.03
Rank
#75 / 80 | -2% | -20% | $0
Facility
$0
NC AVG
$67.5k
Rank
#1 / 86 | 11
Facility
11
NC AVG
18.3
Rank
#40 / 83 | 3.7
Facility
3.7
NC AVG
4.5
Rank
#42 / 83 | - | 57 | - |
50
Facility
50
NC AVG
33
Rank
#25 / 111 | Gabriella Skillen | $8.5MFiscal year ending 12/2024
Facility
$8.5MFiscal year ending 12/2024
NC AVG
$17.2M
Rank
#71 / 79 | $4.0MFiscal year ending 12/2024
Facility
$4.0MFiscal year ending 12/2024
NC AVG
$9.2M
Rank
#75 / 79 | 47.1%Fiscal year ending 12/2024
Facility
47.1%Fiscal year ending 12/2024
NC AVG
61.1%
Rank
#46 / 79 | 345104 | ||||
| Hayes Barton Place | - | NH AL CCRC IL MC SNF | Raleigh (Five Points) | 31
Facility
31
NC AVG
93
Rank
#77 / 86 |
22.3%
Facility
22.3%
NC AVG
82.1%
Rank
#76 / 76 | -73% | - | - | - | - | +10% | - | $0
Facility
$0
NC AVG
$67.5k
Rank
#1 / 86 | - | - | - | 7 | - |
59
Facility
59
NC AVG
33
Rank
#18 / 111 | - | - | - | - | 345581 |
Rank badges are statewide and care-type specific: each nursing home is ranked against every other NC nursing home we track that reports that metric, not just the 5 on this page. See how we rank facilities
Financial assistance
Get financial aid guidance Programs that may help with care and living costs in North Carolina
Hayes Barton Place is in Raleigh, North Carolina. These programs may support different care settings or living expenses. A listing does not confirm this community participates; our concierge team can help confirm.
VA Aid and Attendance (A&A) and Housebound Benefits
VA Aid and Attendance (A&A) and Housebound Benefits
- Who it is for
- Veterans or survivors with VA pension eligibility and an Aid and Attendance or Housebound medical need
- Income limit
- 2026 · Countable income is compared with the applicable maximum annual pension rate (MAPR), which varies by dependents and benefit category. For a veteran with one dependent and Aid and Attendance, MAPR is $34,488/year.
- Asset limit
- VA pension net-worth ceiling is $163,699 from December 1, 2025 through November 30, 2026. Net worth includes countable assets plus income for VA purposes; exclusions and transfer rules apply.
Eligibility
- General
- Aid and Attendance or Housebound is an increased VA pension rate for eligible veterans or surviving spouses who meet pension and additional care/disability requirements; it is not a stand-alone state benefit.
- NC specifics
- Federal VA pension rules apply nationwide.
What it provides
- Monthly pension is based on the applicable MAPR less countable annual income; divided by 12. Maximum annual veteran Aid and Attendance rates are $29,093 without dependents and $34,488 with one dependent; actual payments may be lower.
State/County Special Assistance (SA)
State/County Special Assistance (SA)
Eligibility
- General
- Low-income people who need help with room and board in an eligible residential facility, or who qualify for the separate in-home component because they are at risk of entering a residential facility.
- NC specifics
- Special Assistance has separate adult-care-home and in-home programs. The latter assists eligible people at risk of residential placement; rules and payment standards must be matched to the correct setting.
What it provides
- A cash supplement for eligible low-income residents toward residential-facility room and board; or separate assistance through the in-home program.
Community Alternatives Program for Disabled Adults
Community Alternatives Program for Disabled Adults
Eligibility
- General
- CAP/DA is a Medicaid home/community waiver for adults age 18+ with disabilities at risk of institutionalization who meet applicable Medicaid and care requirements.
What it provides
- Assessed supports may include personal care; adult day health; home accessibility adaptations; meals; respite; emergency-response services and assistive technology.
In-Home Aide Services
In-Home Aide Services
Eligibility
- General
- Age 60+, living at home, and unable to complete one or more daily-living or household tasks; a responsible helper is unavailable or the primary caregiver needs relief.
- NC specifics
- Local providers supported by the Home and Community Care Block Grant offer levels of home management, personal care and respite. Service must be appropriate for needs that can be safely met at home.
What it provides
- Assessed home-management help; personal care or caregiver respite.
Medicare Savings Program (MSP)
Medicare Savings Program (MSP)
- Who it is for
- Medicare beneficiaries with limited income who need help with premiums or cost sharing
Eligibility
- General
- Medicare beneficiary; the state determines the applicable Medicare Savings Program. QMB helps with premiums and Medicare cost sharing; SLMB and QI generally help with Part B premiums.
- NC specifics
- QI requires annual application and is funded first-come, first-served with priority for prior recipients. QMB, SLMB and QI confer Part D Extra Help.
What it provides
- QMB pays eligible Part A/Part B premiums and Medicare deductibles and cost sharing; SLMB and QI pay Part B premiums. The exact benefit depends on the approved program.
Low Income Energy Assistance Program (LIEAP)
Low Income Energy Assistance Program (LIEAP)
- Who it is for
- Income-eligible households responsible for home heating costs
- Income limit
- NC DHHS describes an income test based on 130% of the federal poverty guideline. Category-specific rules and current household-size tables should be checked.
- Asset limit
- NC DOA’s LIEAP description lists a household resource ceiling of $2,250.
Eligibility
- General
- Eligible households responsible for heating costs may receive LIEAP assistance; age 60+ households and certain disability households have an early application period.
- NC specifics
- Early applications run December 1–31 for qualifying older/disability households; others January 1–March 31 or until funds are exhausted. Crisis Intervention is a separate component with different rules.
What it provides
- One-time vendor payment toward heating costs; subject to eligibility and funding.
Know before you visit
Frequently Asked Questions about Hayes Barton Place
Quick answers from public records and the community's own listing.01 What neighborhood is Hayes Barton Place in?

Hayes Barton Place is in the Five Points neighborhood of Raleigh.
02 Is Hayes Barton Place in a walkable area?
Hayes Barton Place has a walk score of 59. Somewhat walkable. Some errands can be accomplished on foot, with a mix of nearby amenities.
03 What is the occupancy rate at Hayes Barton Place?
Hayes Barton Place's occupancy is 22.3%.
04 Are pets allowed at Hayes Barton Place?
Yes, Hayes Barton Place allows residents to bring their pets.
05 Does Hayes Barton Place operate as a for-profit or non-profit?
Hayes Barton Place is registered as a for-profit in NC.
06 How many beds does Hayes Barton Place have?
Hayes Barton Place has 31 beds.
07 Are there photos of Hayes Barton Place?
Yes — there are 6 photos of Hayes Barton Place in the photo gallery on this page.

Updated on