Santé of Chandler – Skilled Nursing & Rehabilitation
Nursing Home, Home Care, Hospice Care & Palliative Care · Chandler, AZ
CMS overall rating Info CMS (the Centers for Medicare & Medicaid Services) is the federal agency that rates nursing home quality. Its Overall Rating runs from 1 to 5 stars, combining health inspections, staffing, and quality measures, with inspections weighted most heavily.

Santé of Chandler – Skilled Nursing & Rehabilitation

Nursing Home, Home Care, Hospice Care & Palliative Care · Chandler, AZ
CMS overall rating Info CMS (the Centers for Medicare & Medicaid Services) is the federal agency that rates nursing home quality. Its Overall Rating runs from 1 to 5 stars, combining health inspections, staffing, and quality measures, with inspections weighted most heavily.
Calculator: See prices in your area
Santé of Chandler – Skilled Nursing & Rehabilitation accepts Medicare and private pay.

Overview of Santé of Chandler – Skilled Nursing & Rehabilitation

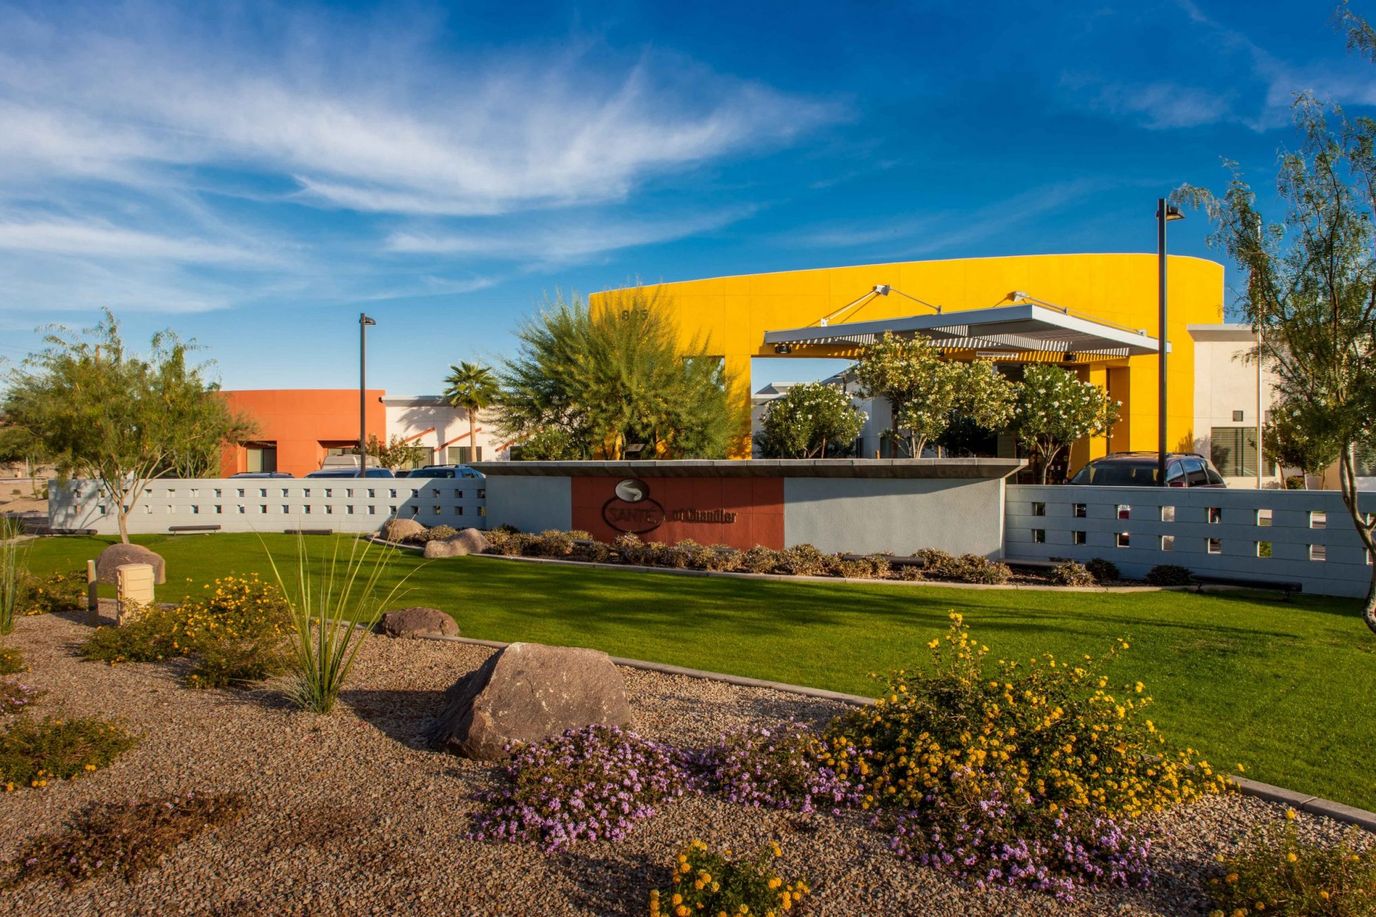
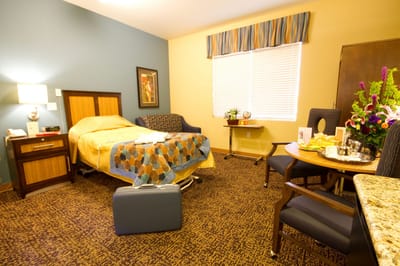
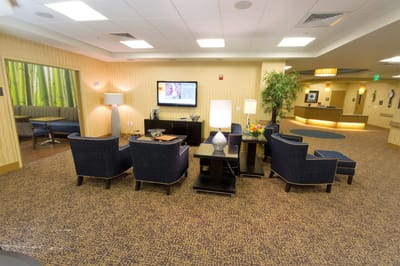
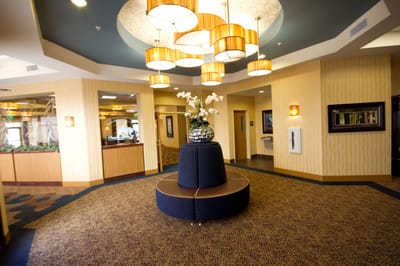
Santé of Chandler aims to reinvent the meaning of skilled nursing and rehabilitation for seniors through the exceptional care delivered by their patient-friendly staff to offer the best care possible for their residents; they are guaranteed to rejuvenate and recover in a safe and comfortable environment. Santé of Chandler does its best to ensure everyone can thrive in a home that gets to know its residents and empowers them to embrace a new chapter in their lives. 

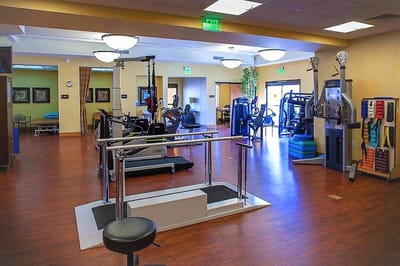
Specializing in long-term care, short-term rehabilitation, and memory care services, a list of services helps boost a speedy recovery. Wound care, joint replacement, physical therapy, non-ventilator-dependent, pain management, tube feeding, and surgical recovery are some of the interdisciplinary services offered.

Quality ratings

Measured by Centers for Medicare & Medicaid Services (CMS)

Overall rating Info The Overall CMS Rating combines results from health inspections, staffing levels and quality measures. Health inspections carry the most weight. Staffing and quality scores can increase or decrease the final rating based on performance compared to state and national standards.
▲ 50.8% Above AZ avg. ▲ 50.8% Above AZ avg.AZ average: 3.3Click the badge to see the full State ranking.Click here to see the full State ranking.
Health Inspection Info Based on the results of the facility's three most recent standard inspections and any complaint investigations. CMS reviews the number, scope, and severity of deficiencies, with more recent findings weighted more heavily.
▲ 44.4% Above AZ avg. ▲ 44.4% Above AZ avg.AZ average: 2.8Click the badge to see the full State ranking.Click here to see the full State ranking.
Staffing Info Measures average nursing staff hours per resident per day, including Registered Nurses (RNs) and total nursing staff. Ratings are adjusted based on the level of care residents require and are compared to state and national benchmarks.
▼ 34.1% Below AZ avg. ▼ 34.1% Below AZ avg.AZ average: 3.0Click the badge to see the full State ranking.Click here to see the full State ranking.
Quality Measures Info Based on clinical and physical health indicators reported to CMS, such as hospital readmissions, falls, pressure ulcers, and improvements in mobility. These measures reflect how well residents' health needs are being managed.
▲ 10.8% Above AZ avg. ▲ 10.8% Above AZ avg.AZ average: 4.5Click the badge to see the full State ranking.Click here to see the full State ranking.

Staffing hours breakdown

Info Daily nursing hours per resident by staff type, reported to CMS. Higher is generally better — compare this facility to state and national averages to see where staffing stands.

Hours per resident per day — compared to Arizona state averages

Staff typeHours / Day / Residentvs state avg
Registered Nurse (RN) Info RNs hold the highest nursing license and can assess residents, interpret test results, and direct care plans. More RN hours per day often signals stronger clinical oversight and faster response to health changes. 36m per day ▼ 17% State avg: 43m per day · National avg: 41m per day
LPN / LVN Info Licensed Practical Nurses (LPNs) or Licensed Vocational Nurses (LVNs) deliver routine hands-on care — medication administration, wound dressing, and monitoring vital signs. They work under RN supervision and make up a large share of daily bedside care. 1h 57m per day ▲ 86% State avg: 1h 3m per day · National avg: 52m per day
Nurse Aide Info Certified Nurse Aides (CNAs) provide the most direct day-to-day assistance: bathing, dressing, feeding, and mobility. Nurse aide hours are typically the largest staffing category and directly affect residents' quality of life. 2h 14m per day ▼ 6% State avg: 2h 22m per day · National avg: 2h 21m per day
Weekend Total Nursing Info Combined nursing hours (RN + LPN + Nurse Aide) per resident per day on weekends. Staffing often drops on weekends — this figure reveals whether the facility maintains adequate coverage outside of weekday hours. 4h 5m per day ▲ 13% State avg: 3h 38m per day · National avg: 3h 26m per day
Physical Therapist Info Hours per resident per day provided by licensed Physical Therapists (PTs) or PT Assistants. PT services help residents recover mobility after injury or illness and are especially important for post-acute (short-stay) rehabilitation. 16m per day ▲ 162% State avg: 6m per day · National avg: 4m per day
Weekend RN Info Registered nurse hours specifically on weekends. Facilities sometimes reduce RN presence on Saturdays and Sundays — a low weekend RN figure compared to weekday hours can indicate reduced clinical oversight when most administrative staff are absent. 22m per day ▼ 28% State avg: 31m per day · National avg: 29m per day

Capacity and availability

This home is often near full

Higher occupancy than the Arizona average: 72.7%
Occupancy rate
96.1% Rank #7 / 76Occupancy rate — State benchmarkedThis home is ranked 7th out of 76 homes in Arizona. Shows this facility's occupancy rate versus the Arizona average, with its Statewide rank out of 76. Higher occupancy signals strong local demand and financial stability.Rankings are based only on facilities in Arizona that report data for that category. Facilities without available data are excluded from the ranking.Click the rank badge to see the full State ranking.Click here to see the full State ranking.
Avg. Length of Stay
20 days
Bed community size
70-bed community
A moderately sized community that may balance personal attention with shared amenities and social activities.
Walk Score
Walk Score: 29 / 100
Somewhat walkable. A few nearby services may be reachable on foot, but most trips require transportation.

Contact Santé of Chandler – Skilled Nursing & Rehabilitation

Staffing Data

Reporting period: October 1 – December 31, 2025 (Q4 2025). Source: CMS Payroll-Based Journal report.

Total staff 196
Employees 145
Contractors 51
Staff to resident ratio 2.84 : 1
58% more staff per resident than Arizona average
Arizona average ratio: 1.80 : 1 Arizona average ratio: 1.80 : 1See full Arizona ranking
Avg staff/day 49
Average shift 8.5 hours
0% compared with Arizona average
Arizona average: 8.5 hours Arizona average shift: 8.5 hoursSee full Arizona ranking
Total staff hours (quarter) 38,368

Nursing staff breakdown

Q4 2025 · Oct 1 – Dec 31 More info This data comes from the CMS Payroll-Based Journal report covering October 1 – December 31, 2025.
Registered Nurse

Manages medical care and health needs.

RN Staff Info 11 total: 9 full-time employees and 2 contractors. 11
Average shift length Info Average shift length. Calculated as total hours divided by days worked and average staff per day. 10.7 hours
Licensed Practical Nurse

Assists with medical care and medications.

LPN Staff Info 33 total: 27 full-time employees and 6 contractors. 33
Average shift length Info Average shift length. Calculated as total hours divided by days worked and average staff per day. 11.1 hours
Certified Nursing Assistant

Helps with daily care and mobility.

CNA Staff Info 86 total: 52 full-time employees and 34 contractors. 86
Average shift length Info Average shift length. Calculated as total hours divided by days worked and average staff per day. 9.2 hours

Contractor staffing

Q4 2025 · Oct 1 – Dec 31 More info This data comes from the CMS Payroll-Based Journal report covering October 1 – December 31, 2025.

Total hours from contractors

3.6%

1,365 contractor hours this quarter

Certified Nursing Assistant: 34 Licensed Practical Nurse: 6 Other Physician: 4 Occupational Therapy Aide: 2 Registered Nurse: 2 Occupational Therapy Assistant: 1 Feeding Assistant: 1 Medical Director: 1

Staff by category

Q4 2025 · Oct 1 – Dec 31 More info This data comes from the CMS Payroll-Based Journal report covering October 1 – December 31, 2025.
Certified Nursing Assistant52348613,83492100%9.2
Licensed Practical Nurse2763310,58492100%11.1
Speech Language Pathologist130131,8298693%6.9
Physical Therapy Assistant7071,6448592%6.9
Respiratory Therapy Technician100101,6289098%6.1
Registered Nurse92111,5958592%10.7
Clinical Nurse Specialist4041,5848188%8.1
RN Director of Nursing3031,5277480%8.1
Physical Therapy Aide110111,2608693%5.3
Qualified Social Worker6069597683%6.9
Administrator1015286672%8
Nurse Practitioner1015286672%8
Mental Health Service Worker1015286672%8
Other Physician0441034953%1.5
Occupational Therapy Aide0221003336%3
Feeding Assistant011652628%2.5
Occupational Therapy Assistant011537986%0.7
Medical Director011191112%1.7
86 Certified Nursing Assistant
% of Days 100%
33 Licensed Practical Nurse
% of Days 100%
13 Speech Language Pathologist
% of Days 93%
7 Physical Therapy Assistant
% of Days 92%
10 Respiratory Therapy Technician
% of Days 98%
11 Registered Nurse
% of Days 92%
4 Clinical Nurse Specialist
% of Days 88%
3 RN Director of Nursing
% of Days 80%
11 Physical Therapy Aide
% of Days 93%
6 Qualified Social Worker
% of Days 83%
1 Administrator
% of Days 72%
1 Nurse Practitioner
% of Days 72%
1 Mental Health Service Worker
% of Days 72%
4 Other Physician
% of Days 53%
2 Occupational Therapy Aide
% of Days 36%
1 Feeding Assistant
% of Days 28%
1 Occupational Therapy Assistant
% of Days 86%
1 Medical Director
% of Days 12%

Penalties and fines

Federal penalties imposed by CMS for regulatory violations, including civil money penalties (fines) and denials of payment for new Medicare/Medicaid admissions.

Source: CMS Penalties Database

No penalties in the past 3 years

No civil money penalties or payment denials were reported in the last 3 years.

Quality of care over time

These measures show how residents usually do over time at this home, based on health outcomes and preventive care.

Short-stay resident measures
Significantly above average Arizona avg: 4.2 Info CMS star rating based on short-stay quality measure performance. 5 stars = much above average, 1 star = much below average.
Pneumococcal Vaccine Info Percent of short-stay residents assessed and appropriately given the pneumococcal vaccine 96.4%
5% better than Arizona average

Arizona average: 91.5%

Antipsychotic medication increase Info Percent of short-stay residents who newly received an antipsychotic medication 1.2%
20% worse than Arizona average

Arizona average: 1.0%

Influenza Vaccine Info Percent of short-stay residents assessed and appropriately given the seasonal influenza vaccine 93.1%
7% better than Arizona average

Arizona average: 87.3%

Re-hospitalized after SNF stay Info Percentage of short-stay residents who were re-hospitalized after their nursing home admission. 23.6%
In line with Arizona average

Arizona average: 24.6%

Emergency department visits Info Percentage of short-stay residents who had an outpatient emergency department visit. 9.5%
11% better than Arizona average

Arizona average: 10.7%

Falls with major injury Info Percentage of SNF residents who experience falls with major injury during their stay. 0.4%
45% better than Arizona average

Arizona average: 0.8%

Ability to care for self at discharge Info Percentage of residents at or above expected ability to care for themselves at discharge. 65.0%
21% better than Arizona average

Arizona average: 53.7%

Successful return to home or community Info Rate of successful return to home or community from a skilled nursing facility. 67.6%
34% better than Arizona average

Arizona average: 50.6%

Breakdown by payment type

Medicare

67% of new residents, usually for short-term rehab.

Typical stay 21 days

Private pay

33% of new residents, often for short stays.

Typical stay 20 days

Facility Characteristics

Source: CMS Long-Term Care Facility Characteristics (Data as of Jan 2026)

Total residents 69
Medicare
63
91.3% of residents
Private pay or other
6
8.7% of residents

Finances and operations

Based on CMS SNF Cost Report for fiscal year ending in 12/2023.

For-profit
Operated by a single business entity.
Net patient revenue Info Net patient revenue — what the home actually collects for resident care, after contractual allowances, bad debt and discounts are subtracted from its gross charges (CMS cost report, Worksheet G-3). It covers resident care only; money the home earns from other sources is shown separately as "Other income."
$14.9M
Net patient income Info Net patient income: net patient revenue minus the home's total operating expenses. A positive figure means it earns more from resident care than it spends to deliver it; a negative figure means the opposite. It excludes non-operating "other income."
-$77.1K
For-profit Operated by a single business entity.
Net patient revenue Info Net patient revenue — what the home actually collects for resident care, after contractual allowances, bad debt and discounts are subtracted from its gross charges (CMS cost report, Worksheet G-3). It covers resident care only; money the home earns from other sources is shown separately as "Other income."
$14.9M Rank #11 / 79Revenue — State benchmarkedThis home is ranked 11th out of 79 homes in Arizona. Shows this facility's annual revenue compared to the Arizona average. Higher revenue generally means more resources for staffing and capital — read alongside Payroll %.Rankings are based only on facilities in Arizona that report data for that category. Facilities without available data are excluded from the ranking.Click the rank badge to see the full State ranking.Click here to see the full State ranking.
Net patient income Info Net patient income: net patient revenue minus the home's total operating expenses. A positive figure means it earns more from resident care than it spends to deliver it; a negative figure means the opposite. It excludes non-operating "other income."
-$77.1K
Other income Info Money the home earns outside of resident care — such as investments, grants, rentals and other non-operating sources (CMS cost report, Worksheet G-3). It is tracked separately from net patient revenue: it is not part of that figure, and it is not included in net patient income.
$215.4K
Payroll costs Info Staff salaries plus wage-related costs — benefits such as payroll taxes, health insurance and retirement — from the home's own accounting records (CMS cost report, Worksheet A). Contract or agency labor is counted separately, under other operating costs. Rank #33 / 79Payroll — State benchmarkedThis home is ranked 33rd out of 79 homes in Arizona. Shows total annual staff payroll benchmarked to the Arizona average. Higher payroll investment relative to peers often signals better staffing and less reliance on cheaper contract labor.Rankings are based only on facilities in Arizona that report data for that category. Facilities without available data are excluded from the ranking.Click the rank badge to see the full State ranking.Click here to see the full State ranking.
$7.7M 52.1% of net patient revenue Info Payroll as a share of revenue: staff salaries and wage-related benefits divided by net patient revenue. A higher figure means more of each revenue dollar goes to staff pay. Rank #77 / 79Payroll % — State benchmarkedThis home is ranked 77th out of 79 homes in Arizona. Shows payroll as a percentage of revenue versus the Arizona average. Well-run Arizona facilities typically land around 58–71% — the top third Statewide. Below 25% may signal understaffing or heavy agency use — read with Staffing ratings.Rankings are based only on facilities in Arizona that report data for that category. Facilities without available data are excluded from the ranking.Click the rank badge to see the full State ranking.Click here to see the full State ranking.
Other operating costs Info Everything it costs to run the home apart from payroll — food, utilities, supplies, maintenance, contract labor and administration. Calculated as total operating expense minus payroll (staff salaries and wage-related benefits).
$7.2M
Total costs Info The home's total operating expense for the year — all the costs of running it, salaries included (CMS cost report, Worksheet G-3).
$15.0M

Who this home usually serves

TYPE OF STAY

Mostly short-term rehab stays

Most residents typically stay for a few weeks or months before returning home or moving on.

Most new residents arrive under Medicare (67% of admissions), and a typical Medicare stay runs around 21 days.

Admissions
1,196 total

Coverage residents most often arrive under.

Medicare 67%
Private pay 33%
Discharges
1,202 total

Coverage residents most often leave under.

Medicare 65%
Private pay 35%

Santé of Chandler – Skilled Nursing & Rehabilitation Reviews

Sandra Hane
Hannah Petty was an excellent CNA throughout my rehab days, she was over and beyond with help and she checks on me even without pushing my call light. I will recommend this facility to anyone because you have good workers like her. I'm happy to go homeWhat do you like most about living here? Answer: Wonderful workers who are ready to help Are there enough caregivers to handle the residents' needs, especially during emergencies? Answer: Yes Are the common areas pleasant and comfortable for socializing or relaxing? Answer: Yes How would you rate the quality and variety of the meals? (1-5) Answer: 5 Are special diets handled well? Answer: Yes Is the dining schedule flexible enough to meet your preferences? Answer: Yes How do you feel about the level of social interaction available with other residents? Answer: Treated welly How was the units offered in this community? Answer: Yes Do you feel safe living in this community? Answer: Yes How well do you think the community handles emergencies or unexpected events? Answer: Very quick and with respect Are there any hidden fees or unexpected charges? Answer: No Would you recommend this community to others looking for senior living options? Answer: Yes Is there anything you wish you knew before moving in? Answer: I'm Happy

Places of interest near Santé of Chandler – Skilled Nursing & Rehabilitation

Address 3.6 miles from city center Info Estimated distance in miles from Chandler's city center to Santé of Chandler – Skilled Nursing & Rehabilitation's address, calculated via Google Maps.

Calculate Travel Distance to Santé of Chandler – Skilled Nursing & Rehabilitation

Add your location

Address

Compare Nursing Homes around Chandler

The information below is reported by the Arizona Department of Health Services, Bureau of Long Term Care Licensing.

5 facilities compared · CMS & AZ Dept. of Health data

Archstone Care Center
NH
Chandler (West Pecos Road)120
45.8%
Facility 45.8%
AZ AVG 72.7%
Rank #64 / 76
-37%
3.67
Facility 3.67
AZ AVG 4.06
Rank #43 / 71
+6%-10%
$0
Facility $0
AZ AVG $31.7k
Rank #1 / 75
77
Facility 77
AZ AVG 82
Rank #16 / 53
16
Facility 16
AZ AVG 23.2
Rank #27 / 75
4.0
Facility 4.0
AZ AVG 3.8
Rank #42 / 75
-55- 29 Beh Properties Inc
$10.0M
Facility $10.0M
AZ AVG $14.7M
Rank #68 / 79
$5.5M
Facility $5.5M
AZ AVG $6.4M
Rank #53 / 79
55.4%
Facility 55.4%
AZ AVG 48.1%
Rank #10 / 79
35130
Santé of Chandler – Skilled Nursing & Rehabilitation
NH
HC
PC
Chandler (South 94Th Street)70
96.1%
Facility 96.1%
AZ AVG 72.7%
Rank #7 / 76
+32%- -44%-
$0
Facility $0
AZ AVG $31.7k
Rank #1 / 75
-
10
Facility 10
AZ AVG 23.2
Rank #11 / 75
5.0
Facility 5.0
AZ AVG 3.8
Rank #58 / 75
-68- 29 Santana Falls LLC
$14.9M
Facility $14.9M
AZ AVG $14.7M
Rank #11 / 79
$7.7M
Facility $7.7M
AZ AVG $6.4M
Rank #33 / 79
52.1%
Facility 52.1%
AZ AVG 48.1%
Rank #77 / 79
35283
Chandler Post Acute and Rehabilitation
NH
Chandler (West Elgin Street)120
85.0%
Facility 85.0%
AZ AVG 72.7%
Rank #25 / 76
+17%
4.05
Facility 4.05
AZ AVG 4.06
Rank #30 / 71
-3%0%
$15.9k
Facility $15.9k
AZ AVG $31.7k
Rank #70 / 75
74
Facility 74
AZ AVG 82
Rank #20 / 53
18
Facility 18
AZ AVG 23.2
Rank #28 / 75
2.0
Facility 2.0
AZ AVG 3.8
Rank #6 / 75
-106- 44 Brett Jones
$17.9M
Facility $17.9M
AZ AVG $14.7M
Rank #37 / 79
$9.2M
Facility $9.2M
AZ AVG $6.4M
Rank #24 / 79
51.4%
Facility 51.4%
AZ AVG 48.1%
Rank #12 / 79
35101
Desert Cove Nursing Center
NH
Chandler120
52.8%
Facility 52.8%
AZ AVG 72.7%
Rank #61 / 76
-27%
3.43
Facility 3.43
AZ AVG 4.06
Rank #55 / 71
-7%-16%
$0
Facility $0
AZ AVG $31.7k
Rank #1 / 75
-
35
Facility 35
AZ AVG 23.2
Rank #60 / 75
3.5
Facility 3.5
AZ AVG 3.8
Rank #35 / 75
166- 57 Life Care Affiliates II
$8.2M
Facility $8.2M
AZ AVG $14.7M
Rank #51 / 79
$5.3M
Facility $5.3M
AZ AVG $6.4M
Rank #58 / 79
65.5%
Facility 65.5%
AZ AVG 48.1%
Rank #41 / 79
35095
Dobson Home (Hospice of the Valley – Chandler) -
NH
HC
Chandler (Ironwood Vistas)11--------------A+ 48 Hospice Of The Valley Dobson Home---31505

Financial Assistance for
Nursing Home in Arizona

Santé of Chandler – Skilled Nursing & Rehabilitation is located in Chandler, Arizona.
Here are the financial assistance programs available to residents in Arizona.

Get Financial aid guidance

Arizona Long Term Care System

ALTCS

Age 65+ or disabled
General Arizona resident, Medicaid-eligible, nursing home-level care need.
Income Limits (2025) ~$2,829/month 300% FBR, individual
Asset Limits $2,000 (individual), $3,000 (couple).
AZ

Covers tribal members; rural outreach.

Benefits
In-home care (6-8 hours/day) Assisted living Nursing home care Medical services Transportation (10 trips/month)

Non-Medical Home and Community Based Services

AZ DES Non-Medical HCBS

Age 60+
General Arizona resident, at risk of institutionalization.
Income Limits ~$2,000/month individual, varies
Asset Limits $10,000 individual
AZ

Limited funding; waitlists common.

Benefits
Homemaker services (3-5 hours/week) Respite care (up to 10 days/year) Adult day care (~$60/day)

Weatherization Assistance Program (WAP)

AZ WAP

Age 60+ priority
General Arizona resident, own/rent home, low-income.
Income Limits (2025) ~$2,510/month 200% of poverty level, individual
Asset Limits Not applicable; income-focused.
AZ

High demand in rural desert areas; limited annual funds.

Benefits
Insulation Weather stripping HVAC repairs (avg. $500-$1,000/year savings)

Section 202 Supportive Housing for the Elderly

AZ Section 202

Age 62+
General Arizona resident, very low income, able to live independently with support.
Income Limits (2025) ~$1,645/month 50% of area median income, individual, varies by county
Asset Limits $10,000 individual, excludes home if owned
AZ

Limited units; high demand in metro areas like Phoenix.

Benefits
Subsidized rent (30% of income, e.g., $300-$500/month) On-site services (housekeeping, transportation, ~$200/month value)

Arizona CARES Program

AZ CARES

Age
General Caregivers of Arizona residents 60+ needing help with 3+ daily activities; no caregiver age limit.
Income Limits No strict limit; cost-sharing above ~$2,500/month threshold.
Asset Limits Not applicable; need-based.
AZ

Focus on rural access; complements ALTCS respite.

Benefits
Respite care (up to 10 days/year) Counseling (4-6 sessions/year) Training (2-3 workshops/year) Supplies (~$200/year)

AZ DES Non-Medical Home and Community Based Services (HCBS)

AZ DES Non-Medical HCBS

Age 60+ or disabled
General Arizona resident, need assistance with daily activities, not eligible for Medicaid/ALTCS.
Income Limits Above Medicaid threshold but low-income ~$1,500-$2,500/month, varies by region
Asset Limits Not specified; income-driven eligibility.
AZ

Targets those ineligible for ALTCS; prioritizes rural and tribal areas.

Benefits
Homemaker services (3-5 hours/week) Personal care (limited hours) Respite care (up to 10 days/year) Transportation (~5 trips/month)

Frequently Asked Questions about Santé of Chandler – Skilled Nursing & Rehabilitation

What neighborhood is Santé of Chandler – Skilled Nursing & Rehabilitation in?

Santé of Chandler – Skilled Nursing & Rehabilitation is in the South 94th Street neighborhood.

Is Santé of Chandler – Skilled Nursing & Rehabilitation in a walkable area?

Santé of Chandler – Skilled Nursing & Rehabilitation has a walk score of 29. Somewhat walkable. A few nearby services may be reachable on foot, but most trips require transportation.

What is the occupancy rate at Santé of Chandler – Skilled Nursing & Rehabilitation?

Santé of Chandler – Skilled Nursing & Rehabilitation's occupancy is 96.1%.

Does Santé of Chandler – Skilled Nursing & Rehabilitation operate as a for-profit or non-profit?

Santé of Chandler – Skilled Nursing & Rehabilitation is registered as a for-profit.

Are there photos of Santé of Chandler – Skilled Nursing & Rehabilitation?

Yes — there are 7 photos of Santé of Chandler – Skilled Nursing & Rehabilitation in the photo gallery on this page.

What is the address of Santé of Chandler – Skilled Nursing & Rehabilitation?

Santé of Chandler – Skilled Nursing & Rehabilitation is located at 825 S 94Th St, Chandler, AZ 85224.

What is the phone number of Santé of Chandler – Skilled Nursing & Rehabilitation?

(480) 361-6636 will put you in contact with the team at Santé of Chandler – Skilled Nursing & Rehabilitation.

Guides for Better Senior Living

Care Cost Calculator: See Prices in Your Area

Nursing Home Data Explorer

Don’t Wait Too Long: 7 Red Flag Signs Your Parent Needs Assisted Living Now

The True Cost of Assisted Living in 2025 – And How Families Are Paying For It

Understanding Senior Living Costs: Pricing Models, Discounts & Financial Assistance