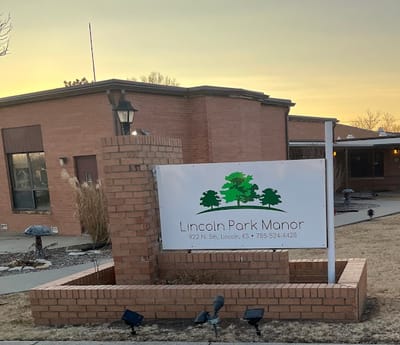
Lincoln Park Manor Inc
Nursing Home · Kansas, KS
CMS overall rating Info The Overall CMS Rating is scored from 1 to 5 stars and combines results from health inspections, staffing levels, and quality measures. Health inspections carry the most weight. Staffing and quality scores can increase or decrease the final rating based on performance compared to state and national standards.

Lincoln Park Manor Inc

Nursing Home · Kansas, KS
CMS overall rating Info The Overall CMS Rating is scored from 1 to 5 stars and combines results from health inspections, staffing levels, and quality measures. Health inspections carry the most weight. Staffing and quality scores can increase or decrease the final rating based on performance compared to state and national standards.
Calculator: See prices in your area
Lincoln Park Manor Inc accepts Medicare, Medicaid, and private pay.

Overview of Lincoln Park Manor INC

Lincoln Park Manor, Inc is a senior care facility located in Lincoln, Kansas. It offers skilled nursing services, rehabilitative care, and long-term care. The facility emphasizes personalized care and aims to enhance the quality of life for its residents.
(785) 524-4428

Quality ratings

Measured by Centers for Medicare & Medicaid Services (CMS)

Overall rating Info The Overall CMS Rating combines results from health inspections, staffing levels and quality measures. Health inspections carry the most weight. Staffing and quality scores can increase or decrease the final rating based on performance compared to state and national standards.
▲ 8.3% Above KS avg. ▲ 8.3% Above KS avg.Click the badge to see the full State ranking.Click here to see the full State ranking.
Health Inspection Info Based on the results of the facility's three most recent standard inspections and any complaint investigations. CMS reviews the number, scope, and severity of deficiencies, with more recent findings weighted more heavily.
▲ 12.8% Above KS avg. ▲ 12.8% Above KS avg.Click the badge to see the full State ranking.Click here to see the full State ranking.
Staffing Info Measures average nursing staff hours per resident per day, including Registered Nurses (RNs) and total nursing staff. Ratings are adjusted based on the level of care residents require and are compared to state and national benchmarks.
▲ 10.8% Above KS avg. ▲ 10.8% Above KS avg.Click the badge to see the full State ranking.Click here to see the full State ranking.
Quality Measures Info Based on clinical and physical health indicators reported to CMS, such as hospital readmissions, falls, pressure ulcers, and improvements in mobility. These measures reflect how well residents' health needs are being managed.
▼ 37.7% Below KS avg. ▼ 37.7% Below KS avg.Click the badge to see the full State ranking.Click here to see the full State ranking.

Staffing hours breakdown

Info Daily nursing hours per resident by staff type, reported to CMS. Higher is generally better — compare this facility to state and national averages to see where staffing stands.

Hours per resident per day — compared to Kansas state averages

Total nursing care / resident Info This home is ranked 47th out of 133 homes in Kansas.

Total adjusted nursing hours per resident per day, combining RN, LPN, and aide time. CMS adjusts this for case-mix so facilities can be fairly compared.
4h 53m per day
Rank #47 / 133Nurse hours — State benchmarkedThis home is ranked 47th out of 133 homes in Kansas.Shows adjusted nurse hours per resident per day benchmarked to the Kansas average, with a ranking across 133 Kansas SNFs. More hours mean more direct care. The national average is about 3.5 hrs; below 3.0 is a red flag.Click the rank badge to see the full State ranking.Click here to see the full State ranking.
This facility Kansas avg (4h 43m per day)
vs Kansas avg
+4%

3 of 6 metrics below state avg

Standout metric Nurse Aide is +9% above state avg
Staff typeHours / Day / Residentvs state avg
Registered Nurse (RN) Info RNs hold the highest nursing license and can assess residents, interpret test results, and direct care plans. More RN hours per day often signals stronger clinical oversight and faster response to health changes. 33m per day ▼ 23% State avg: 43m per day · National avg: 41m per day
LPN / LVN Info Licensed Practical Nurses (LPNs) or Licensed Vocational Nurses (LVNs) deliver routine hands-on care — medication administration, wound dressing, and monitoring vital signs. They work under RN supervision and make up a large share of daily bedside care. 41m per day ■ Avg State avg: 40m per day · National avg: 52m per day
Nurse Aide Info Certified Nurse Aides (CNAs) provide the most direct day-to-day assistance: bathing, dressing, feeding, and mobility. Nurse aide hours are typically the largest staffing category and directly affect residents' quality of life. 2h 56m per day ▲ 9% State avg: 2h 41m per day · National avg: 2h 20m per day
Total Nursing (Weekend) Info Combined nursing hours (RN + LPN + Nurse Aide) per resident per day on weekends. Staffing often drops on weekends — this figure reveals whether the facility maintains adequate coverage outside of weekday hours. 3h 49m per day ▲ 6% State avg: 3h 35m per day · National avg: 3h 26m per day
Physical Therapist Info Hours per resident per day provided by licensed Physical Therapists (PTs) or PT Assistants. PT services help residents recover mobility after injury or illness and are especially important for post-acute (short-stay) rehabilitation. 1m per day ▼ 50% State avg: 2m per day · National avg: 4m per day
RN (Weekend) Info Registered nurse hours specifically on weekends. Facilities sometimes reduce RN presence on Saturdays and Sundays — a low weekend RN figure compared to weekday hours can indicate reduced clinical oversight when most administrative staff are absent. 17m per day ▼ 43% State avg: 30m per day · National avg: 28m per day

Capacity and availability

Avg. Length of Stay
625 days

Who this home usually serves

TYPE OF STAY

Mostly long-term care residents

Most residents stay for extended periods and receive ongoing daily care.

Breakdown by payment type

Medicare

31% of new residents, usually for short-term rehab.

Typical stay 5 years

Private pay

44% of new residents, often for short stays.

Typical stay 3 years

Medicaid

25% of new residents, often for long-term daily care.

Typical stay 4 years

Finances and operations

Privately-owned community
Operated by a business corporation.
Home revenue
$4.8M
Operating loss
-$167.9K
Privately-owned community Operated by a business corporation.
Home revenue
$4.8M Rank #91 / 134Revenue — State benchmarkedThis home is ranked 91st out of 134 homes in Kansas.Shows this facility's annual revenue compared to the Kansas SNF average. Higher revenue generally means more resources for staffing and capital — read alongside Payroll %.Click the rank badge to see the full State ranking.Click here to see the full State ranking.
Operating loss
-$167.9K
Payroll costs Info The portion of the home's budget spent on staff, including nurses, caregivers, and other employees who support care and operations. Rank #91 / 134Payroll — State benchmarkedThis home is ranked 91st out of 134 homes in Kansas.Shows total annual staff payroll benchmarked to the Kansas average. Higher payroll investment relative to peers often signals better staffing and less reliance on cheaper contract labor.Click the rank badge to see the full State ranking.Click here to see the full State ranking.
$2.5M
53.3% of revenue Rank #55 / 134Payroll % — State benchmarkedThis home is ranked 55th out of 134 homes in Kansas.Shows payroll as a percentage of revenue versus the Kansas average. Well-run Kansas SNFs typically land around 57–67% — the top third Statewide. Below 25% may signal understaffing or heavy agency use — read with Staffing ratings.Click the rank badge to see the full State ranking.Click here to see the full State ranking.
Other operating costs Info All remaining costs needed to run the home, such as food, utilities, building maintenance, supplies and administrative expenses.
$2.4M
Total costs $4.9M
Bed community size
36-bed community Rank #128 / 137Bed count — State benchmarkedThis home is ranked 128th out of 137 homes in Kansas.Shows this facility's certified or reported bed count compared to other Kansas SNFs. Larger communities may offer more amenities, programs, and on-site services for residents and families.Click the rank badge to see the full State ranking.Click here to see the full State ranking.
A moderately sized community that may balance personal attention with shared amenities and social activities.
Walk Score
Walk Score: 53 / 100 Rank #61 / 135Walk Score — State benchmarkedThis home is ranked 61st out of 135 homes in Kansas.Shows how walkable this facility's neighborhood is compared to the average Walk Score across Kansas SNFs. Higher scores benefit residents, families, and staff.Click the rank badge to see the full State ranking.Click here to see the full State ranking.
Moderately walkable. Some errands can be accomplished on foot, with a mix of nearby amenities.

About this community

Occupancy

Occupancy rate
81%
Rank #91 / 137Occupancy rate — State benchmarkedThis home is ranked 91st out of 137 homes in Kansas.Shows this facility's occupancy rate versus the Kansas average, with its Statewide rank out of 137. Higher occupancy signals strong local demand and financial stability.Click the rank badge to see the full State ranking.Click here to see the full State ranking.
Similar to the Kansas average: 79.5%
Occupied beds
29 / 36
Average residents per home in Kansas 50 per day

License Details

Facility TypeNursing Facility | Assisted Living Facility
StatusActive
CountyLincoln
License Number175419
CMS Certification Number175419

Ownership & Operating Entity

Lincoln Park Manor Inc is administrated by Diane Walters.

Owner NameLincoln County

Therapy & Rehabilitation

2 services
Rehabilitation Services
Short-Term Rehab

Staffing & Medical

2 services
Doctor on Staff
24-Hour Staffing

Additional Policies & Features

Admission CriteriaAdmission to the health services center requires a thorough assessment and consultation with our professional team and the individual’s personal physician.

Amenities & Lifestyle

Three Meals A Day Plus Snacks
Beauty And Barber Services
Spiritual
Intellectual And Social Opportunities
Use Of Community Common Spaces
Specific ProgramsPhysician-led medical services, Physician care available seven days a week, Highly trained on-site therapists, Social Service staff assisting with transitions post rehab, Nursing team on-site 24/7, Assistance with activities of daily living, Coordination of medical services and after care.

Dining & Nutrition

Food DescriptionThree meals a day plus snacks.

Contact Lincoln Park Manor Inc

Inspection History

In Kansas, the Department for Aging and Disability Services, Survey and Certification Commission performs the unannounced inspections required for facility licensing and federal certification.

Since 2011 · 15 years of data 77 deficiencies

Inspection Scorecard Info This scorecard compares key inspection, citation, and complaint metrics at this facility against the Kansas state average. Metrics rated ≥15% worse than average are highlighted in red; those ≥15% better are highlighted in green.

Since 2011 vs. Kansas state average
Latest Inspection September 4, 2025

Deficiencies Info Deficiencies are formal regulatory issues recorded during state inspections.

MetricThis FacilityKS Averagevs. KS Avg
Total deficiencies Info Formal regulatory issues recorded by inspectors across all inspection types. 77100 This facility has 23% fewer total deficiencies than a typical Kansas nursing home (77 vs. KS avg 100). Click this badge to view the full Kansas ranking.↓ 23% better
Deficiencies per year Info Average deficiencies per year since 2011. 5.16.7 This facility has 24% fewer deficiencies per year than a typical Kansas nursing home (5.1 vs. KS avg 6.7). Click this badge to view the full Kansas ranking.↓ 24% better

Inspection Reports Summary Info An editor-reviewed summary of the themes and findings across this facility's recent inspection reports.

The most recent inspection on June 29, 2016, found no deficiencies after a follow-up visit verified correction of prior issues. Earlier inspections showed a pattern of deficiencies related mainly to resident care practices, infection control, and safety measures, including failure to notify physicians, inadequate meal assistance, unsecured hazardous materials, and unsanitary kitchen conditions. Complaint investigations included unsubstantiated abuse allegations and some failures in abuse reporting and investigation procedures. Enforcement actions such as immediate jeopardy findings and payment denials occurred in 2015 but were followed by corrective plans and subsequent compliance. The facility’s inspection history indicates improvement over time, with recent reports showing resolution of previously cited deficiencies.

Read the full inspection reports for this facility, including detailed findings and corrective actions.

Show Inspection Reports

Health Inspection History

Inspections Since 2022
Total health inspections 3

Kansas average 4.5


Last Health inspection on Aug 2025

Total health citations
37 Rank #102 / 135Health citations — State benchmarkedThis home is ranked 102nd out of 135 homes in Kansas.Shows this facility's total health deficiency citations benchmarked to the Kansas State average, with a ranking across all 135 KS SNFs. Lower citation counts earn a better rank.Click the rank badge to see the full State ranking.Click here to see the full State ranking.

Kansas average 26.9

Citations per inspection
12.33 Rank #132 / 135Citations per inspection — State benchmarkedThis home is ranked 132nd out of 135 homes in Kansas.Shows average deficiency citations per CMS inspection for this facility versus the Kansas mean across 135 SNFs with citation data. Lower is better.Click the rank badge to see the full State ranking.Click here to see the full State ranking.

Kansas average 6.07


Health citations are formal notices following inspections when they fail to comply with safety and care standards.

All 37 citations resulted from standard inspections.

Breakdown of citation severity (last 4 years)
Critical Health citations
0
100% better than Kansas average

Kansas average: 0.9


Serious Health citations
0
100% better than Kansas average

Kansas average: 0.9

0 critical citations Kansas average: 0.9

0 serious citations Kansas average: 0.9

37 moderate citations Kansas average: 24.6

0 minor citations Kansas average: 0.5
Citations history (last 4 years)
Abuse/Neglect moderate citation Aug 20, 2025

Administration moderate citation Aug 20, 2025

Infection Control moderate citation Aug 20, 2025

Nutrition moderate citation Aug 20, 2025

Financial Assistance for
Nursing Home in Kansas

Lincoln Park Manor Inc is located in LINCOLN, Kansas.
Here are the financial assistance programs available to residents in Kansas.

Get Financial aid guidance

Frail Elderly Waiver

Kansas Medicaid FE Waiver

Age 65+
General Kansas resident, Medicaid-eligible, nursing home- level care need.
Income Limits (2025) ~$2,829/month 300% FBR, individual
Asset Limits $2,000 (individual), $3,000 (couple).
KS

Requires care level assessment.

Benefits
Personal care (5-7 hours/day) Respite (240 hours/year) Adult day care (~$60/day) Home aides

Senior Care Act

Kansas SCA

Age 60+
General Kansas resident, at risk of nursing home.
Income Limits ~$1,800/month individual, varies
Asset Limits $2,000 individual
KS

Limited funding; waitlists common.

Benefits
In-home care (3-5 hours/week) Respite (up to 10 days/year) Homemaker services

Medicare Savings Program (MSP)

Kansas Medicare Savings Program

Age 65+ or disabled
General Kansas resident, Medicare Part A/B.
Income Limits (2025) ~$2,510/month (QMB), ~$3,380/month (SLMB), ~$3,598/month (QI)—individual.
Asset Limits $9,430 (individual), $14,130 (couple).
KS

Three tiers; no waitlist.

Benefits
Covers Part B premiums ($174.70/month) Deductibles ($240/year) Copays (~20%)

National Family Caregiver Support Program (NFCSP) Respite

Kansas NFCSP Respite Care

Age
General Caregivers of 60+ needing care or 55+ caregivers of others; Kansas resident; functional needs (2+ ADLs).
Income Limits (2025) Prioritizes ~$24,980/year (individual); no strict cap.
Asset Limits Not assessed; need-based.
KS

11 AAAs; prioritizes low-income, rural caregivers.

Benefits
Respite (4-6 hours/week or 5 days/year) Adult day care ($60/day) Caregiver training

VA Aid and Attendance (A&A) and Housebound Benefits

Kansas VA Aid and Attendance/Housebound

Age 65+ or disabled veteran/spouse
General Kansas resident, wartime service, need for ADL help (A&A) or homebound.
Income Limits (2025) Net income < ~$1,984/month (veteran with dependent, A&A); pension offsets income.
Asset Limits ~$155,356 net worth limit
KS

High veteran demand in rural/urban areas.

Benefits
Cash (~$1,433-$2,642/month veteran, ~$951-$1,318 spouse) for care costs (e.g., in-home, assisted living)

Places of interest near Lincoln Park Manor Inc

Address 0.0 miles from city center Info Estimated distance in miles from Lincoln's city center to Lincoln Park Manor Inc's address, calculated via Google Maps.

Calculate Travel Distance to Lincoln Park Manor Inc

Add your location

Address

Staffing Data

Reporting period: April 1 – June 30, 2025 (Q2 2025). Source: CMS Payroll-Based Journal report.

Total staff 104
Employees 52
Contractors 52
Staff to resident ratio 3.15:1
39% better than Kansas average
Kansas average ratio: 2.27:1 Kansas average ratio: 2.27:1See full Kansas ranking
Avg staff/day 23
Average shift 6.9 hours
10% worse than Kansas average
Kansas average: 7.7 hours Kansas average shift: 7.7 hoursSee full Kansas ranking
Total staff hours (quarter) 14,365

Nursing staff breakdown

Q2 2025 · Apr 1 – Jun 30 More info This data comes from the CMS Payroll-Based Journal report covering April 1 – June 30, 2025.
Registered Nurse

Manages medical care and health needs.

Total count 9
Average shift length Info Average shift length. Calculated as total hours divided by days worked and average staff per day. 5.6 hours

This role is partially covered by contractors.

Licensed Practical Nurse

Assists with medical care and medications.

Total count 9
Average shift length Info Average shift length. Calculated as total hours divided by days worked and average staff per day. 8.4 hours

This role is partially covered by contractors.

Certified Nursing Assistant

Helps with daily care and mobility.

Total count 57
Average shift length Info Average shift length. Calculated as total hours divided by days worked and average staff per day. 7.4 hours

This role is partially covered by contractors.

Contractor staffing

Q2 2025 · Apr 1 – Jun 30 More info This data comes from the CMS Payroll-Based Journal report covering April 1 – June 30, 2025.

Total hours from contractors

19.4%

2,793 contractor hours this quarter

Certified Nursing Assistant: 23 Medication Aide/Technician: 6 Registered Nurse: 6 Licensed Practical Nurse: 4 Speech Language Pathologist: 3 Nurse Practitioner: 1 Administrator: 1 Respiratory Therapy Technician: 1 Physical Therapy Aide: 1 Occupational Therapy Assistant: 1 Physical Therapy Assistant: 1 Occupational Therapy Aide: 1 Qualified Social Worker: 1 Mental Health Service Worker: 1 Medical Director: 1

Staff by category

Q2 2025 · Apr 1 – Jun 30 More info This data comes from the CMS Payroll-Based Journal report covering April 1 – June 30, 2025.
Certified Nursing Assistant3423577,76891100%7.4
Licensed Practical Nurse5492,30191100%8.4
Medication Aide/Technician56119828290%7
Registered Nurse3697788189%5.6
Dietitian1015296673%8
Dental Services Staff1015246673%7.9
Administrator0115126470%8
Nurse Practitioner0115126470%8
Other Dietary Services Staff3031544954%2.5
Speech Language Pathologist0331405662%2.2
Physical Therapy Aide011604044%1.5
Respiratory Therapy Technician011332730%1.2
Physical Therapy Assistant011282123%1.3
Occupational Therapy Aide0112567%4.1
Occupational Therapy Assistant011933%3
Qualified Social Worker011755%1.3
Mental Health Service Worker011333%1
Medical Director011222%0.9
57 Certified Nursing Assistant
% of Days 100%
9 Licensed Practical Nurse
% of Days 100%
11 Medication Aide/Technician
% of Days 90%
9 Registered Nurse
% of Days 89%
1 Dietitian
% of Days 73%
1 Dental Services Staff
% of Days 73%
1 Administrator
% of Days 70%
1 Nurse Practitioner
% of Days 70%
3 Other Dietary Services Staff
% of Days 54%
3 Speech Language Pathologist
% of Days 62%
1 Physical Therapy Aide
% of Days 44%
1 Respiratory Therapy Technician
% of Days 30%
1 Physical Therapy Assistant
% of Days 23%
1 Occupational Therapy Aide
% of Days 7%
1 Occupational Therapy Assistant
% of Days 3%
1 Qualified Social Worker
% of Days 5%
1 Mental Health Service Worker
% of Days 3%
1 Medical Director
% of Days 2%

Facility Characteristics

Source: CMS Long-Term Care Facility Characteristics (Data as of Jan 2026)

Total residents 33
Medicare
1
3% of residents
Medicaid
20
60.6% of residents
Private pay or other
12
36.4% of residents
Programs & Services
Residents Group

Residents meet regularly to discuss policies, care quality, and activities

Active Resident Council

Organized group of residents that meets regularly to discuss facility policies, quality of life, and activities.

Quality of care over time

These measures show how residents usually do over time at this home, based on health outcomes and preventive care.

High-risk clinical events score Info A composite score based on pressure ulcers, falls with injury, weight loss, walking ability decline, and activities of daily living decline. 9.9
6% better than Kansas average

Kansas average: 10.5

Functional decline score Info A composite score based on activities of daily living decline, walking ability decline, and incontinence. 25.6
23% worse than Kansas average

Kansas average: 20.7

Long-stay resident measures
Significantly below average Kansas avg: 3.0 Info CMS star rating based on long-stay quality measure performance. 5 stars = significantly above average, 1 star = significantly below average.
Need for Help with Daily Activities Increased Info Percent of long-stay residents whose need for help with daily activities has increased 26.0%
36% worse than Kansas average

Kansas average: 19.0%

Walking Ability Worsened Info Percent of long-stay residents whose ability to move independently worsened 10.5%
46% better than Kansas average

Kansas average: 19.4%

Low Risk Residents with Bowel/Bladder Incontinence Info Percent of low risk long-stay residents who lose control of their bowels or bladder 40.2%
69% worse than Kansas average

Kansas average: 23.8%

Falls with Major Injury Info Percent of long-stay residents experiencing one or more falls with major injury 6.0%
36% worse than Kansas average

Kansas average: 4.4%

High Risk Residents with Pressure Ulcers Info Percent of long-stay high risk residents with pressure ulcers 2.2%
52% better than Kansas average

Kansas average: 4.6%

Urinary Tract Infection Info Percent of long-stay residents with a urinary tract infection 4.6%
45% worse than Kansas average

Kansas average: 3.1%

Lost Too Much Weight Info Percent of long-stay residents who lose too much weight 4.7%
7% better than Kansas average

Kansas average: 5.1%

Depressive Symptoms Info Percent of long-stay residents who have depressive symptoms 4.2%
18% better than Kansas average

Kansas average: 5.2%

Antipsychotic Use Info Percent of long-stay residents who received an antipsychotic medication 25.2%
49% worse than Kansas average

Kansas average: 16.9%

Pneumococcal Vaccine Info Percent of long-stay residents assessed and appropriately given the pneumococcal vaccine 72.4%
21% worse than Kansas average

Kansas average: 91.9%

Influenza Vaccine Info Percent of long-stay residents assessed and appropriately given the seasonal influenza vaccine 86.1%
10% worse than Kansas average

Kansas average: 95.5%

Hospitalizations per 1,000 days Info Number of hospitalizations per 1,000 long-stay resident days. 2.22
21% worse than Kansas average

Kansas average: 1.84

ED visits per 1,000 days Info Number of outpatient emergency department visits per 1,000 long-stay resident days. 2.48
15% worse than Kansas average

Kansas average: 2.16

Short-stay resident measures
Pneumococcal Vaccine Info Percent of short-stay residents assessed and appropriately given the pneumococcal vaccine 42.9%
43% worse than Kansas average

Kansas average: 75.6%

Penalties and fines

Federal penalties imposed by CMS for regulatory violations, including civil money penalties (fines) and denials of payment for new Medicare/Medicaid admissions.

Source: CMS Penalties Database

No penalties in the past 3 years

No civil money penalties or payment denials were reported in the last 3 years.

Compare Nursing Home around Kansas

The information below is reported by the Kansas Department for Aging and Disability Services.

2 facilities compared · CMS & KS Dept. of Health data

Filter by care type
Lincoln Park Manor Inc
NH

Nursing Home Licensed facility providing 24/7 skilled nursing care for residents with complex, ongoing medical needs. Staffed by RNs, LPNs, and CNAs. Inspected and star-rated annually by CMS. Accepts Medicare (short-term rehab) and Medicaid (long-term care).

AL

Assisted Living A licensed, long-term care setting for seniors or individuals with disabilities who need help with daily activities — like bathing, dressing, and medication management — but not 24-hour skilled nursing. Offers housing, meals, and around-the-clock support while aiming to maximize resident independence.

Lincoln36 168.9% +112%4.89 -14%+5%$03712.3-34- 53 Lincoln Park Manor, Inc.$4.8M$2.5M53.3%175419
Brookdale Rosehill
NH

Nursing Home Licensed facility providing 24/7 skilled nursing care for residents with complex, ongoing medical needs. Staffed by RNs, LPNs, and CNAs. Inspected and star-rated annually by CMS. Accepts Medicare (short-term rehab) and Medicaid (long-term care).

AL

Assisted Living A licensed, long-term care setting for seniors or individuals with disabilities who need help with daily activities — like bathing, dressing, and medication management — but not 24-hour skilled nursing. Offers housing, meals, and around-the-clock support while aiming to maximize resident independence.

N

Nursing

Shawnee148 76.2% -4%4.27 +53%-8%$0358.8-69A+ 54 Mary Patchett$14.8M$7.5M50.7%175478

Guides for Better Senior Living

Care Cost Calculator: See Prices in Your Area

Nursing Home Data Explorer

Don’t Wait Too Long: 7 Red Flag Signs Your Parent Needs Assisted Living Now

The True Cost of Assisted Living in 2025 – And How Families Are Paying For It

Understanding Senior Living Costs: Pricing Models, Discounts & Financial Assistance

Frequently Asked Questions about Lincoln Park Manor Inc

What neighborhood is Lincoln Park Manor Inc in?

Lincoln Park Manor Inc is in the USA neighborhood of LINCOLN.

Who is the owner of Lincoln Park Manor Inc?

The legal owner and operator of Lincoln Park Manor Inc is Lincoln County.

Is Lincoln Park Manor Inc in a walkable area?

Lincoln Park Manor Inc has a walk score of 53. Moderately walkable. Some errands can be accomplished on foot, with a mix of nearby amenities.

What is the license number of Lincoln Park Manor Inc?

According to KS state health department records, Lincoln Park Manor Inc's license number is 175419.

What is the occupancy rate at Lincoln Park Manor Inc?

Lincoln Park Manor Inc's occupancy is 81%.

Who is the administrator of Lincoln Park Manor Inc?

Diane Walters is the administrator of Lincoln Park Manor Inc.

How many beds does Lincoln Park Manor Inc have?

Lincoln Park Manor Inc has 36 beds.

Explore Open Rooms
1 Contact details
2 What type of senior care service are you looking for?
3 What budget do you have in mind for senior care?
4 How soon do you need to find care?
5 Additional details

Thank you for your interest!

Our team will be in touch shortly to help with next steps.