Total health inspections
3
Kansas average 4.5
Last Health inspection on Oct 2024
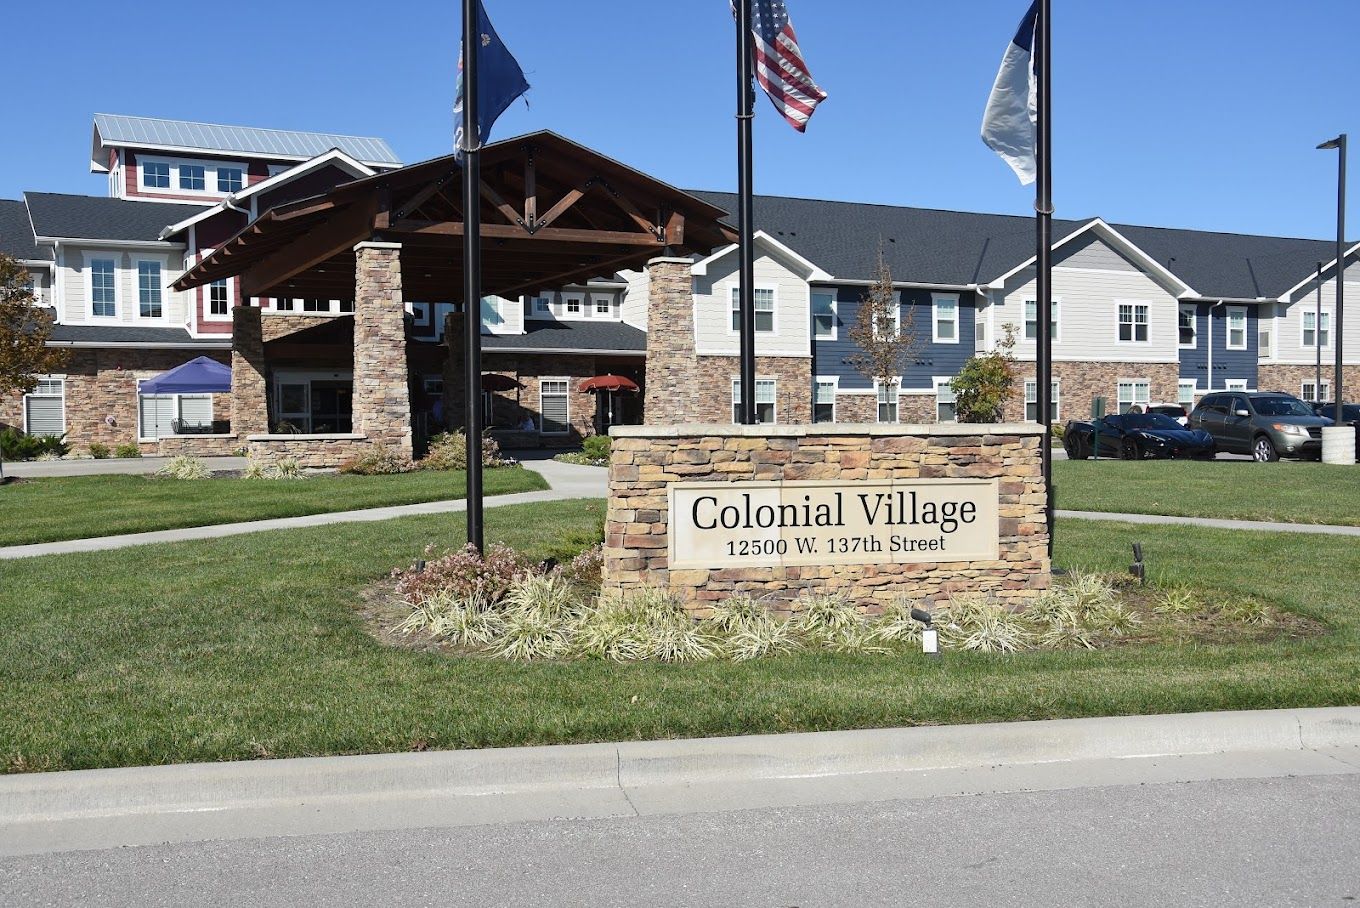
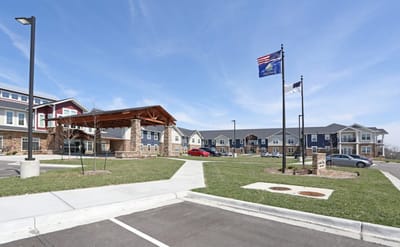
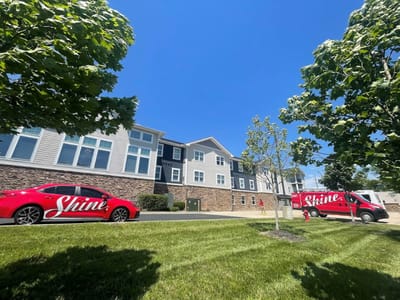
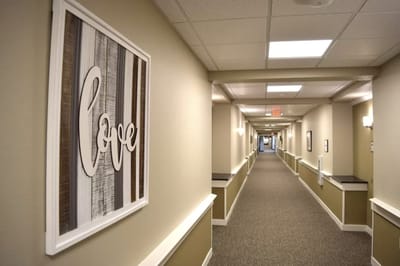
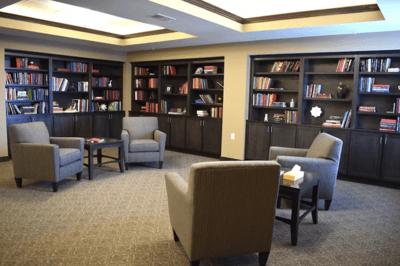
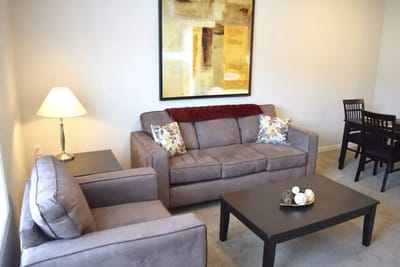
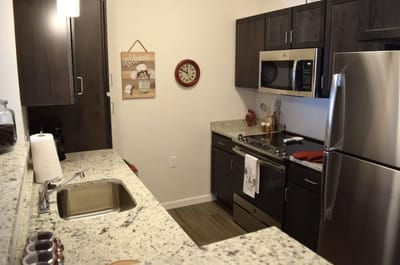
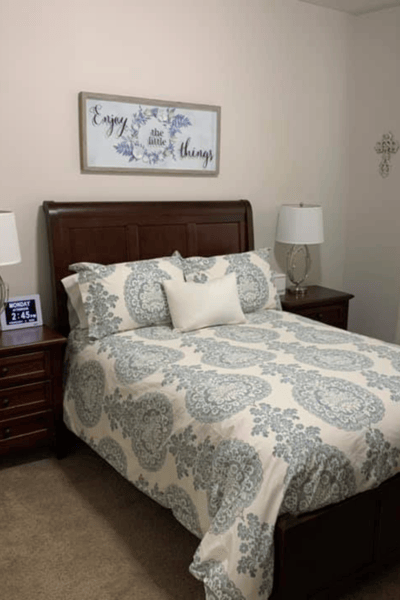
Situated in the beautiful neighborhood of Overland Park, KS, Colonial Village Overland Park is an esteemed senior living community offering assisted living, independent living, long-term care, and short-term rehabilitation. Beautifully appointed and spacious accommodations with several floor plans are available for its residents. In terms of rehabilitation, they provide a calm relaxing environment, physical, occupational, and speech therapy every day, and advanced registered nurse practitioners to ensure the well-being of their residents.
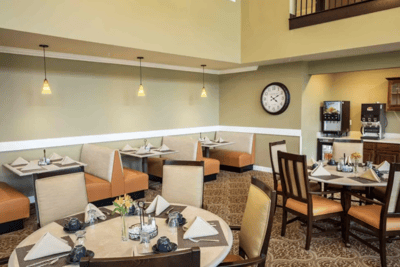
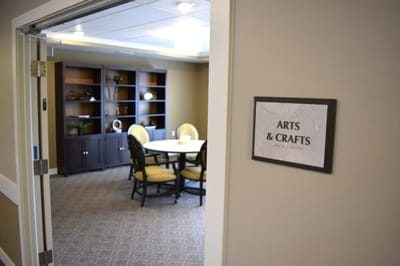
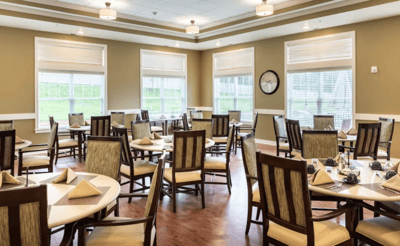
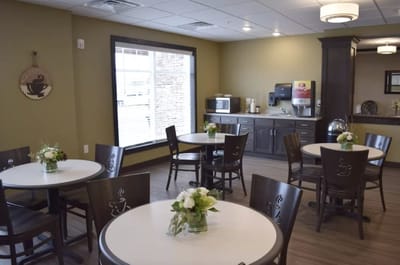
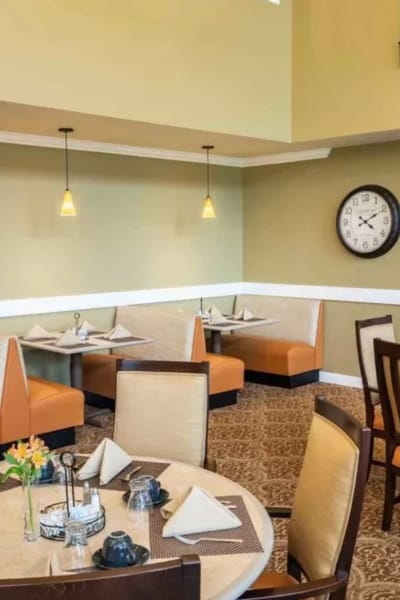
With its top-of-the-line amenities and services, residents can enjoy the following: restaurant-style dining, spa room, medication administration, emergency call system, cable television, free wi-fi, chaplain services, laundry and housekeeping, and transportation. Engage in planned daily activities including church services, movie nights, book clubs, museum outings, seasonal outings, and more. Meet new companions and create unforgettable memories within the amazing, shared spaces of this community. Equipped with the right tools and people, seniors are guaranteed an all-encompassing living experience with Colonial Village Overland Park.
| Staff type | Hours / Day / Resident | vs state avg |
|---|---|---|
|
Registered Nurse (RN)
| 47m per day | ▲ 11% State avg: 42m per day · National avg: 41m per day |
|
LPN / LVN
| 45m per day | ▲ 13% State avg: 40m per day · National avg: 52m per day |
|
Nurse Aide
| 2h 46m per day | ▲ 3% State avg: 2h 41m per day · National avg: 2h 20m per day |
|
Weekend Total Nursing
| 3h 56m per day | ▲ 8% State avg: 3h 38m per day · National avg: 3h 27m per day |
|
Physical Therapist
| 3m per day | ▲ 35% State avg: 2m per day · National avg: 4m per day |
|
Weekend RN
| 33m per day | ▲ 14% State avg: 29m per day · National avg: 29m per day |
Colonial Village Overland Park is legally operated by Colonial Village, and administered by Daniel Chik.
In Kansas, the Department for Aging and Disability Services, Survey and Certification Commission performs the unannounced inspections required for facility licensing and federal certification.
Inspections
| This Facility | KS Average | vs. KS Avg |
|---|---|---|---|
|
Total inspections
| 16 | 25 | This facility has had 36% fewer total inspections than the Kansas average (16 vs. KS avg 25). More inspections can mean more regulatory scrutiny rather than worse care.↓ 36% fewer |
Kansas average 4.5
Last Health inspection on Oct 2024
Kansas average 26.9
Kansas average 6.07
Health citations are formal notices following inspections when they fail to comply with safety and care standards.
14 of 28 citations resulted from standard inspections; and 14 of 28 came from combined inspections (standard and complaint).
Kansas average: 0.9
Kansas average: 0.9
Reporting period: October 1 – December 31, 2025 (Q4 2025). Source: CMS Payroll-Based Journal report.
Manages medical care and health needs.
Assists with medical care and medications.
Helps with daily care and mobility.
Total hours from contractors
3,877 contractor hours this quarter
| Certified Nursing Assistant | 21 | 54 | 75 | 8,354 | 92 | 100% | 8.3 |
| Licensed Practical Nurse | 6 | 6 | 12 | 2,023 | 91 | 99% | 9.6 |
| Registered Nurse | 7 | 3 | 10 | 1,551 | 89 | 97% | 8.1 |
| Medication Aide/Technician | 7 | 20 | 27 | 1,004 | 79 | 86% | 7.9 |
| Clinical Nurse Specialist | 2 | 0 | 2 | 626 | 66 | 72% | 7.9 |
| Other Dietary Services Staff | 3 | 0 | 3 | 560 | 71 | 77% | 7.4 |
| RN Director of Nursing | 2 | 0 | 2 | 504 | 67 | 73% | 7.3 |
| Dietitian | 1 | 0 | 1 | 496 | 62 | 67% | 8 |
| Nurse Practitioner | 1 | 0 | 1 | 476 | 58 | 63% | 8.2 |
| Administrator | 1 | 0 | 1 | 432 | 57 | 62% | 7.6 |
| Physical Therapy Assistant | 0 | 3 | 3 | 347 | 70 | 76% | 4.8 |
| Speech Language Pathologist | 0 | 3 | 3 | 296 | 74 | 80% | 4 |
| Respiratory Therapy Technician | 0 | 4 | 4 | 189 | 64 | 70% | 2.8 |
| Mental Health Service Worker | 1 | 0 | 1 | 184 | 23 | 25% | 8 |
| Qualified Social Worker | 0 | 4 | 4 | 143 | 49 | 53% | 2.4 |
| Occupational Therapy Aide | 0 | 1 | 1 | 99 | 14 | 15% | 7 |
| Occupational Therapy Assistant | 0 | 2 | 2 | 49 | 15 | 16% | 3 |
| Physical Therapy Aide | 0 | 1 | 1 | 8 | 5 | 5% | 1.6 |
| Medical Director | 0 | 1 | 1 | 5 | 3 | 3% | 1.7 |
Federal penalties imposed by CMS for regulatory violations, including civil money penalties (fines) and denials of payment for new Medicare/Medicaid admissions.
Source: CMS Penalties Database (Data as of Jan 2026)
Kansas average: $44K
Kansas average: 2.4
Kansas average: 0.3
No penalties in the past 3 years
No civil money penalties or payment denials were reported in the last 3 years.
These measures show how residents usually do over time at this home, based on health outcomes and preventive care.
Kansas average: 10.5
Kansas average: 20.7
Kansas average: 19.0%
Kansas average: 19.4%
Kansas average: 23.8%
Kansas average: 4.4%
Kansas average: 4.6%
Kansas average: 3.1%
Kansas average: 5.1%
Kansas average: 5.2%
Kansas average: 16.9%
Kansas average: 91.9%
Kansas average: 95.5%
Kansas average: 75.6%
Kansas average: 2.2%
Kansas average: 73.5%
Quality measures are calculated from Minimum Data Set (MDS) assessments. For most measures, lower percentages indicate better care quality.
51% of new residents, usually for short-term rehab.
46% of new residents, often for short stays.
2% of new residents, often for long-term daily care.
Source: CMS Long-Term Care Facility Characteristics (Data as of Jan 2026)
Residents meet regularly to discuss policies, care quality, and activities
Part of a Continuing Care Retirement Community offering multiple care levels
Organized group of residents that meets regularly to discuss facility policies, quality of life, and activities.
Data sourced from CMS Long-Term Care Facility Characteristics quarterly report. Payer mix reflects the current resident census by primary payment source.
Historical financial and operational data for Colonial Village Overland Park from 2020–2023, based on CMS SNF Cost Reports.
Key figures below are for fiscal year ending in 12/2023.
Based on CMS SNF Cost Report for fiscal year ending in 12/2023.
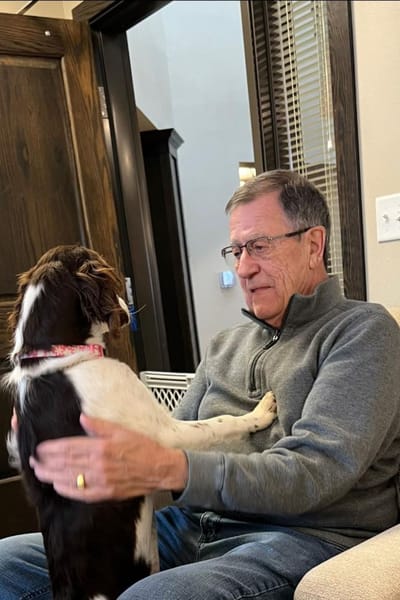
Pets Allowed
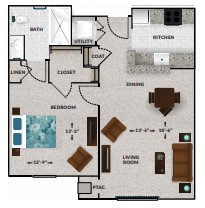
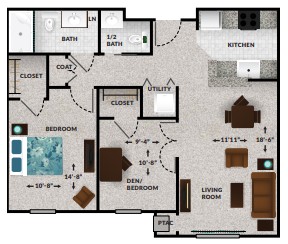
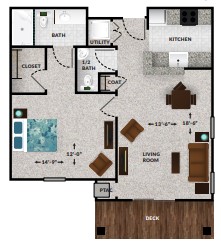
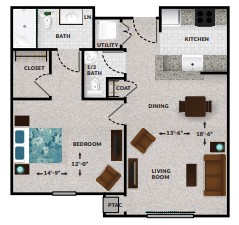
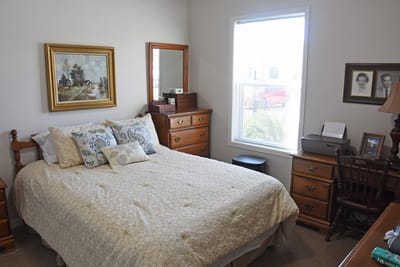
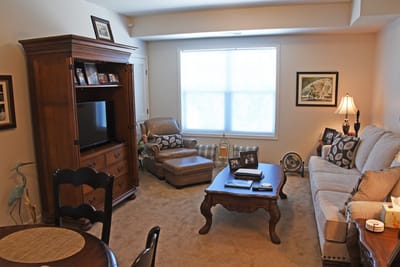
Room Sizes: 384–399 / 409–433 / 553 / 714 / 764 / 808 / 871 / 943 / 957 / 1016 / 1081 / 1147 / 1181 / 1228 sq. ft
Housing Options: 1 Bed / 2 Bed
Building Type: Two-story
Transportation Services
Most residents typically stay for a few weeks or months before returning home or moving on.
Most new residents arrive under Medicare (51% of admissions), and a typical Medicare stay runs around 1 - 2 months.
Coverage residents most often arrive under.
Coverage residents most often leave under.
![]() 7.6 miles from city center
7.6 miles from city center
![]() Estimated distance in miles from Overland Park's city center to Colonial Village Overland Park's address, calculated via Google Maps.
Estimated distance in miles from Overland Park's city center to Colonial Village Overland Park's address, calculated via Google Maps.
Add your location
Info below is compiled from CMS reports & the KS Dept. for Aging & Disability Services (KDADS), senior community websites & trusted data sources such as Walk Score & BBB.
Communities are listed from highest to lowest based on our ranking methodology.
| Brookdale Overland Park | NH AL MC SNF | Overland Park | 94
Facility
94
KS AVG
69
Rank
#44 / 223 |
79.3%
Facility
79.3%
KS AVG
76.8
Rank
#117 / 206 | +3% | 4.53
Facility
4.53
KS AVG
4.63
Rank
#72 / 141 | +65% | -2% | $7.4k
Facility
$7.4k
KS AVG
$49.2k
Rank
#62 / 144 | 20
Facility
20
KS AVG
26.9
Rank
#53 / 144 | 6.7
Facility
6.7
KS AVG
6.1
Rank
#98 / 144 | 1 | 75 | - |
44
Facility
44
KS AVG
46
Rank
#207 / 363 | Kimberly Ellis | $22.0MFiscal year ending 12/2023
Facility
$22.0MFiscal year ending 12/2023
KS AVG
$7.3M
Rank
#15 / 143 | $10.9MFiscal year ending 12/2023
Facility
$10.9MFiscal year ending 12/2023
KS AVG
$3.3M
Rank
#12 / 143 | 49.6%Fiscal year ending 12/2023
Facility
49.6%Fiscal year ending 12/2023
KS AVG
47.9%
Rank
#33 / 143 | 175517 | ||||
| Ahc of Overland Park LLC | NH SNF | Overland Park (South Lakes) | 38
Facility
38
KS AVG
69
Rank
#203 / 223 |
100.0%
Facility
100.0%
KS AVG
76.8
Rank
#1 / 206 | +30% | 5.02
Facility
5.02
KS AVG
4.63
Rank
#44 / 141 | +13% | +8% | $13.4k
Facility
$13.4k
KS AVG
$49.2k
Rank
#77 / 144 | 22
Facility
22
KS AVG
26.9
Rank
#61 / 144 | 4.4
Facility
4.4
KS AVG
6.1
Rank
#36 / 144 | 2 | 38 | - |
92
Facility
92
KS AVG
46
Rank
#1 / 363 | Paul Hura | $6.4MFiscal year ending 12/2023
Facility
$6.4MFiscal year ending 12/2023
KS AVG
$7.3M
Rank
#55 / 143 | $4.3MFiscal year ending 12/2023
Facility
$4.3MFiscal year ending 12/2023
KS AVG
$3.3M
Rank
#59 / 143 | 66.6%Fiscal year ending 12/2023
Facility
66.6%Fiscal year ending 12/2023
KS AVG
47.9%
Rank
#113 / 143 | 175542 | ||||
| Village Shalom Inc | NH AL IL MC RC SNF | Overland Park (6850) | 66
Facility
66
KS AVG
69
Rank
#87 / 223 |
98.5%
Facility
98.5%
KS AVG
76.8
Rank
#7 / 206 | +28% | 6.86
Facility
6.86
KS AVG
4.63
Rank
#4 / 141 | -48% | +48% | $16.2k
Facility
$16.2k
KS AVG
$49.2k
Rank
#91 / 144 | 32
Facility
32
KS AVG
26.9
Rank
#99 / 144 | 8.0
Facility
8.0
KS AVG
6.1
Rank
#115 / 144 | 2 | 65 | - |
22
Facility
22
KS AVG
46
Rank
#299 / 363 | Michael Abrams | $22.7MFiscal year ending 12/2023
Facility
$22.7MFiscal year ending 12/2023
KS AVG
$7.3M
Rank
#7 / 143 | $10.7MFiscal year ending 12/2023
Facility
$10.7MFiscal year ending 12/2023
KS AVG
$3.3M
Rank
#8 / 143 | 47%Fiscal year ending 12/2023
Facility
47%Fiscal year ending 12/2023
KS AVG
47.9%
Rank
#113 / 143 | 175441 | ||||
| Stratford Commons Rehabilitation & Health Care | NH HOS RC SNF | Overland Park (Stratford Place) | 60
Facility
60
KS AVG
69
Rank
#94 / 223 |
88.3%
Facility
88.3%
KS AVG
76.8
Rank
#57 / 206 | +15% | 3.79
Facility
3.79
KS AVG
4.63
Rank
#109 / 141 | 0% | -18% | $24.8k
Facility
$24.8k
KS AVG
$49.2k
Rank
#106 / 144 | 44
Facility
44
KS AVG
26.9
Rank
#120 / 144 | 14.7
Facility
14.7
KS AVG
6.1
Rank
#143 / 144 | - | 53 | - |
47
Facility
47
KS AVG
46
Rank
#186 / 363 | Joseph Charles Tutera 2013 Family Irrevociable Trust Agreement | $7.0MFiscal year ending 12/2023
Facility
$7.0MFiscal year ending 12/2023
KS AVG
$7.3M
Rank
#54 / 143 | $3.7MFiscal year ending 12/2023
Facility
$3.7MFiscal year ending 12/2023
KS AVG
$3.3M
Rank
#51 / 143 | 53%Fiscal year ending 12/2023
Facility
53%Fiscal year ending 12/2023
KS AVG
47.9%
Rank
#87 / 143 | 175549 | ||||
| Colonial Village Overland Park | NH AL IL MC SNF | Overland Park | 82
Facility
82
KS AVG
69
Rank
#56 / 223 | - | - | 4.73
Facility
4.73
KS AVG
4.63
Rank
#58 / 141 | -36% | +2% | $0
Facility
$0
KS AVG
$49.2k
Rank
#1 / 144 | 28
Facility
28
KS AVG
26.9
Rank
#87 / 144 | 9.3
Facility
9.3
KS AVG
6.1
Rank
#130 / 144 | 1 | 37 | - |
45
Facility
45
KS AVG
46
Rank
#199 / 363 | Dan Chik | $10.0MFiscal year ending 12/2023
Facility
$10.0MFiscal year ending 12/2023
KS AVG
$7.3M
Rank
#44 / 143 | $3.5MFiscal year ending 12/2023
Facility
$3.5MFiscal year ending 12/2023
KS AVG
$3.3M
Rank
#55 / 143 | 35.3%Fiscal year ending 12/2023
Facility
35.3%Fiscal year ending 12/2023
KS AVG
47.9%
Rank
#125 / 143 | 175560 |
Colonial Village Overland Park is located in Overland Park, Kansas.
Here are the financial assistance programs available to residents in Kansas.
Colonial Village Overland Park is legally operated by Colonial Village, and administered by Daniel Chik.
Colonial Village Overland Park has a walk score of 45. Somewhat walkable. A few nearby services may be reachable on foot, but most trips require transportation.
According to KS state health department records, Colonial Village Overland Park's license number is 175560.
Colonial Village Overland Park's occupancy is 84.1%.
Yes — see the floorplan options available at Colonial Village Overland Park on this page.
Yes, Colonial Village Overland Park allows residents to bring their pets.
Colonial Village Overland Park is registered as a for-profit in KS.
Care Cost Calculator: See Prices in Your Area
Nursing Home Data Explorer
Don’t Wait Too Long: 7 Red Flag Signs Your Parent Needs Assisted Living Now
The True Cost of Assisted Living in 2025 – And How Families Are Paying For It
Understanding Senior Living Costs: Pricing Models, Discounts & Financial Assistance