


Total health inspections
9
Colorado average 4.8
Last Health inspection on Sep 2025
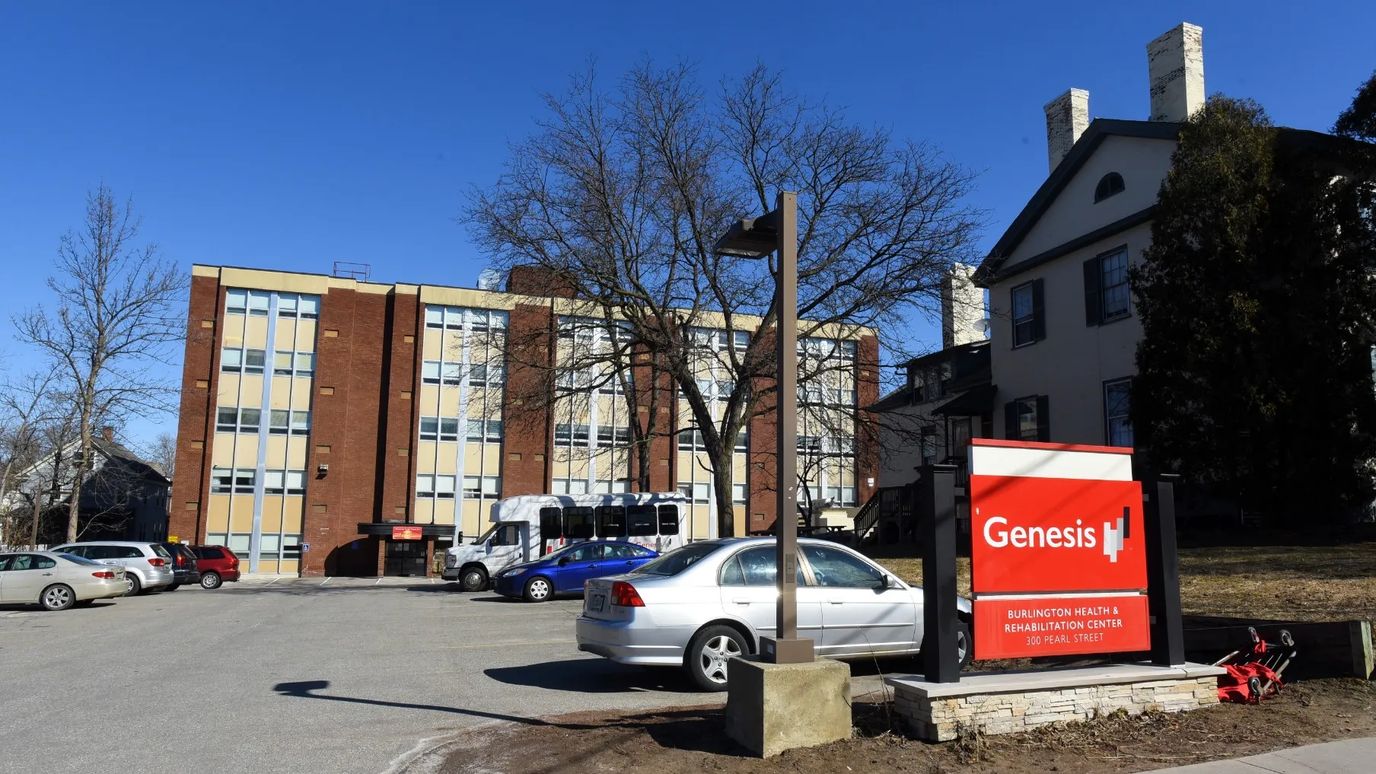
Pearl Street Health and Rehabilitation Center is located at 3636 S. Pearl St. in Englewood, Colorado, just a quarter-mile from the HCA HealthONE Swedish hospital. That proximity is a practical detail for a facility that provides hospice and palliative care. The neighborhood is highly walkable (Walk Score of 80), which makes it easy for families to run errands on foot.
The facility has been operating for 23 years with 81 beds. It currently houses 69 residents, putting the occupancy rate at 69.4%. With an average stay of 500 days, this is clearly a space for long-term residents rather than short-term rehab. They accept Medicare, Medicaid, and private pay.
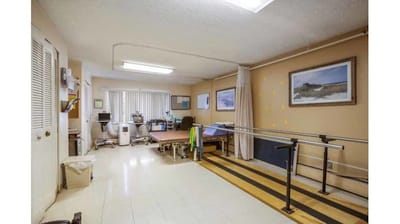
Clinically, they offer a wide range of services, including physical, occupational, and speech therapy, plus orthopedic care. They also cover discharge planning, pain management, and colostomy care. For families needing support, they provide palliative and hospice care, as well as respite stays for temporary placement. Daily nursing care totals about 4 hours and 2 minutes per resident, split between 27 minutes of RN time, 27 minutes of LPN/LVN time, and 1 hour and 52 minutes of nurse aide support.
When it comes to state inspections, the focus has been on medication safety, infection control, preventing falls, and maintaining solid care documentation. It’s also worth noting that they have both a Resident Council and a Family Council, which gives families and residents a structured way to give input on policy and quality of care.
| Staff type | Hours / Day / Resident | vs state avg |
|---|---|---|
|
Registered Nurse (RN)
| 27m per day | ▼ 46% State avg: 50m per day · National avg: 41m per day |
|
LPN / LVN
| 1h 1m per day | ▲ 50% State avg: 41m per day · National avg: 52m per day |
|
Nurse Aide
| 1h 52m per day | ▼ 16% State avg: 2h 13m per day · National avg: 2h 21m per day |
|
Weekend Total Nursing
| 2h 55m per day | ▼ 11% State avg: 3h 17m per day · National avg: 3h 26m per day |
|
Physical Therapist
| 5m per day | ▼ 8% State avg: 5m per day · National avg: 4m per day |
|
Weekend RN
| 19m per day | ▼ 47% State avg: 36m per day · National avg: 29m per day |
Key information about the people who lead and staff this community.
In Colorado, the Department of Public Health and Environment, Health Facilities Division is the regulatory body that performs unannounced surveys and publishes facility inspection findings.
Deficiencies
| This Facility | CO Average | vs. CO Avg |
|---|---|---|---|
|
Total deficiencies
| 99 | 40 | This facility has 148% more total deficiencies than a typical Colorado nursing home (99 vs. CO avg 40).↑ 148% worse |
Colorado average 4.8
Last Health inspection on Sep 2025
Colorado average 24.8
Colorado average 5.2
Health citations are formal notices following inspections when they fail to comply with safety and care standards.
17 of 38 citations resulted from standard inspections; 17 of 38 resulted from complaint investigations; and 4 of 38 came from combined inspections (standard and complaint).
Colorado average: 0.4
Colorado average: 2.1
Reporting period: October 1 – December 31, 2025 (Q4 2025). Source: CMS Payroll-Based Journal report.
Manages medical care and health needs.
Assists with medical care and medications.
Helps with daily care and mobility.
Total hours from contractors
829 contractor hours this quarter
| Certified Nursing Assistant | 29 | 11 | 40 | 11,587 | 92 | 100% | 9.1 |
| Licensed Practical Nurse | 18 | 4 | 22 | 6,050 | 92 | 100% | 9.9 |
| Registered Nurse | 8 | 0 | 8 | 2,084 | 92 | 100% | 10.2 |
| Other Dietary Services Staff | 2 | 0 | 2 | 559 | 69 | 75% | 7.2 |
| Nurse Practitioner | 2 | 0 | 2 | 532 | 64 | 70% | 7.7 |
| Mental Health Service Worker | 1 | 0 | 1 | 498 | 63 | 68% | 7.9 |
| Administrator | 1 | 0 | 1 | 496 | 62 | 67% | 8 |
| Respiratory Therapy Technician | 1 | 0 | 1 | 477 | 61 | 66% | 7.8 |
| Dental Services Staff | 1 | 0 | 1 | 474 | 61 | 66% | 7.8 |
| Speech Language Pathologist | 2 | 0 | 2 | 420 | 58 | 63% | 7.1 |
| RN Director of Nursing | 3 | 0 | 3 | 320 | 37 | 40% | 7.8 |
| Clinical Nurse Specialist | 4 | 0 | 4 | 184 | 21 | 23% | 8 |
| Qualified Social Worker | 1 | 0 | 1 | 175 | 48 | 52% | 3.6 |
| Other Physician | 0 | 2 | 2 | 174 | 17 | 18% | 6.7 |
| Medication Aide/Technician | 1 | 0 | 1 | 12 | 2 | 2% | 6 |
| Medical Director | 0 | 2 | 2 | 10 | 9 | 10% | 1.1 |
| Physical Therapy Aide | 1 | 0 | 1 | 10 | 2 | 2% | 5 |
Federal penalties imposed by CMS for regulatory violations, including civil money penalties (fines) and denials of payment for new Medicare/Medicaid admissions.
Source: CMS Penalties Database
No penalties in the past 3 years
No civil money penalties or payment denials were reported in the last 3 years.
These measures show how residents usually do over time at this home, based on health outcomes and preventive care.
Colorado average: 9.0
Colorado average: 18.8
Colorado average: 16.0%
Colorado average: 17.0%
Colorado average: 23.2%
Colorado average: 3.3%
Colorado average: 3.9%
Colorado average: 1.4%
Colorado average: 5.2%
Colorado average: 7.2%
Colorado average: 18.8%
Colorado average: 93.3%
Colorado average: 94.7%
Colorado average: 76.6%
Colorado average: 1.4%
Colorado average: 75.6%
Quality measures are calculated from Minimum Data Set (MDS) assessments. For most measures, lower percentages indicate better care quality.
11% of new residents, usually for short-term rehab.
41% of new residents, often for short stays.
48% of new residents, often for long-term daily care.
Source: CMS Long-Term Care Facility Characteristics (Data as of Jan 2026)
Residents meet regularly to discuss policies, care quality, and activities
Family members meet regularly to discuss policies, care quality, and activities
Organized group of family members that meets regularly to discuss facility policies, resident care, and activities.
Organized group of residents that meets regularly to discuss facility policies, quality of life, and activities.
Data sourced from CMS Long-Term Care Facility Characteristics quarterly report. Payer mix reflects the current resident census by primary payment source.
Historical financial and operational data for Pearl Street Health and Rehabilitation Center from 2012–2023, based on CMS SNF Cost Reports.
Key figures below are for fiscal year ending in 12/2023.
Based on CMS SNF Cost Report for fiscal year ending in 12/2023.
Most residents stay for extended periods and receive ongoing daily care.
New residents most often arrive under Medicaid (48% of admissions), and a typical Medicaid stay runs around 2 - 3 years.
Coverage residents most often arrive under.
Coverage residents most often leave under.
![]() 0.4 miles from city center
0.4 miles from city center
![]() Estimated distance in miles from Englewood's city center to Pearl Street Health and Rehabilitation Center's address, calculated via Google Maps.
— 0.24 miles to nearest hospital (HCA HealthONE Swedish)
Estimated distance in miles from Englewood's city center to Pearl Street Health and Rehabilitation Center's address, calculated via Google Maps.
— 0.24 miles to nearest hospital (HCA HealthONE Swedish)
Add your location
Info below is compiled from CMS reports & the CO Dept. of Public Health & Environment (CDPHE), senior community websites & trusted data sources such as Walk Score & BBB.
Communities are listed from highest to lowest based on our ranking methodology.
| Littleton Care and Rehabilitation Center | NH MC SNF | Littleton | 35
Facility
35
CO AVG
76
Rank
#395 / 526 |
91.7%
Facility
91.7%
CO AVG
70.5
Rank
#26 / 147 | +30% | 3.66
Facility
3.66
CO AVG
3.86
Rank
#89 / 203 | +41% | -5% | $7.8k
Facility
$7.8k
CO AVG
$39.2k
Rank
#92 / 209 | 12
Facility
12
CO AVG
24.8
Rank
#25 / 204 | 2.4
Facility
2.4
CO AVG
5.2
Rank
#17 / 204 | 1 | 32 | A+ |
69
Facility
69
CO AVG
51
Rank
#243 / 869 | - | $5.5MFiscal year ending 12/2023
Facility
$5.5MFiscal year ending 12/2023
CO AVG
$11.2M
Rank
#193 / 207 | $3.3MFiscal year ending 12/2023
Facility
$3.3MFiscal year ending 12/2023
CO AVG
$4.9M
Rank
#188 / 207 | 59.7%Fiscal year ending 12/2023
Facility
59.7%Fiscal year ending 12/2023
CO AVG
46.6%
Rank
#74 / 207 | 65320 | ||||
| Cherrelyn Healthcare Center | NH SNF | Littleton | 190
Facility
190
CO AVG
76
Rank
#12 / 526 |
88.4%
Facility
88.4%
CO AVG
70.5
Rank
#37 / 147 | +25% | 2.69
Facility
2.69
CO AVG
3.86
Rank
#189 / 203 | -13% | -30% | $0
Facility
$0
CO AVG
$39.2k
Rank
#1 / 209 | 37
Facility
37
CO AVG
24.8
Rank
#165 / 204 | 9.3
Facility
9.3
CO AVG
5.2
Rank
#194 / 204 | 7 | 168 | A+ |
78
Facility
78
CO AVG
51
Rank
#132 / 869 | Stellar Cherrelyn Management LLC | $20.1MFiscal year ending 12/2023
Facility
$20.1MFiscal year ending 12/2023
CO AVG
$11.2M
Rank
#19 / 207 | $13.0MFiscal year ending 12/2023
Facility
$13.0MFiscal year ending 12/2023
CO AVG
$4.9M
Rank
#5 / 207 | 64.8%Fiscal year ending 12/2023
Facility
64.8%Fiscal year ending 12/2023
CO AVG
46.6%
Rank
#74 / 207 | 65203 | ||||
| Life Care Center of Littleton | NH SNF | Littleton | 120
Facility
120
CO AVG
76
Rank
#77 / 526 |
85.2%
Facility
85.2%
CO AVG
70.5
Rank
#48 / 147 | +21% | 4.35
Facility
4.35
CO AVG
3.86
Rank
#33 / 203 | +29% | +13% | $0
Facility
$0
CO AVG
$39.2k
Rank
#1 / 209 | 26
Facility
26
CO AVG
24.8
Rank
#123 / 204 | 8.7
Facility
8.7
CO AVG
5.2
Rank
#187 / 204 | 1 | 102 | A+ |
54
Facility
54
CO AVG
51
Rank
#429 / 869 | Sara Dent | $15.1MFiscal year ending 05/2024
Facility
$15.1MFiscal year ending 05/2024
CO AVG
$11.2M
Rank
#34 / 207 | $8.9MFiscal year ending 05/2024
Facility
$8.9MFiscal year ending 05/2024
CO AVG
$4.9M
Rank
#23 / 207 | 58.7%Fiscal year ending 05/2024
Facility
58.7%Fiscal year ending 05/2024
CO AVG
46.6%
Rank
#106 / 207 | 65370 | ||||
| Pearl Street Health and Rehabilitation Center | NH RC SNF | Englewood | 81
Facility
81
CO AVG
76
Rank
#231 / 526 |
83.6%
Facility
83.6%
CO AVG
70.5
Rank
#53 / 147 | +19% | 4.04
Facility
4.04
CO AVG
3.86
Rank
#63 / 203 | -40% | +5% | $0
Facility
$0
CO AVG
$39.2k
Rank
#1 / 209 | 38
Facility
38
CO AVG
24.8
Rank
#171 / 204 | 4.2
Facility
4.2
CO AVG
5.2
Rank
#67 / 204 | - | 68 | A+ |
80
Facility
80
CO AVG
51
Rank
#107 / 869 | - | $6.5MFiscal year ending 12/2023
Facility
$6.5MFiscal year ending 12/2023
CO AVG
$11.2M
Rank
#147 / 207 | $2.7MFiscal year ending 12/2023
Facility
$2.7MFiscal year ending 12/2023
CO AVG
$4.9M
Rank
#178 / 207 | 41.5%Fiscal year ending 12/2023
Facility
41.5%Fiscal year ending 12/2023
CO AVG
46.6%
Rank
#178 / 207 | 65208 |
Pearl Street Health and Rehabilitation Center is located in Englewood, Colorado.
Here are the financial assistance programs available to residents in Colorado.
Pearl Street Health and Rehabilitation Center has a walk score of 80. Very walkable. Most errands can be accomplished on foot, and many essentials are within a short walk.
Pearl Street Health and Rehabilitation Center's occupancy is 69.4%.
Pearl Street Health and Rehabilitation Center has been operating for approximately 24 years, based on available licensing and registration records.
No, Pearl Street Health and Rehabilitation Center has a no-pet policy.
Pearl Street Health and Rehabilitation Center is registered as a for-profit in CO.
Yes — there are 4 photos of Pearl Street Health and Rehabilitation Center in the photo gallery on this page.
Pearl Street Health and Rehabilitation Center is located at 3636 S Pearl St, Englewood, CO 80113.
Care Cost Calculator: See Prices in Your Area
Nursing Home Data Explorer
Don’t Wait Too Long: 7 Red Flag Signs Your Parent Needs Assisted Living Now
The True Cost of Assisted Living in 2025 – And How Families Are Paying For It
Understanding Senior Living Costs: Pricing Models, Discounts & Financial Assistance


