


Occupancy rate
100%
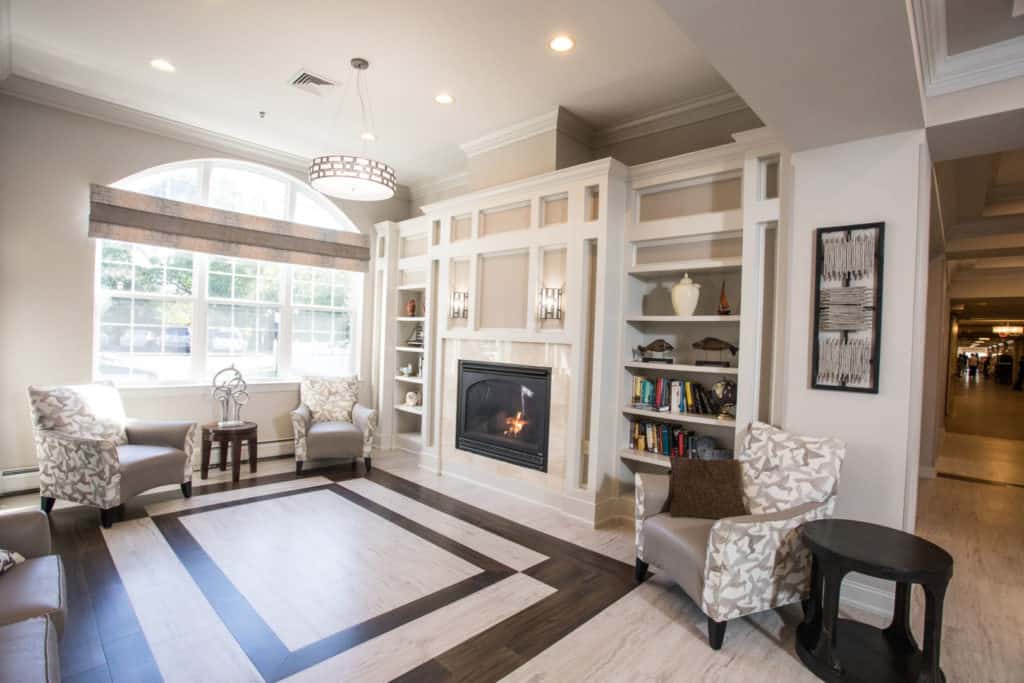
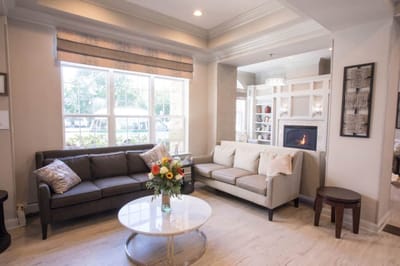


Built for residents seeking post-acute rehabilitation or longer-term nursing care, Careone at Wall is an SNF on Highway 138 in Wall, New Jersey. Medicare, Medicaid, and private pay are accepted to give flexible payment routes for families. With 138 beds at full capacity, the community runs at sustained high occupancy and serves a mix of short-term rehabilitation and ongoing care patients who stay 39 days on average.
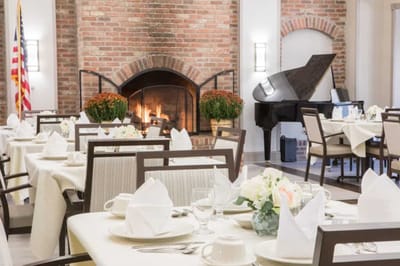
The home upholds a strong rehabilitation focus. It has specialized programs for cardiac care management, orthopedic recovery, stroke rehabilitation, and pulmonary care, alongside services for complex medical conditions, IV therapy, and wound management. This breadth of rehabilitation offerings makes the facility a pragmatic choice for those recuperating from surgery, hospitalization, or a cardiac or neurological event. Daily nursing support averages 3 hours 23 minutes per resident, with registered nurses providing direct care for about 53 minutes daily. The community is found in a car-dependent area where most errands and services require vehicular access, though occupants and visiting families will find the surrounding Wall location convenient for highway connectivity and access to local healthcare providers. Daily life includes restaurant-style dining with gourmet meals, along with spaces for family visits, outdoor gardens, a courtyard, and regular recreation and activity programming. For families managing short-term placement needs, the home provides respite care.
Inspection reviews have highlighted recurring themes: documentation accuracy, care planning completeness, medication management, staffing levels, infection control, and facility maintenance standards. These are themes families may want to discuss when touring to learn how Careone at Wall maintains daily operations and resident safety.
| Staff type | Hours / Day / Resident | vs state avg |
|---|---|---|
|
Registered Nurse (RN)
| 53m per day | ▲ 29% State avg: 41m per day · National avg: 41m per day |
|
LPN / LVN
| 1h 6m per day | ▲ 18% State avg: 56m per day · National avg: 52m per day |
|
Nurse Aide
| 1h 55m per day | ▼ 14% State avg: 2h 14m per day · National avg: 2h 20m per day |
|
Weekend Total Nursing
| 3h 22m per day | ■ Avg State avg: 3h 27m per day · National avg: 3h 26m per day |
|
Physical Therapist
| 13m per day | ▲ 123% State avg: 6m per day · National avg: 4m per day |
|
Weekend RN
| 36m per day | ▲ 25% State avg: 29m per day · National avg: 28m per day |
Careone At Wall is administered by Terri Rufo.
In New Jersey, the Department of Health, Health Facilities Evaluation and Licensing conducts mandatory unannounced surveys to ensure facilities provide safe and effective resident care.
Deficiencies
| This Facility | NJ Average | vs. NJ Avg |
|---|---|---|---|
|
Total deficiencies
| 81 | 18 | This facility has 350% more total deficiencies than a typical New Jersey nursing home (81 vs. NJ avg 18).↑ 350% worse |
|
Deficiencies per inspection
| 5.8 | 2 | This facility has 190% more deficiencies per inspection than a typical New Jersey nursing home (5.8 vs. NJ avg 2).↑ 190% worse |
Inspections
| This Facility | NJ Average | vs. NJ Avg |
|---|---|---|---|
|
Total inspections
| 14 | 9 | This facility has had 56% more total inspections than the New Jersey average (14 vs. NJ avg 9). More inspections can mean more regulatory scrutiny rather than worse care.↑ 56% more |
State average 4
Last Health inspection on Oct 2024
State average 20.9
State average 5.35
Health citations are formal notices following inspections when they fail to comply with safety and care standards.
24 of 25 citations resulted from standard inspections; and 1 of 25 came from combined inspections (standard and complaint).
State average: 0.7
State average: 0.4
Reporting period: October 1 – December 31, 2025 (Q4 2025). Source: CMS Payroll-Based Journal report.
Manages medical care and health needs.
Assists with medical care and medications.
Helps with daily care and mobility.
Total hours from contractors
180 contractor hours this quarter
| Certified Nursing Assistant | 43 | 0 | 43 | 18,628 | 92 | 100% | 8.3 |
| Licensed Practical Nurse | 21 | 0 | 21 | 8,328 | 92 | 100% | 8.2 |
| Registered Nurse | 11 | 0 | 11 | 4,266 | 92 | 100% | 8.6 |
| Clinical Nurse Specialist | 15 | 0 | 15 | 3,792 | 92 | 100% | 7.4 |
| Physical Therapy Assistant | 13 | 0 | 13 | 2,990 | 92 | 100% | 7 |
| RN Director of Nursing | 6 | 0 | 6 | 2,329 | 69 | 75% | 8 |
| Respiratory Therapy Technician | 11 | 0 | 11 | 2,164 | 84 | 91% | 7.5 |
| Other Dietary Services Staff | 6 | 0 | 6 | 1,774 | 92 | 100% | 7.1 |
| Speech Language Pathologist | 7 | 0 | 7 | 1,353 | 80 | 87% | 6.9 |
| Qualified Social Worker | 8 | 0 | 8 | 693 | 76 | 83% | 6 |
| Nurse Practitioner | 1 | 0 | 1 | 488 | 61 | 66% | 8 |
| Occupational Therapy Aide | 1 | 0 | 1 | 476 | 61 | 66% | 7.8 |
| Administrator | 1 | 0 | 1 | 472 | 59 | 64% | 8 |
| Mental Health Service Worker | 1 | 0 | 1 | 472 | 59 | 64% | 8 |
| Dietitian | 1 | 0 | 1 | 460 | 58 | 63% | 7.9 |
| Physical Therapy Aide | 1 | 0 | 1 | 452 | 63 | 68% | 7.2 |
| Medical Director | 0 | 2 | 2 | 150 | 11 | 12% | 12.5 |
| Other Physician | 0 | 1 | 1 | 30 | 3 | 3% | 10 |
Includes penalties issued in 2023
Federal penalties imposed by CMS for regulatory violations, including civil money penalties (fines) and denials of payment for new Medicare/Medicaid admissions.
Source: CMS Penalties Database (Data as of Jan 2026)
New Jersey average: $77K
New Jersey average: 2.0
New Jersey average: 0.1
Penalties are imposed by CMS for violations of federal nursing home regulations.
1 penalty in the past 3 years
Oct 17, 2023 · $69K
Last updated: Jan 2026
These measures show how residents usually do over time at this home, based on health outcomes and preventive care.
New Jersey average: 6.8
New Jersey average: 12.4
New Jersey average: 10.1%
New Jersey average: 11.0%
New Jersey average: 16.0%
New Jersey average: 2.4%
New Jersey average: 6.1%
New Jersey average: 1.0%
New Jersey average: 4.6%
New Jersey average: 11.3%
New Jersey average: 11.1%
New Jersey average: 93.0%
New Jersey average: 97.2%
New Jersey average: 2.08
New Jersey average: 1.12
New Jersey average: 78.9%
New Jersey average: 1.2%
New Jersey average: 80.1%
New Jersey average: 25.4%
New Jersey average: 8.2%
New Jersey average: 0.8%
New Jersey average: 53.7%
New Jersey average: 50.6%
Quality measures are calculated from Minimum Data Set (MDS) assessments. For most measures, lower percentages indicate better care quality.
56% of new residents, usually for short-term rehab.
42% of new residents, often for short stays.
2% of new residents, often for long-term daily care.
Source: CMS Long-Term Care Facility Characteristics (Data as of Jan 2026)
Residents meet regularly to discuss policies, care quality, and activities
Organized group of residents that meets regularly to discuss facility policies, quality of life, and activities.
Data sourced from CMS Long-Term Care Facility Characteristics quarterly report. Payer mix reflects the current resident census by primary payment source.
Historical financial and operational data for Careone At Wall from 2011–2023, based on CMS SNF Cost Reports.
Key figures below are for fiscal year ending in 12/2023.
Based on CMS SNF Cost Report for fiscal year ending in 12/2023.
Most residents typically stay for a few weeks or months before returning home or moving on.
Most new residents arrive under Medicare (56% of admissions), and a typical Medicare stay runs around 28 days.
Coverage residents most often arrive under.
Coverage residents most often leave under.
![]() 0.5 miles from city center
0.5 miles from city center
![]() Estimated distance in miles from Wall's city center to Careone At Wall's address, calculated via Google Maps.
Estimated distance in miles from Wall's city center to Careone At Wall's address, calculated via Google Maps.
Add your location
The information below is reported by the New Jersey Department of Health, Health Facilities Evaluation and Licensing.
| Job Haines Home | NH AL HC RC SNF | Bloomfield (Bloomfield Avenue) | 40
Facility
40
NJ AVG
125
Rank
#529 / 560 |
97.5%
Facility
97.5%
NJ AVG
74.5
Rank
#15 / 478 | +31% | 6.31
Facility
6.31
NJ AVG
3.88
Rank
#3 / 294 | -2% | +63% | $0
Facility
$0
NJ AVG
$76.4k
Rank
#1 / 297 | 4
Facility
4
NJ AVG
20.9
Rank
#7 / 296 | 1.3
Facility
1.3
NJ AVG
5.3
Rank
#4 / 296 | - | 39 | - |
85
Facility
85
NJ AVG
47
Rank
#62 / 638 | Noreen Haveron | $11.8MFiscal year ending 12/2023
Facility
$11.8MFiscal year ending 12/2023
NJ AVG
$19.6M
Rank
#183 / 292 | $12.4MFiscal year ending 12/2023
Facility
$12.4MFiscal year ending 12/2023
NJ AVG
$7.1M
Rank
#68 / 292 | 105.4%Fiscal year ending 12/2023
Facility
105.4%Fiscal year ending 12/2023
NJ AVG
39.3%
Rank
#20 / 292 | 315392 | ||||
| Fellowship Village | NH AL HC HOS IL MC SNF | Basking Ridge | 67
Facility
67
NJ AVG
125
Rank
#470 / 560 |
86.6%
Facility
86.6%
NJ AVG
74.5
Rank
#150 / 478 | +16% | 5.83
Facility
5.83
NJ AVG
3.88
Rank
#10 / 294 | +57% | +50% | $0
Facility
$0
NJ AVG
$76.4k
Rank
#1 / 297 | 2
Facility
2
NJ AVG
20.9
Rank
#1 / 296 | 1.0
Facility
1.0
NJ AVG
5.3
Rank
#1 / 296 | - | 58 | - |
25
Facility
25
NJ AVG
47
Rank
#476 / 638 | Brian Lawrence | $51.2MFiscal year ending 12/2023
Facility
$51.2MFiscal year ending 12/2023
NJ AVG
$19.6M
Rank
#4 / 292 | $21.7MFiscal year ending 12/2023
Facility
$21.7MFiscal year ending 12/2023
NJ AVG
$7.1M
Rank
#8 / 292 | 42.4%Fiscal year ending 12/2023
Facility
42.4%Fiscal year ending 12/2023
NJ AVG
39.3%
Rank
#280 / 292 | 315356 | ||||
| Bartley Healthcare Nursing and Rehabilitation Center | NH HOS MC PC RC SNF | Jackson Township (Bennetts Mills) | 234
Facility
234
NJ AVG
125
Rank
#36 / 560 |
84.6%
Facility
84.6%
NJ AVG
74.5
Rank
#181 / 478 | +14% | 3.49
Facility
3.49
NJ AVG
3.88
Rank
#178 / 294 | -31% | -10% | $0
Facility
$0
NJ AVG
$76.4k
Rank
#1 / 297 | 12
Facility
12
NJ AVG
20.9
Rank
#52 / 296 | 2.4
Facility
2.4
NJ AVG
5.3
Rank
#25 / 296 | - | 198 | A+ |
19
Facility
19
NJ AVG
47
Rank
#531 / 638 | Bartley Operator Holdco LLC | $28.7MFiscal year ending 12/2023
Facility
$28.7MFiscal year ending 12/2023
NJ AVG
$19.6M
Rank
#33 / 292 | $10.8MFiscal year ending 12/2023
Facility
$10.8MFiscal year ending 12/2023
NJ AVG
$7.1M
Rank
#38 / 292 | 37.7%Fiscal year ending 12/2023
Facility
37.7%Fiscal year ending 12/2023
NJ AVG
39.3%
Rank
#166 / 292 | 315288 | ||||
| Preferred Care At Wall | NH HOS RC SNF | Allenwood (Hospital Road) | 135
Facility
135
NJ AVG
125
Rank
#181 / 560 |
90.4%
Facility
90.4%
NJ AVG
74.5
Rank
#90 / 478 | +21% | 3.71
Facility
3.71
NJ AVG
3.88
Rank
#136 / 294 | -72% | -4% | $0
Facility
$0
NJ AVG
$76.4k
Rank
#1 / 297 | 11
Facility
11
NJ AVG
20.9
Rank
#46 / 296 | 2.8
Facility
2.8
NJ AVG
5.3
Rank
#37 / 296 | - | 122 | - |
2
Facility
2
NJ AVG
47
Rank
#626 / 638 | Preferred Care Holdings,LLC | $18.0MFiscal year ending 12/2023
Facility
$18.0MFiscal year ending 12/2023
NJ AVG
$19.6M
Rank
#93 / 292 | $6.7MFiscal year ending 12/2023
Facility
$6.7MFiscal year ending 12/2023
NJ AVG
$7.1M
Rank
#122 / 292 | 37.4%Fiscal year ending 12/2023
Facility
37.4%Fiscal year ending 12/2023
NJ AVG
39.3%
Rank
#211 / 292 | 315397 | ||||
| Careone At Wall | NH RC SNF | Wall | 138
Facility
138
NJ AVG
125
Rank
#172 / 560 | - | - | 3.38
Facility
3.38
NJ AVG
3.88
Rank
#197 / 294 | -21% | -13% | $68.8k
Facility
$68.8k
NJ AVG
$76.4k
Rank
#248 / 297 | 25
Facility
25
NJ AVG
20.9
Rank
#201 / 296 | 8.3
Facility
8.3
NJ AVG
5.3
Rank
#268 / 296 | 1 | 180 | - |
1
Facility
1
NJ AVG
47
Rank
#629 / 638 | - | $18.0MFiscal year ending 12/2023
Facility
$18.0MFiscal year ending 12/2023
NJ AVG
$19.6M
Rank
#51 / 292 | $10.5MFiscal year ending 12/2023
Facility
$10.5MFiscal year ending 12/2023
NJ AVG
$7.1M
Rank
#88 / 292 | 58%Fiscal year ending 12/2023
Facility
58%Fiscal year ending 12/2023
NJ AVG
39.3%
Rank
#240 / 292 | 315485 |
Careone At Wall is legally operated by Care One At Wall, L.l.c., and administered by Terri Rufo.
Careone At Wall has a walk score of 1. Car-dependent. Most errands require a car, with limited nearby walkable options.
According to NJ state health department records, Careone At Wall's license number is 556213.
According to NJ state health department records, Careone At Wall's license expires on August 31, 2026.
Careone At Wall's occupancy is 100%.
No, Careone At Wall has a no-pet policy.
Careone At Wall is registered as a for-profit in NJ.
Care Cost Calculator: See Prices in Your Area
Nursing Home Data Explorer
Don’t Wait Too Long: 7 Red Flag Signs Your Parent Needs Assisted Living Now
The True Cost of Assisted Living in 2025 – And How Families Are Paying For It
Understanding Senior Living Costs: Pricing Models, Discounts & Financial Assistance


