


Occupancy rate
65%
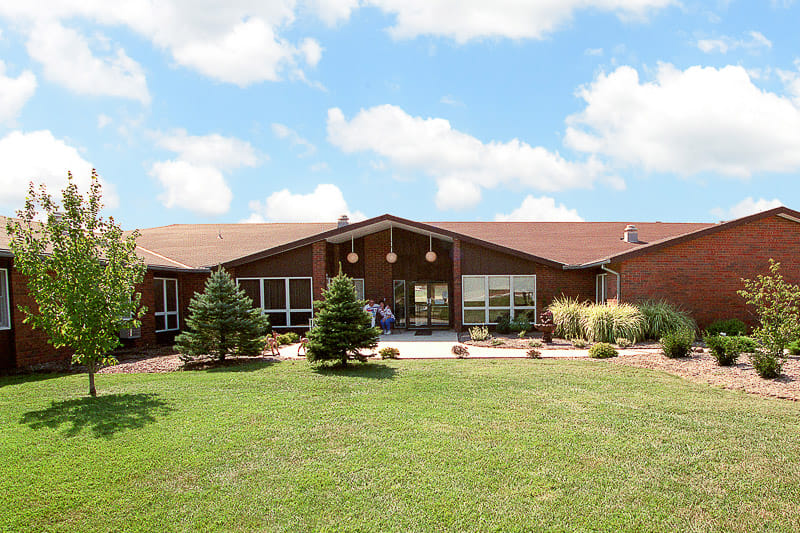
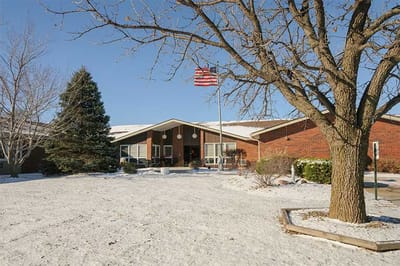
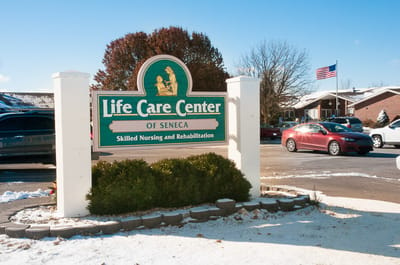
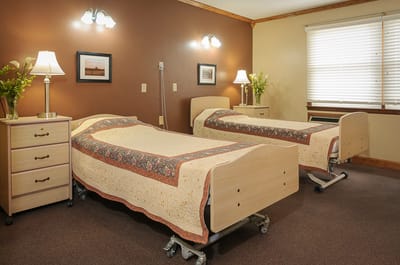
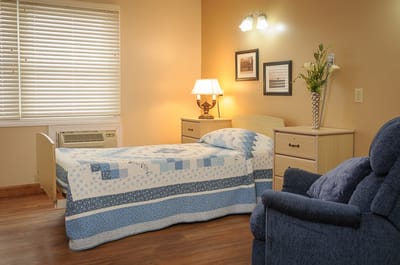


Life Care Center of Seneca is a 60-bed skilled nursing and rehabilitation facility operated by Seneca Health Care Medical Investors LLC in Seneca, Kansas. The community serves Nemaha County residents across a continuum that includes skilled nursing, memory care, rehabilitation, respite stays, and independent and assisted living. Medicare, Medicaid, and private pay accepted. Occupancy runs at 65 percent which is below Kansas’ 79.5 percent average, typically signaling availability for new admissions.
The facility holds a 5-star CMS rating, 80.5 percent above Kansas’ average, with staffing as a primary driver at 38.5 percent above state benchmark. Nurse hours run 4h 23m per resident daily. Over the 12-year inspection window, the facility averaged 9.9 deficiencies per year against a Kansas average of 6. Three findings are weightier than the numbers alone: a 2016 immediate jeopardy determination tied to a resident elopement, a 2019 substantiated complaint in which an abuse allegation was not reported to the state, and a 2023 substantiated complaint involving resident-to-resident physical abuse. The latest annual survey in April 2025 cited 5 deficiencies, includingdignity, medication management, infection control, all corrected by July 2025.
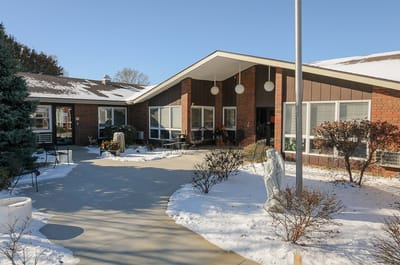
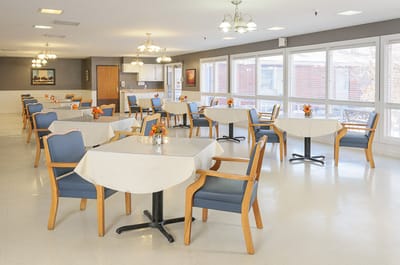
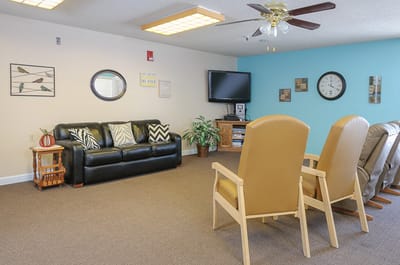
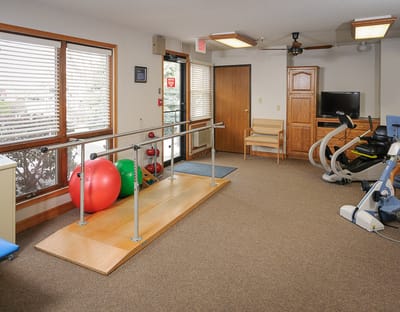
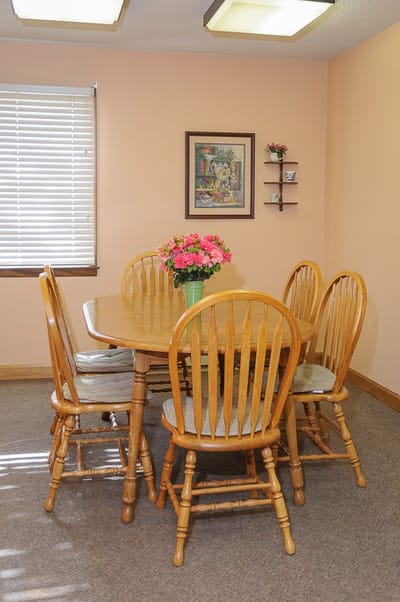
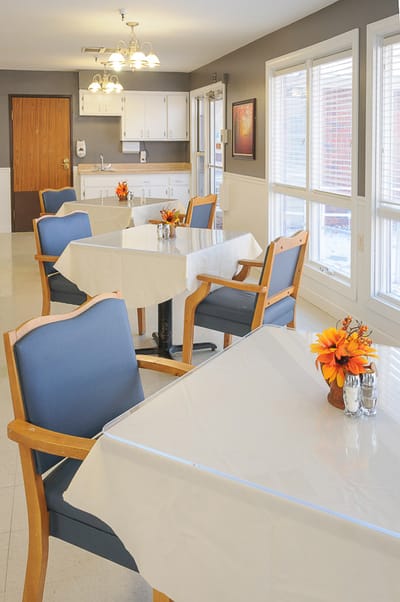
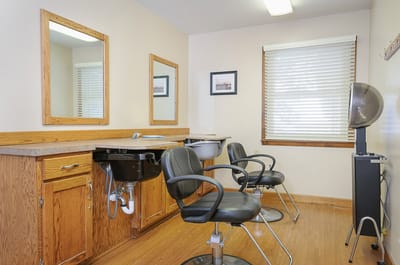
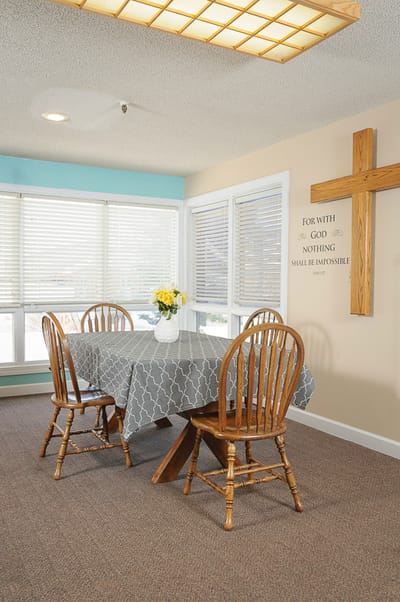
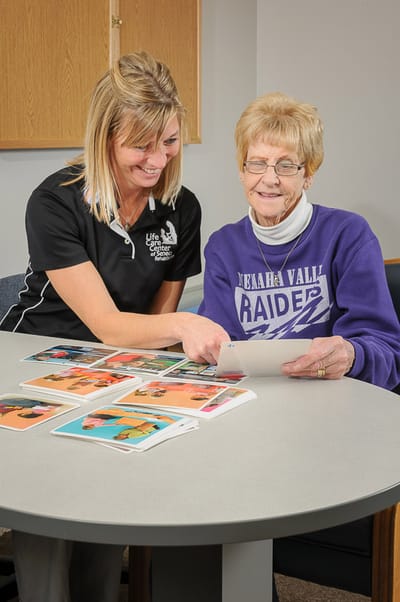
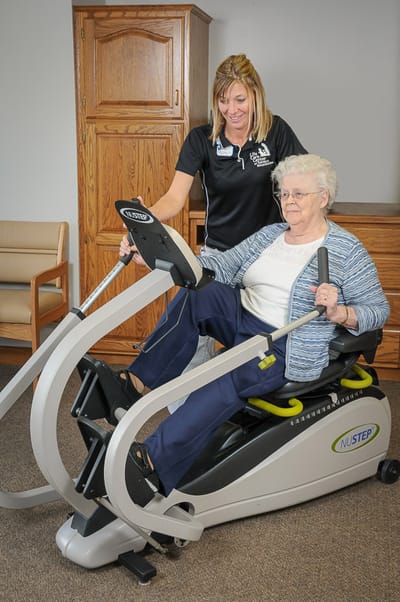
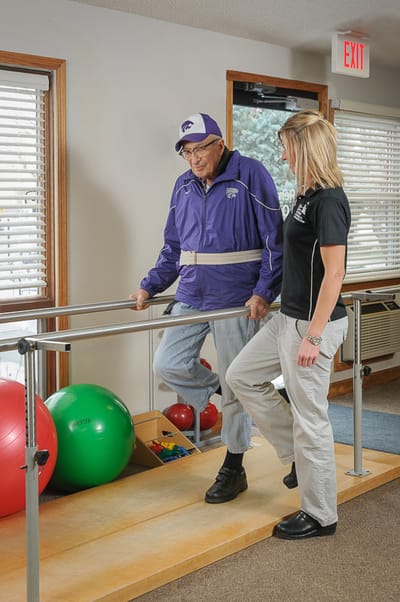
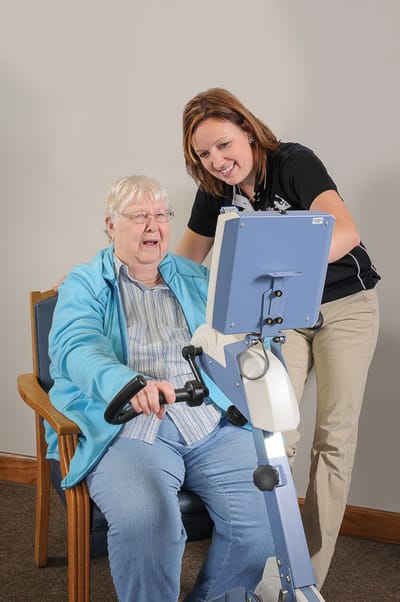
Amenities span a fine dining program, a community re-entry program, landscaped grounds and courtyards, and a certified activity director. Alzheimer’s and dementia care programming is offered alongside rehabilitation services geared toward discharge and recovery.
With memory care capacity for those in earlier to mid-stage dementia, Life Care Center of Seneca suits residents requiring post-acute rehabilitation or long-term skilled nursing care in a small-town Nemaha County setting.
| Staff type | Hours / Day / Resident | vs state avg |
|---|---|---|
|
Registered Nurse (RN)
|
41m per day | ▼ 4% State avg: 43m per day · National avg: 41m per day |
|
LPN / LVN
|
43m per day | ▲ 8% State avg: 40m per day · National avg: 52m per day |
|
Nurse Aide
|
2h 25m per day | ▼ 10% State avg: 2h 41m per day · National avg: 2h 20m per day |
|
Weekend Total Nursing
|
3h 12m per day | ▼ 11% State avg: 3h 35m per day · National avg: 3h 26m per day |
|
Physical Therapist
|
0m per day | ▼ 100% State avg: 2m per day · National avg: 4m per day |
|
Weekend RN
|
22m per day | ▼ 25% State avg: 30m per day · National avg: 28m per day |
Life Care Center of Seneca is administered by Ashley Laflin.
Key information about the people who lead and staff this community.
In Kansas, the Department for Aging and Disability Services, Survey and Certification Commission performs the unannounced inspections required for facility licensing and federal certification.
Deficiencies
|
This Facility | KS Average | vs. KS Avg |
|---|---|---|---|
|
Total deficiencies
|
124 | 100 | This facility has 24% more total deficiencies than a typical Kansas assisted living residence (124 vs. KS avg 100).↑ 24% worse |
|
Deficiencies per year
|
9.5 | 7.7 | This facility has 23% more deficiencies per year than a typical Kansas assisted living residence (9.5 vs. KS avg 7.7).↑ 23% worse |
State average N/A
Last Health inspection on Apr 2025
State average N/A
State average N/A
Health citations are formal notices following inspections when they fail to comply with safety and care standards.
15 of 16 citations resulted from standard inspections; and 1 of 16 resulted from complaint investigations.
State average: N/A
State average: N/A
Reporting period: October 1 – December 31, 2025 (Q4 2025). Source: CMS Payroll-Based Journal report.
State average ratio: 0 : 0
State average: 0 hours
Manages medical care and health needs.
Assists with medical care and medications.
Helps with daily care and mobility.
Total hours from contractors
82 contractor hours this quarter
| Certified Nursing Assistant | 28 | 0 | 28 | 6,061 | 92 | 100% | 7.5 |
| Medication Aide/Technician | 8 | 0 | 8 | 2,427 | 92 | 100% | 7.5 |
| Licensed Practical Nurse | 6 | 0 | 6 | 2,104 | 92 | 100% | 8.8 |
| Registered Nurse | 8 | 0 | 8 | 1,027 | 88 | 96% | 8.6 |
| Clinical Nurse Specialist | 3 | 0 | 3 | 991 | 70 | 76% | 7 |
| Administrator | 3 | 0 | 3 | 552 | 66 | 72% | 8 |
| Speech Language Pathologist | 3 | 0 | 3 | 544 | 64 | 70% | 6.7 |
| Dietitian | 1 | 0 | 1 | 439 | 61 | 66% | 7.2 |
| RN Director of Nursing | 2 | 0 | 2 | 424 | 57 | 62% | 7.3 |
| Mental Health Service Worker | 1 | 0 | 1 | 418 | 58 | 63% | 7.2 |
| Nurse Practitioner | 1 | 0 | 1 | 397 | 55 | 60% | 7.2 |
| Physical Therapy Assistant | 2 | 0 | 2 | 336 | 69 | 75% | 4.3 |
| Qualified Social Worker | 2 | 0 | 2 | 59 | 37 | 40% | 1.5 |
| Occupational Therapy Assistant | 0 | 1 | 1 | 38 | 7 | 8% | 5.4 |
| Medical Director | 0 | 1 | 1 | 23 | 3 | 3% | 7.5 |
| Occupational Therapy Aide | 0 | 1 | 1 | 21 | 4 | 4% | 5.3 |
Federal penalties imposed by CMS for regulatory violations, including civil money penalties (fines) and denials of payment for new Medicare/Medicaid admissions.
Source: CMS Penalties Database
No penalties in the past 3 years
No civil money penalties or payment denials were reported in the last 3 years.
These measures show how residents usually do over time at this home, based on health outcomes and preventive care.
State average: 10.5
State average: 20.7
State average: 19.0%
State average: 19.4%
State average: 23.8%
State average: 4.4%
State average: 4.6%
State average: 3.1%
State average: 5.1%
State average: 5.2%
State average: 16.9%
State average: 91.9%
State average: 95.5%
State average: 1.84
State average: 2.16
State average: 75.6%
State average: 2.2%
State average: 73.5%
State average: 23.0%
State average: 11.7%
State average: 0.8%
State average: 53.7%
State average: 50.6%
Quality measures are calculated from Minimum Data Set (MDS) assessments. For most measures, lower percentages indicate better care quality.
49% of new residents, usually for short-term rehab.
28% of new residents, often for short stays.
23% of new residents, often for long-term daily care.
Source: CMS Long-Term Care Facility Characteristics (Data as of Jan 2026)
Residents meet regularly to discuss policies, care quality, and activities
Organized group of residents that meets regularly to discuss facility policies, quality of life, and activities.
Data sourced from CMS Long-Term Care Facility Characteristics quarterly report. Payer mix reflects the current resident census by primary payment source.
Historical financial and operational data for Life Care Center of Seneca from 2011–2023, based on CMS SNF Cost Reports.
Based on CMS SNF Cost Report for fiscal year ending in 12/2023.
Most residents typically stay for a few weeks or months before returning home or moving on.
New residents most often arrive under Medicare (49% of admissions), and a typical Medicare stay runs around 18 days.
Coverage residents most often arrive under.
Coverage residents most often leave under.
![]() 0.0 miles from city center
0.0 miles from city center
![]() Estimated distance in miles from Seneca's city center to Life Care Center of Seneca's address, calculated via Google Maps.
Estimated distance in miles from Seneca's city center to Life Care Center of Seneca's address, calculated via Google Maps.
Add your location
The information below is reported by the Kansas Department for Aging and Disability Services.
|
|
|
|
|
|
|
|
|
|---|---|---|---|---|---|---|---|
| Life Care Center of Seneca |
NH
|
Seneca | - | 60 | A+ | 58 | - |
| Lexington Park Assisted Living |
NH
AL
IL
|
Topeka (West Southwest 2) | - | 60 | A+ | 60 | studio / 1 bed |
| Brookdale Rosehill |
NH
AL
|
Shawnee | - | 92 | A+ | 54 | Studio / 1 Bed |
| Lakeview Village |
NH
AL
IL
|
Lenexa | - | 184 | A+ | 54 | 1 Bed / 2 Bed / 3 Bed |
| Colonial Village Overland Park |
NH
AL
IL
MC
|
Overland Park | - | 82 | - | 45 | 1 Bed / 2 Bed |
Life Care Center of Seneca is legally operated by Seneca Health Care Medical Investors Llc, and administered by Ashley Laflin.
Life Care Center of Seneca has a walk score of 58. Moderately walkable. Some errands can be accomplished on foot, with a mix of nearby amenities.
According to KS state health department records, Life Care Center of Seneca's license number is 175439.
Life Care Center of Seneca's occupancy is 65%.
Life Care Center of Seneca is registered as a for-profit in KS.
Ashley Laflin is the administrator of Life Care Center of Seneca.
Life Care Center of Seneca has 60 beds.
Care Cost Calculator: See Prices in Your Area
Nursing Home Data Explorer
Don’t Wait Too Long: 7 Red Flag Signs Your Parent Needs Assisted Living Now
The True Cost of Assisted Living in 2025 – And How Families Are Paying For It
Understanding Senior Living Costs: Pricing Models, Discounts & Financial Assistance


