Trillium Woods
Nursing Home, Assisted Living, Independent Living & Memory Care · Plymouth, MA
CMS overall rating Info CMS (the Centers for Medicare & Medicaid Services) is the federal agency that rates nursing home quality. Its Overall Rating runs from 1 to 5 stars, combining health inspections, staffing, and quality measures, with inspections weighted most heavily.

Trillium Woods

Nursing Home, Assisted Living, Independent Living & Memory Care · Plymouth, MA
CMS overall rating Info CMS (the Centers for Medicare & Medicaid Services) is the federal agency that rates nursing home quality. Its Overall Rating runs from 1 to 5 stars, combining health inspections, staffing, and quality measures, with inspections weighted most heavily.
Calculator: See prices in your area
Trillium Woods accepts Medicare, Medicaid, and private pay.

Overview of Trillium Woods

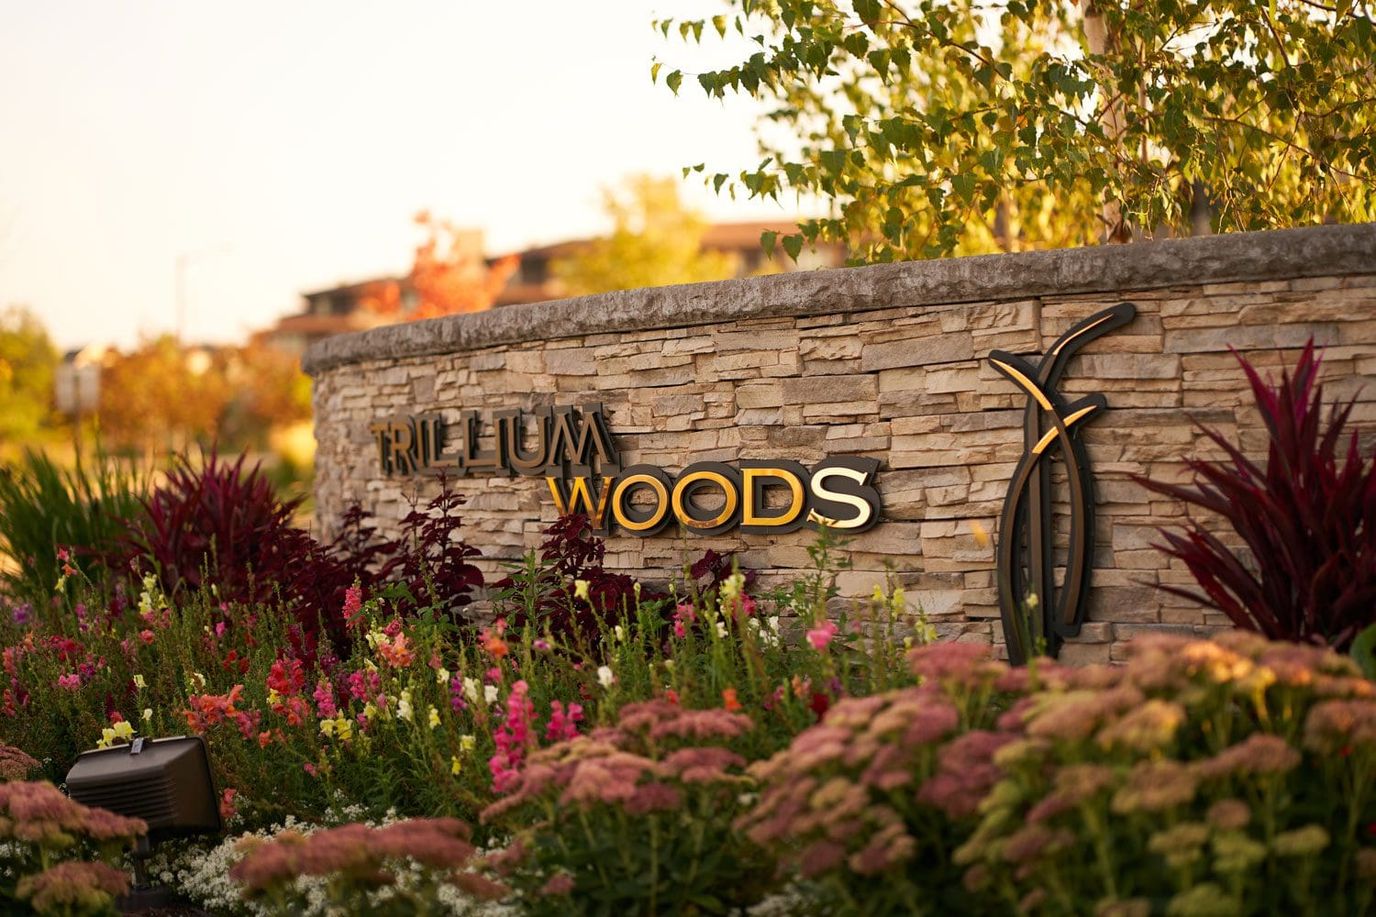
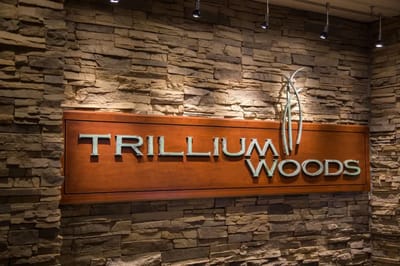
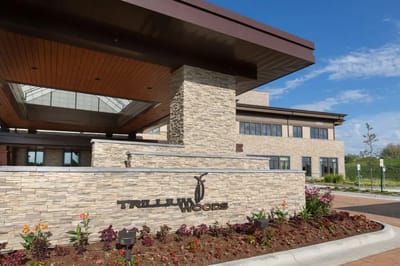
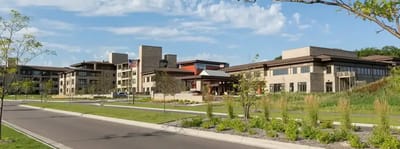
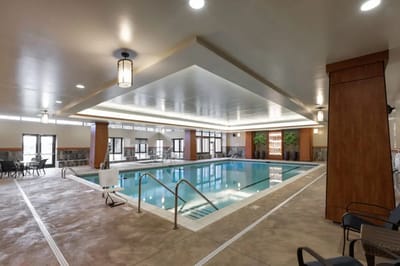
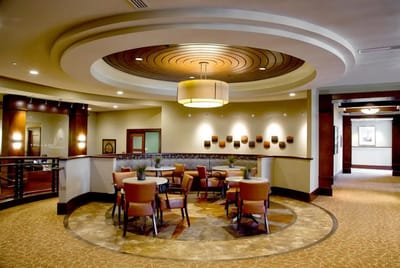
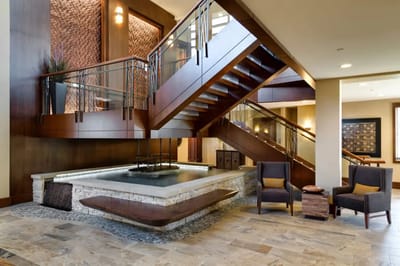
Trillium Woods, situated in Plymouth, Minnesota, is an optimal choice for a retirement community that caters to the needs of loved ones. Occupying 46 acres of property with lakes and scenic views, its location provides a serene backdrop. Residents benefit from convenient access to Greater Minneapolis downtown areas, making Trillium Woods an appealing option. The community excels in offering a range of amenities and well-designed apartment homes that elevate senior living, encompassing memory care, assisted living, skilled nursing care, rehabilitation, and independent senior living options.

Trillium Woods, a multi-awarded community, earns its accolades through various services and amenities. Going beyond basic offerings, the community provides a luxurious lifestyle with medical services, such as rehabilitative therapy (physical, occupational, speech), stroke recovery, and pain management– among many others.

Quality ratings

Measured by Centers for Medicare & Medicaid Services (CMS)

Overall rating Info The Overall CMS Rating combines results from health inspections, staffing levels and quality measures. Health inspections carry the most weight. Staffing and quality scores can increase or decrease the final rating based on performance compared to state and national standards.
▲ 38.1% Above MA avg. ▲ 38.1% Above MA avg.MA average: 3.6Click the badge to see the full State ranking.Click here to see the full State ranking.
Health Inspection Info Based on the results of the facility's three most recent standard inspections and any complaint investigations. CMS reviews the number, scope, and severity of deficiencies, with more recent findings weighted more heavily.
▲ 66.7% Above MA avg. ▲ 66.7% Above MA avg.MA average: 3.0Click the badge to see the full State ranking.Click here to see the full State ranking.
Staffing Info Measures average nursing staff hours per resident per day, including Registered Nurses (RNs) and total nursing staff. Ratings are adjusted based on the level of care residents require and are compared to state and national benchmarks.
▲ 32.3% Above MA avg. ▲ 32.3% Above MA avg.MA average: 3.8Click the badge to see the full State ranking.Click here to see the full State ranking.
Quality Measures Info Based on clinical and physical health indicators reported to CMS, such as hospital readmissions, falls, pressure ulcers, and improvements in mobility. These measures reflect how well residents' health needs are being managed.
▲ 17.0% Above MA avg. ▲ 17.0% Above MA avg.MA average: 3.4Click the badge to see the full State ranking.Click here to see the full State ranking.

Staffing hours breakdown

Info Daily nursing hours per resident by staff type, reported to CMS. Higher is generally better — compare this facility to state and national averages to see where staffing stands.

Hours per resident per day — compared to Massachusetts state averages

Total nursing care / resident Info This home is ranked 6th out of 85 homes in Massachusetts for nurse hours. Total adjusted nursing hours per resident per day, combining RN, LPN, and aide time. CMS adjusts this for case-mix so facilities can be fairly compared.
6h 11m per day
Rank #6 / 85Nurse hours — State benchmarkedThis home is ranked 6th out of 85 homes in Minnesota. Shows adjusted nurse hours per resident per day benchmarked to the Minnesota average, with a ranking across 85 Minnesota facilities. More hours mean more direct care. The national average is about 3.5 hrs; below 3.0 is a red flag.Click the rank badge to see the full State ranking.Click here to see the full State ranking.
This facility Massachusetts avg (5h 7m per day)
vs Massachusetts avg
+21%

1 of 6 metrics below state avg

Standout metric Registered Nurse (RN) is +103% above state avg
Staff typeHours / Day / Residentvs state avg
Registered Nurse (RN) Info RNs hold the highest nursing license and can assess residents, interpret test results, and direct care plans. More RN hours per day often signals stronger clinical oversight and faster response to health changes. 1h 19m per day ▲ 103% State avg: 39m per day · National avg: 41m per day
LPN / LVN Info Licensed Practical Nurses (LPNs) or Licensed Vocational Nurses (LVNs) deliver routine hands-on care — medication administration, wound dressing, and monitoring vital signs. They work under RN supervision and make up a large share of daily bedside care. 55m per day ▼ 3% State avg: 57m per day · National avg: 52m per day
Nurse Aide Info Certified Nurse Aides (CNAs) provide the most direct day-to-day assistance: bathing, dressing, feeding, and mobility. Nurse aide hours are typically the largest staffing category and directly affect residents' quality of life. 3h 17m per day ▲ 45% State avg: 2h 16m per day · National avg: 2h 20m per day
Weekend Total Nursing Info Combined nursing hours (RN + LPN + Nurse Aide) per resident per day on weekends. Staffing often drops on weekends — this figure reveals whether the facility maintains adequate coverage outside of weekday hours. 5h 11m per day ▲ 49% State avg: 3h 29m per day · National avg: 3h 27m per day
Physical Therapist Info Hours per resident per day provided by licensed Physical Therapists (PTs) or PT Assistants. PT services help residents recover mobility after injury or illness and are especially important for post-acute (short-stay) rehabilitation. 5m per day ■ Avg State avg: 5m per day · National avg: 4m per day
Weekend RN Info Registered nurse hours specifically on weekends. Facilities sometimes reduce RN presence on Saturdays and Sundays — a low weekend RN figure compared to weekday hours can indicate reduced clinical oversight when most administrative staff are absent. 46m per day ▲ 70% State avg: 27m per day · National avg: 29m per day

Capacity and availability

This home usually has availability

Lower occupancy than the Massachusetts average: 82%
Occupancy rate
72.7% Rank #212 / 328Occupancy rate — State benchmarkedThis home is ranked 212th out of 328 homes in Minnesota. Shows this facility's occupancy rate versus the Minnesota average, with its Statewide rank out of 328. Higher occupancy signals strong local demand and financial stability.Click the rank badge to see the full State ranking.Click here to see the full State ranking.
Avg. Length of Stay
80 days
Years in operation
10 years in operation Rank #95 / 137Years in operation — State benchmarkedThis home is ranked 95th out of 137 homes in Minnesota. Shows how long this facility has been in operation compared to other Minnesota facilities. Longer operating histories may benefit residents, families, and staff.Click the rank badge to see the full State ranking.Click here to see the full State ranking.
A community with a solid operating history and experience delivering ongoing care.
Walk Score
Walk Score: 4 / 100 Rank #585 / 632Walk Score — State benchmarkedThis home is ranked 585th out of 632 homes in Minnesota. Shows how walkable this facility's neighborhood is compared to the average Walk Score across Minnesota facilities. Higher scores benefit residents, families, and staff.Click the rank badge to see the full State ranking.Click here to see the full State ranking.
Car-dependent. Most errands require a car, with limited nearby walkable options.
BBB Rating
BBB Rating: A+ (Not Accredited)
An independent rating from the Better Business Bureau based on factors such as complaint history, transparency, and business practices.
How BBB ratings work

About this community

License Details

CMS Certification Number245627

Staffing

Key information about the people who lead and staff this community.

Leadership

ContactNancy Birkholtz, Marketing Assistant

Therapy & Rehabilitation

1 service
Rehabilitation Services

Amenities & Lifestyle

Specific ProgramsDining Options, Active Lifestyle, Health Care Navigator, Campus Map, Community Outreach

Contact Trillium Woods

Inspection History

In Massachusetts, the Department of Health, Health Regulation Division is the primary authority for conducting onsite inspections and reporting on the quality of care in residential facilities.

Since 2022 · 4 years of data 4 deficiencies

Inspection Scorecard Info This scorecard compares key inspection, citation, and complaint metrics at this facility against the Massachusetts state average. Metrics rated ≥15% worse than average are highlighted in red; those ≥15% better are highlighted in green.

Since 2022 vs. Massachusetts state average
Overall vs. MN average 0 Worse No metrics in this bucket. 2 Better Metrics better than Massachusetts average:
• Total deficiencies (60% below)
• Deficiencies per year (60% below)
Latest Inspection September 12, 2024 Routine

Deficiencies Info Deficiencies are formal regulatory issues recorded during state inspections.

This FacilityMN Averagevs. MN Avg
Total deficiencies Info Formal regulatory issues recorded by inspectors across all inspection types. 410 This facility has 60% fewer total deficiencies than a typical Massachusetts nursing home (4 vs. MN avg 10).↓ 60% better
Deficiencies per year Info Average deficiencies per year since 2022. 12.5 This facility has 60% fewer deficiencies per year than a typical Massachusetts nursing home (1 vs. MN avg 2.5).↓ 60% better

Inspection Reports Summary Info An editor-reviewed summary of the themes and findings across this facility's recent inspection reports.

  • September 12, 2024 inspection found 2 deficiencies: missed orthostatic blood pressure monitoring for 2 residents on psychotropic meds and insulin administration errors for 1 resident.
  • August 17, 2023 annual inspection found no health deficiencies or complaints during the full survey.
  • June 2, 2022 complaint investigation substantiated failure to timely report abuse allegations for 3 residents and incomplete annual reviews for 3 nursing assistants.

Health Inspection History

Inspections since 2022
Total health inspections 2

Massachusetts average 4.5


Last Health inspection on Sep 2024

Total health citations
4 Rank #3 / 86Health citations — State benchmarkedThis home is ranked 3rd out of 86 homes in Minnesota. Shows this facility's total health deficiency citations benchmarked to the Minnesota State average, with a ranking across all 86 MN facilities. Lower citation counts earn a better rank.Click the rank badge to see the full State ranking.Click here to see the full State ranking.

Massachusetts average 32.7

Citations per inspection
2 Rank #6 / 86Citations per inspection — State benchmarkedThis home is ranked 6th out of 86 homes in Minnesota. Shows average deficiency citations per CMS inspection for this facility versus the Minnesota mean across 86 facilities with citation data. Lower is better.Click the rank badge to see the full State ranking.Click here to see the full State ranking.

Massachusetts average 7.24


Health citations are formal notices following inspections when they fail to comply with safety and care standards.

All 4 citations resulted from standard inspections.

Breakdown of citation severity (last 4 years)
Critical health citations
0
100% better than Massachusetts average

Massachusetts average: 0.3


Serious health citations
0
100% better than Massachusetts average

Massachusetts average: 1.5

0 critical citations Massachusetts average: 0.3

0 serious citations Massachusetts average: 1.5

3 moderate citations Massachusetts average: 29.7

1 minor citation Massachusetts average: 1.3
Citations history (last 4 years)
Pharmacy moderate citation Sep 12, 2024
Corrected

Pharmacy moderate citation Sep 12, 2024
Corrected

Abuse/Neglect moderate citation Jun 02, 2022
Corrected

Nursing Services minor citation Jun 02, 2022
Corrected

Staffing Data

Reporting period: October 1 – December 31, 2025 (Q4 2025). Source: CMS Payroll-Based Journal report.

Total staff 124
Employees 106
Contractors 18
Staff to resident ratio 2.88 : 1
74% more staff per resident than Massachusetts average
Massachusetts average ratio: 1.66 : 1 Massachusetts average ratio: 1.66 : 1See full Massachusetts ranking
Avg staff/day 38
Average shift 7 hours
11% worse than Massachusetts average
Massachusetts average: 7.9 hours Massachusetts average shift: 7.9 hoursSee full Massachusetts ranking
Total staff hours (quarter) 24,444

Nursing staff breakdown

Q4 2025 · Oct 1 – Dec 31 More info This data comes from the CMS Payroll-Based Journal report covering October 1 – December 31, 2025.
Registered Nurse

Manages medical care and health needs.

RN Staff Info All 19 RN Staff are full-time employees. No contractors work on this role. 19
Average shift length Info Average shift length. Calculated as total hours divided by days worked and average staff per day. 7.3 hours
Licensed Practical Nurse

Assists with medical care and medications.

LPN Staff Info All 15 LPN Staff are full-time employees. No contractors work on this role. 15
Average shift length Info Average shift length. Calculated as total hours divided by days worked and average staff per day. 7.7 hours
Certified Nursing Assistant

Helps with daily care and mobility.

CNA Staff Info All 54 CNA Staff are full-time employees. No contractors work on this role. 54
Average shift length Info Average shift length. Calculated as total hours divided by days worked and average staff per day. 7.8 hours

Contractor staffing

Q4 2025 · Oct 1 – Dec 31 More info This data comes from the CMS Payroll-Based Journal report covering October 1 – December 31, 2025.

Total hours from contractors

7%

1,702 contractor hours this quarter

Qualified Social Worker: 4 Respiratory Therapy Technician: 3 Physical Therapy Aide: 3 Speech Language Pathologist: 2 Physical Therapy Assistant: 2 Occupational Therapy Assistant: 2 Medical Director: 2

Staff by category

Q4 2025 · Oct 1 – Dec 31 More info This data comes from the CMS Payroll-Based Journal report covering October 1 – December 31, 2025.
Certified Nursing Assistant5405411,32592100%7.8
Registered Nurse190193,28992100%7.3
Licensed Practical Nurse150153,20592100%7.7
Other Dietary Services Staff7071,92692100%7.7
Clinical Nurse Specialist2028925964%8
Dental Services Staff2026636166%7.7
Administrator1015286672%8
Speech Language Pathologist0224827379%3.6
Occupational Therapy Aide1014746166%7.8
Nurse Practitioner1014005054%8
Physical Therapy Assistant0223516874%3.6
Physical Therapy Aide0333386874%3.4
Respiratory Therapy Technician0332646470%3.5
Qualified Social Worker0442226267%2.5
Medication Aide/Technician4044044%8.1
Medical Director0222544%6.3
Occupational Therapy Assistant022203437%0.6
54 Certified Nursing Assistant
% of Days 100%
19 Registered Nurse
% of Days 100%
15 Licensed Practical Nurse
% of Days 100%
7 Other Dietary Services Staff
% of Days 100%
2 Clinical Nurse Specialist
% of Days 64%
2 Dental Services Staff
% of Days 66%
1 Administrator
% of Days 72%
2 Speech Language Pathologist
% of Days 79%
1 Occupational Therapy Aide
% of Days 66%
1 Nurse Practitioner
% of Days 54%
2 Physical Therapy Assistant
% of Days 74%
3 Physical Therapy Aide
% of Days 74%
3 Respiratory Therapy Technician
% of Days 70%
4 Qualified Social Worker
% of Days 67%
4 Medication Aide/Technician
% of Days 4%
2 Medical Director
% of Days 4%
2 Occupational Therapy Assistant
% of Days 37%

Penalties and fines

Federal penalties imposed by CMS for regulatory violations, including civil money penalties (fines) and denials of payment for new Medicare/Medicaid admissions.

Source: CMS Penalties Database

No penalties in the past 3 years

No civil money penalties or payment denials were reported in the last 3 years.

Quality of care over time

These measures show how residents usually do over time at this home, based on health outcomes and preventive care.

High-risk clinical events score Info A composite score based on pressure ulcers, falls with injury, weight loss, walking ability decline, and activities of daily living decline. 11.3
In line with Massachusetts average

Massachusetts average: 11.1

Functional decline score Info A composite score based on activities of daily living decline, walking ability decline, and incontinence. 25.7
14% worse than Massachusetts average

Massachusetts average: 22.6

Long-stay resident measures
Need for Help with Daily Activities Increased Info Percent of long-stay residents whose need for help with daily activities has increased 26.8%
41% worse than Massachusetts average

Massachusetts average: 18.9%

Walking Ability Worsened Info Percent of long-stay residents whose ability to move independently worsened 18.4%
23% better than Massachusetts average

Massachusetts average: 23.8%

Low Risk Residents with Bowel/Bladder Incontinence Info Percent of low risk long-stay residents who lose control of their bowels or bladder 32.0%
28% worse than Massachusetts average

Massachusetts average: 25.0%

Falls with Major Injury Info Percent of long-stay residents experiencing one or more falls with major injury 9.5%
153% worse than Massachusetts average

Massachusetts average: 3.7%

High Risk Residents with Pressure Ulcers Info Percent of long-stay high risk residents with pressure ulcers 0.0%
100% better than Massachusetts average

Massachusetts average: 5.4%

Urinary Tract Infection Info Percent of long-stay residents with a urinary tract infection 2.1%
23% better than Massachusetts average

Massachusetts average: 2.7%

Lost Too Much Weight Info Percent of long-stay residents who lose too much weight 1.8%
56% better than Massachusetts average

Massachusetts average: 4.1%

Depressive Symptoms Info Percent of long-stay residents who have depressive symptoms 12.2%
181% worse than Massachusetts average

Massachusetts average: 4.4%

Antipsychotic Use Info Percent of long-stay residents who received an antipsychotic medication 25.0%
45% worse than Massachusetts average

Massachusetts average: 17.2%

Pneumococcal Vaccine Info Percent of long-stay residents assessed and appropriately given the pneumococcal vaccine 100.0%
In line with Massachusetts average

Massachusetts average: 97.3%

Influenza Vaccine Info Percent of long-stay residents assessed and appropriately given the seasonal influenza vaccine 100.0%
In line with Massachusetts average

Massachusetts average: 96.0%

Short-stay resident measures
Pneumococcal Vaccine Info Percent of short-stay residents assessed and appropriately given the pneumococcal vaccine 100.0%
12% better than Massachusetts average

Massachusetts average: 88.9%

Antipsychotic medication increase Info Percent of short-stay residents who newly received an antipsychotic medication 0.0%
100% better than Massachusetts average

Massachusetts average: 1.9%

Influenza Vaccine Info Percent of short-stay residents assessed and appropriately given the seasonal influenza vaccine 93.8%
14% better than Massachusetts average

Massachusetts average: 82.6%

Breakdown by payment type

Medicare

39% of new residents, usually for short-term rehab.

Typical stay 26 days

Private pay

60% of new residents, often for short stays.

Typical stay 3 - 4 months

Medicaid

1% of new residents, often for long-term daily care.

Typical stay 19 days

Facility Characteristics

Source: CMS Long-Term Care Facility Characteristics (Data as of Jan 2026)

Total residents 43
Medicare
7
16.3% of residents
Private pay or other
36
83.7% of residents
Programs & Services
Residents Group

Residents meet regularly to discuss policies, care quality, and activities

Family Member Group

Family members meet regularly to discuss policies, care quality, and activities

CCRC

Part of a Continuing Care Retirement Community offering multiple care levels

Active Family Council

Organized group of family members that meets regularly to discuss facility policies, resident care, and activities.

Active Resident Council

Organized group of residents that meets regularly to discuss facility policies, quality of life, and activities.

Finances and operations

Based on the 2023 CMS SNF Cost Report.

Voluntary non-profit community
Operated by a church.
Home revenue
$24.7M
Operating deficit
-$7.9M
Voluntary non-profit community Operated by a church.
Home revenue
$24.7M Rank #13 / 85Revenue — State benchmarkedThis home is ranked 13th out of 85 homes in Minnesota. Shows this facility's annual revenue compared to the Minnesota average. Higher revenue generally means more resources for staffing and capital — read alongside Payroll %.Click the rank badge to see the full State ranking.Click here to see the full State ranking.
Operating deficit
-$7.9M
Payroll costs Info The portion of the home's budget spent on staff, including nurses, caregivers, and other employees who support care and operations. Rank #30 / 85Payroll — State benchmarkedThis home is ranked 30th out of 85 homes in Minnesota. Shows total annual staff payroll benchmarked to the Minnesota average. Higher payroll investment relative to peers often signals better staffing and less reliance on cheaper contract labor.Click the rank badge to see the full State ranking.Click here to see the full State ranking.
$8.9M
36% of revenue Rank #81 / 85Payroll % — State benchmarkedThis home is ranked 81st out of 85 homes in Minnesota. Shows payroll as a percentage of revenue versus the Minnesota average. Well-run Minnesota facilities typically land around 61–68% — the top third Statewide. Below 25% may signal understaffing or heavy agency use — read with Staffing ratings.Click the rank badge to see the full State ranking.Click here to see the full State ranking.
Other operating costs Info All remaining costs needed to run the home, such as food, utilities, building maintenance, supplies and administrative expenses.
$23.7M
Total costs $32.6M

Who this home usually serves

TYPE OF STAY

Primarily short stays

Residents typically stay for brief periods, with frequent admissions and discharges throughout the year.

Most new residents arrive under private pay (60% of admissions), and a typical private pay stay runs around 3 - 4 months.

Admissions
182 total

Coverage residents most often arrive under.

Medicare 39%
Private pay 60%
Medicaid 1%
Discharges
176 total

Coverage residents most often leave under.

Medicare 35%
Private pay 64%
Medicaid 1%

Managed by Joseph “Joe” Amend-Marshall

Executive Director

Over 20 years of experience

Joseph “Joe” Amend-Marshall is the Executive Director at Trillium Woods, bringing over 20 years of senior living experience. He is a licensed nursing home administrator and assisted living director with a Master of Arts in Health & Human Service Administration. Joe is passionate about aging well and enhancing life in a continuing care retirement community, focusing on exceptional resident service and building a cohesive team.

Places of interest near Trillium Woods

Address 4.9 miles from city center Info Estimated distance in miles from Plymouth's city center to Trillium Woods's address, calculated via Google Maps. — 7.55 miles to nearest hospital (North Memorial Health - Robbinsdale Hospital)

Calculate Travel Distance to Trillium Woods

Add your location

Address

Financial Assistance for
Nursing Home in Massachusetts

Trillium Woods is located in Plymouth, Massachusetts.
Here are the financial assistance programs available to residents in Massachusetts.

Get Financial aid guidance

Home Care Program

MassHealth Home Care

Age 60+
General Massachusetts resident, at risk of nursing home placement.
Income Limits (2025) ~$1,500/month individual, varies by region
Asset Limits $2,000 individual, excludes home, car
MA

Coordinated through Aging Services Access Points (ASAPs); high demand in urban areas.

Benefits
In-home care (3-5 hours/day) Homemaker services Respite care (up to 14 days/year) Adult day care (~$75/day)

Frail Elder Waiver

Massachusetts Medicaid FE Waiver

Age 65+
General Massachusetts resident, Medicaid-eligible, nursing home-level care need.
Income Limits (2025) ~$2,829/month 300% FBR, individual
Asset Limits $2,000 (individual), $3,000 (couple).
MA

Requires clinical eligibility determination.

Benefits
Personal care (5-7 hours/day) Respite care (240 hours/year) Adult day care (~$75/day) Home health services

Senior Care Options (SCO)

Massachusetts Senior Care Options

Age 65+
General Massachusetts resident, eligible for MassHealth (Medicare optional), nursing home-level care need.
Income Limits (2025) ~$2,829/month (300% FBR, individual); QIT allowed.
Asset Limits $2,000 (individual), $3,000 (couple) (excludes home up to $713,000, car).
MA

Not available in Dukes/Nantucket Counties; multiple SCO providers (e.g., CCA, Tufts).

Benefits
Personal care (5-7 hours/day) Medical care Respite (240 hours/year) Adult

Medicare Savings Program (MSP)

Massachusetts Medicare Savings Program (MassHealth Buy-In)

Age 65+ or disabled
General Massachusetts resident, Medicare Part A/B.
Income Limits (2025) ~$2,510/month (QMB), ~$3,380/month (SLMB), ~$3,598/month (QI)—individual.
Asset Limits $9,430 (individual), $14,130 (couple).
MA

Three tiers; no waitlist; includes Extra Help for Part D.

Benefits
Covers Part B premiums ($174.70/month) Deductibles ($240/year) Copays (~20%)

National Family Caregiver Support Program (NFCSP) Respite

Massachusetts NFCSP Respite Care

Age
General Caregivers of 60+ needing care or 55+ caregivers of others; Massachusetts resident; functional needs (2+ ADLs).
Income Limits (2025) Prioritizes ~$24,980/year (individual); no strict cap.
Asset Limits Not assessed; need-based.
MA

27 ASAPs; prioritizes low-income, rural caregivers.

Benefits
Respite (4-6 hours/week or 5 days/year) Adult day care ($60/day) Caregiver training Supplies (~$500/year)

Prescription Advantage

Massachusetts Prescription Advantage

Age 65+ or disabled
General Massachusetts resident, enrolled in Medicare Part D (or ineligible for Medicare).
Income Limits (2025) No strict limit; copays vary by income ~$24,980-$75,000/year individual
Asset Limits Not assessed.
MA

Supplements Medicare Part D; no enrollment fee for low-income.

Benefits
Covers prescription copays ($5-$40/drug) Fills coverage gaps Catastrophic cost protection ($4,000+ covered)

VA Aid and Attendance (A&A) and Housebound Benefits

Massachusetts VA Aid and Attendance/Housebound

Age 65+ or disabled veteran/spouse
General Massachusetts resident, wartime service, need for ADL help (A&A) or homebound.
Income Limits (2025) Net income < ~$1,984/month (veteran with dependent, A&A); pension offsets income.
Asset Limits ~$155,356 net worth limit
MA

High veteran demand statewide.

Benefits
Cash (~$1,433-$2,642/month veteran, ~$951-$1,318 spouse) for care costs (e.g., in-home, assisted living)

Compare Nursing Home around Plymouth

The information below is reported by the Massachusetts Executive Office of Elder Affairs and Department of Public Health.

3 facilities compared · CMS & MA Dept. of Health data

Trillium Woods
NH

Nursing Home Licensed facility providing 24/7 skilled nursing care for residents with complex, ongoing medical needs. Staffed by RNs, LPNs, and CNAs. Inspected and star-rated annually by CMS. Accepts Medicare (short-term rehab) and Medicaid (long-term care).

AL

Assisted Living A licensed, long-term care setting for seniors or individuals with disabilities who need help with daily activities — like bathing, dressing, and medication management — but not 24-hour skilled nursing. Offers housing, meals, and around-the-clock support while aiming to maximize resident independence.

IL

Independent Living Lifestyle-focused communities for older adults offering dining, activities, and transportation with minimal personal care. Best for active, independent seniors who want community without medical support.

MC

Memory Care Secured, specialized care for people living with Alzheimer's or dementia. Staff trained in cognitive impairment, with higher staff-to-resident ratios and an environment designed to reduce confusion and wandering risk.

Plymouth (Glacier Vista)
44
Facility 44
MN AVG 61
Rank #276 / 532
72.7%
Facility 72.7%
MN AVG 79.7%
Rank #212 / 328
-9%
6.18
Facility 6.18
MN AVG 4.77
Rank #6 / 85
+8%+30%
$0
Facility $0
MN AVG $47.9k
Rank #1 / 86
4
Facility 4
MN AVG 23.2
Rank #3 / 86
2.0
Facility 2.0
MN AVG 3.8
Rank #6 / 86
-38A+
4
Facility 4
MN AVG 43
Rank #585 / 632
Lcs Trillium Woods Jv LLC
$24.7M
Facility $24.7M
MN AVG $9.9M
Rank #13 / 85
$8.9M
Facility $8.9M
MN AVG $4.9M
Rank #30 / 85
36%
Facility 36%
MN AVG 50.7%
Rank #81 / 85
245627
Interlude Restorative Suites
NH

Nursing Home Licensed facility providing 24/7 skilled nursing care for residents with complex, ongoing medical needs. Staffed by RNs, LPNs, and CNAs. Inspected and star-rated annually by CMS. Accepts Medicare (short-term rehab) and Medicaid (long-term care).

Plymouth (Campus Drive)
50
Facility 50
MN AVG 61
Rank #259 / 532
83.1%
Facility 83.1%
MN AVG 79.7%
Rank #130 / 328
+4%
5.01
Facility 5.01
MN AVG 4.77
Rank #27 / 85
+45%+5%
$0
Facility $0
MN AVG $47.9k
Rank #43 / 86
19
Facility 19
MN AVG 23.2
Rank #32 / 86
3.2
Facility 3.2
MN AVG 3.8
Rank #29 / 86
248-
34
Facility 34
MN AVG 43
Rank #376 / 632
Allina Health System
$14.6M
Facility $14.6M
MN AVG $9.9M
Rank #35 / 85
$8.9M
Facility $8.9M
MN AVG $4.9M
Rank #31 / 85
60.8%
Facility 60.8%
MN AVG 50.7%
Rank #33 / 85
245624
Mission Nursing Home
NH

Nursing Home Licensed facility providing 24/7 skilled nursing care for residents with complex, ongoing medical needs. Staffed by RNs, LPNs, and CNAs. Inspected and star-rated annually by CMS. Accepts Medicare (short-term rehab) and Medicaid (long-term care).

Plymouth (Mission Farms)
70
Facility 70
MN AVG 61
Rank #197 / 532
83.8%
Facility 83.8%
MN AVG 79.7%
Rank #122 / 328
+5%
4.91
Facility 4.91
MN AVG 4.77
Rank #31 / 85
+52%+3%
$0
Facility $0
MN AVG $47.9k
Rank #1 / 86
27
Facility 27
MN AVG 23.2
Rank #47 / 86
3.9
Facility 3.9
MN AVG 3.8
Rank #44 / 86
159-
6
Facility 6
MN AVG 43
Rank #578 / 632
Missions, Inc Programs
$8.8M
Facility $8.8M
MN AVG $9.9M
Rank #61 / 85
$5.7M
Facility $5.7M
MN AVG $4.9M
Rank #52 / 85
64.9%
Facility 64.9%
MN AVG 50.7%
Rank #18 / 85
245546

Frequently Asked Questions about Trillium Woods

What neighborhood is Trillium Woods in?

Trillium Woods is in the Glacier Vista neighborhood of Plymouth.

Is Trillium Woods in a walkable area?

Trillium Woods has a walk score of 4. Car-dependent. Most errands require a car, with limited nearby walkable options.

What is the occupancy rate at Trillium Woods?

Trillium Woods's occupancy is 87.2%.

Are there photos of Trillium Woods?

Yes — there are 9 photos of Trillium Woods in the photo gallery on this page.

What is the phone number of Trillium Woods?

(952) 474-1700 will put you in contact with the team at Trillium Woods.

Is Trillium Woods Medicare or Medicaid certified?

Yes — Trillium Woods is a CMS-certified provider of Medicare and Medicaid.

Guides for Better Senior Living

Care Cost Calculator: See Prices in Your Area

Nursing Home Data Explorer

Don’t Wait Too Long: 7 Red Flag Signs Your Parent Needs Assisted Living Now

The True Cost of Assisted Living in 2025 – And How Families Are Paying For It

Understanding Senior Living Costs: Pricing Models, Discounts & Financial Assistance

Explore Open Rooms
1 Contact details
2 What type of senior care service are you looking for?
3 What budget do you have in mind for senior care?
4 How soon do you need to find care?
5 Additional details

Thank you for your interest!

Our team will be in touch shortly to help with next steps.