


Total staff
143
Employees
139
Contractors
4
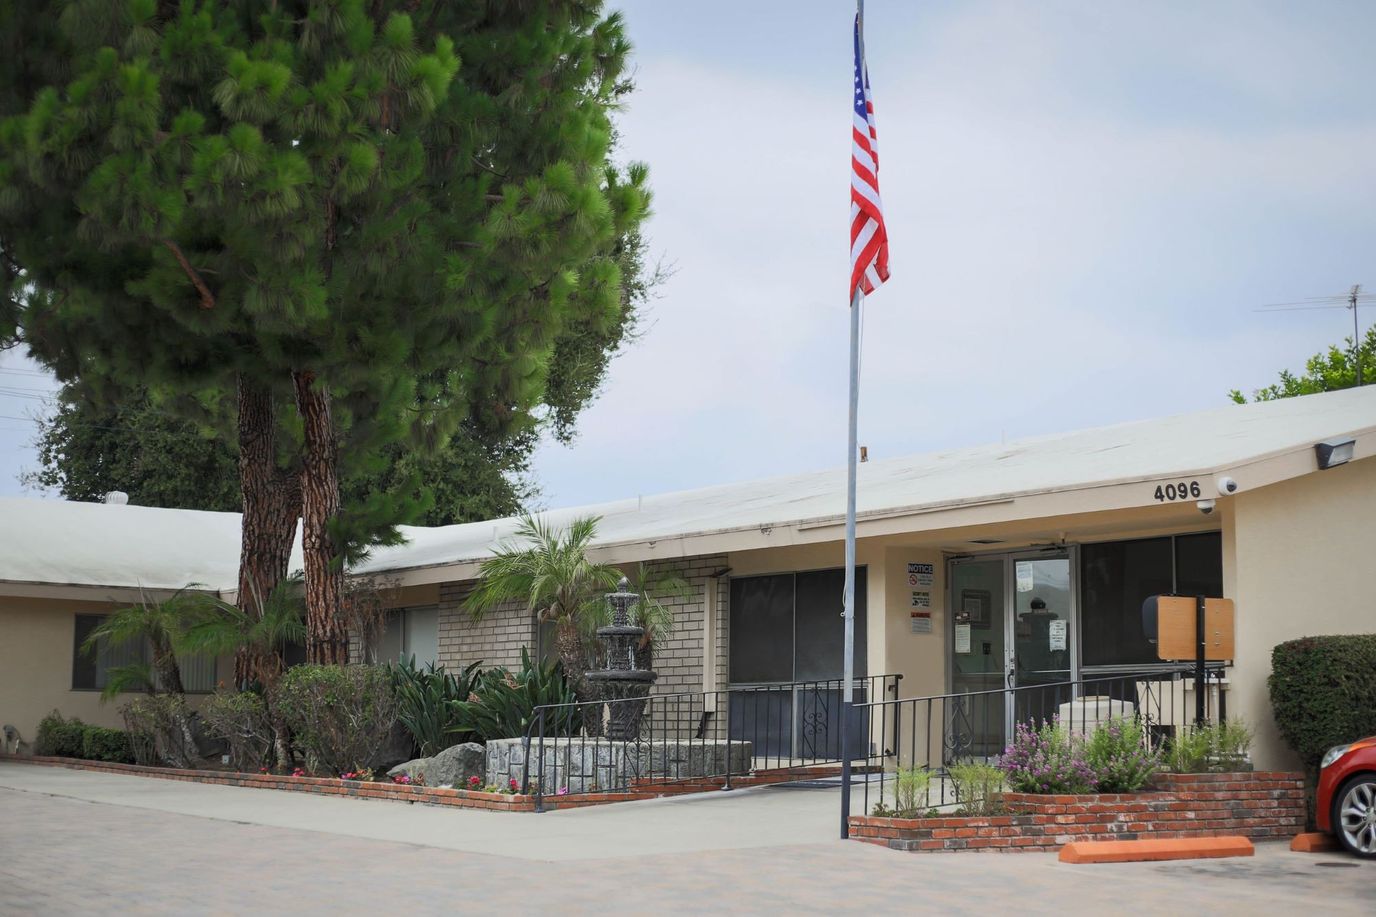

Nestled in El Monte, California, El Monte Convalescent Hospital is a compassionate, family-owned, and operated establishment that provides senior citizens with nursing, hospice programs, and healthcare services. This facility, boasting 93 beds, is dedicated to delivering skilled medical care 24/7 within a comfortable environment. Embracing diversity, El Monte Convalescent Hospital provides services without regard to religion, sexual orientation, or national origin.
Actively engaged, El Monte Convalescent Hospital offers a comprehensive range of services, including Physical Therapy, Occupational Therapy, Speech Therapy, a Wound Care Program, 24-hour RN Nursing Care, and a Hospice Program. Their multi-lingual staff, proficient in Spanish, Chinese, and Tagalog, ensures effective communication and understanding, fostering an environment where every resident receives personalized and culturally sensitive care. With a commitment to inclusivity, the facility maintains an open-door policy, encouraging family participation to achieve their goal of delivering the highest quality, compassionate healthcare to the communities they serve.
| Staff type | Hours / Day / Resident | vs state avg |
|---|---|---|
|
Registered Nurse (RN)
| 22m per day | ▼ 44% State avg: 39m per day · National avg: 41m per day |
|
LPN / LVN
| 1h 2m per day | ▼ 15% State avg: 1h 13m per day · National avg: 52m per day |
|
Nurse Aide
| 2h 48m per day | ▲ 6% State avg: 2h 39m per day · National avg: 2h 21m per day |
|
Weekend Total Nursing
| 3h 42m per day | ▼ 10% State avg: 4h 5m per day · National avg: 3h 26m per day |
|
Physical Therapist
| 6m per day | ▲ 14% State avg: 5m per day · National avg: 4m per day |
|
Weekend RN
| 16m per day | ▼ 48% State avg: 30m per day · National avg: 29m per day |
Reporting period: October 1 – December 31, 2025 (Q4 2025). Source: CMS Payroll-Based Journal report.
State average ratio: 0 : 0
State average: 0 hours
Manages medical care and health needs.
Assists with medical care and medications.
Helps with daily care and mobility.
Total hours from contractors
293 contractor hours this quarter
| Certified Nursing Assistant | 76 | 0 | 76 | 24,289 | 92 | 100% | 7.6 |
| Licensed Practical Nurse | 26 | 0 | 26 | 7,797 | 92 | 100% | 7.8 |
| Registered Nurse | 7 | 0 | 7 | 2,555 | 92 | 100% | 7.9 |
| Physical Therapy Aide | 4 | 0 | 4 | 1,631 | 79 | 86% | 7.1 |
| Other Dietary Services Staff | 3 | 0 | 3 | 1,223 | 92 | 100% | 8 |
| Administrator | 3 | 0 | 3 | 1,181 | 69 | 75% | 8.2 |
| RN Director of Nursing | 2 | 1 | 3 | 1,108 | 71 | 77% | 8 |
| Speech Language Pathologist | 3 | 0 | 3 | 1,068 | 80 | 87% | 7.2 |
| Dental Services Staff | 2 | 0 | 2 | 989 | 68 | 74% | 7.7 |
| Respiratory Therapy Technician | 3 | 0 | 3 | 821 | 87 | 95% | 6.3 |
| Physical Therapy Assistant | 4 | 0 | 4 | 626 | 87 | 95% | 5.7 |
| Dietitian | 1 | 0 | 1 | 545 | 66 | 72% | 8.3 |
| Nurse Practitioner | 1 | 0 | 1 | 512 | 64 | 70% | 8 |
| Qualified Social Worker | 2 | 0 | 2 | 401 | 60 | 65% | 6.7 |
| Physical Therapist | 1 | 0 | 1 | 330 | 53 | 58% | 6.2 |
| Occupational Therapy Aide | 1 | 1 | 2 | 239 | 30 | 33% | 7.4 |
| Clinical Nurse Specialist | 0 | 1 | 1 | 65 | 11 | 12% | 5.9 |
| Medical Director | 0 | 1 | 1 | 15 | 3 | 3% | 5 |
Includes penalties issued in 2024
Federal penalties imposed by CMS for regulatory violations, including civil money penalties (fines) and denials of payment for new Medicare/Medicaid admissions.
Source: CMS Penalties Database (Data as of Jan 2026)
State average: $55K
State average: 2.4
State average: 0.5
Penalties are imposed by CMS for violations of federal nursing home regulations.
1 penalty in the past 3 years
Aug 5, 2024 · $9K
Last updated: Jan 2026
These measures show how residents usually do over time at this home, based on health outcomes and preventive care.
State average: 6.6
State average: 11.3
State average: 11.1%
State average: 12.0%
State average: 11.3%
State average: 1.7%
State average: 5.0%
State average: 1.2%
State average: 4.2%
State average: 6.7%
State average: 10.1%
State average: 98.5%
State average: 98.2%
State average: 2.25
State average: 1.59
State average: 94.0%
State average: 1.5%
State average: 93.2%
State average: 23.2%
State average: 11.2%
State average: 0.8%
State average: 53.7%
State average: 50.6%
Quality measures are calculated from Minimum Data Set (MDS) assessments. For most measures, lower percentages indicate better care quality.
14% of new residents, usually for short-term rehab.
19% of new residents, often for short stays.
67% of new residents, often for long-term daily care.
Source: CMS Long-Term Care Facility Characteristics (Data as of Jan 2026)
Residents meet regularly to discuss policies, care quality, and activities
Organized group of residents that meets regularly to discuss facility policies, quality of life, and activities.
Data sourced from CMS Long-Term Care Facility Characteristics quarterly report. Payer mix reflects the current resident census by primary payment source.
Historical financial and operational data for El Monte Convalescent Hospital from 2011–2022, based on CMS SNF Cost Reports.
Key figures below are for fiscal year ending in 04/2022 — the home's most recent complete cost report, an older period than most facilities report.
Based on the home's most recent complete CMS SNF Cost Report — fiscal year ending in 04/2022. This is an older period than most facilities report, so compare with that in mind.
Most residents stay for extended periods and receive ongoing daily care.
Most new residents arrive under Medicaid (67% of admissions), and a typical Medicaid stay runs around 9 - 10 months.
Coverage residents most often arrive under.
Coverage residents most often leave under.
![]() 2.4 miles from city center
2.4 miles from city center
![]() Estimated distance in miles from El Monte's city center to El Monte Convalescent Hospital's address, calculated via Google Maps.
— 3.65 miles to nearest hospital (Garfield Medical Center)
Estimated distance in miles from El Monte's city center to El Monte Convalescent Hospital's address, calculated via Google Maps.
— 3.65 miles to nearest hospital (Garfield Medical Center)
Add your location
The information below is reported by the California Department of Social Services and Department of Public Health.
| The Reutlinger Community | NH AL IL MC SNF | Danville | - | 120 | A+ | 30 | Studio / 1 Bed |
| OakView Health Center | NH AL MC SNF | Thousand Oaks (Mountclef Village) | - | 63 | A+ | 20 | Private / Semi-Private Rooms |
| Harrison Villa of Mt. San Antonio Gardens | NH AL IL MC SNF | Pomona | - | 520 | - | 45 | Studio |
| O‘Connor Woods | NH AL IL MC RC SNF | Stockton (Sherwood Manor) | - | 499 | - | 22 | Studio / 1 Bed / 2 Bed |
| El Monte Convalescent Hospital | NH AL HOS IL | El Monte | - | 99 | - | 56 | - |
El Monte Convalescent Hospital has a walk score of 56. Moderately walkable. Some errands can be accomplished on foot, with a mix of nearby amenities.
El Monte Convalescent Hospital's occupancy is 65.2%.
El Monte Convalescent Hospital is registered as a for-profit.
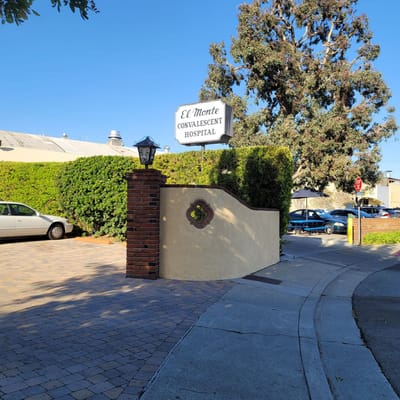
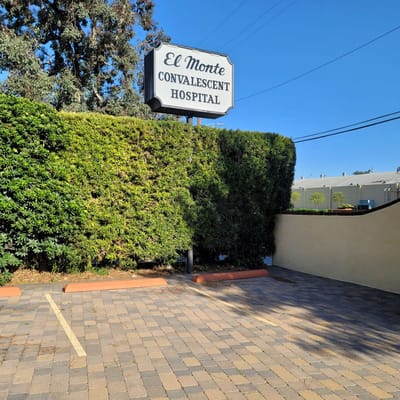
Yes — there are 4 photos of El Monte Convalescent Hospital in the photo gallery on this page.
El Monte Convalescent Hospital is located at 4096 Easy St, El Monte, CA 91731.
(626) 443-1351 will put you in contact with the team at El Monte Convalescent Hospital.
Yes — El Monte Convalescent Hospital is a CMS-certified provider of Medicare and Medicaid.
Care Cost Calculator: See Prices in Your Area
Nursing Home Data Explorer
Don’t Wait Too Long: 7 Red Flag Signs Your Parent Needs Assisted Living Now
The True Cost of Assisted Living in 2025 – And How Families Are Paying For It
Understanding Senior Living Costs: Pricing Models, Discounts & Financial Assistance


