O‘Connor Woods
Nursing Home, Assisted Living, Independent Living, Memory Care & Respite Care · Stockton, CA
CMS overall rating Info CMS (the Centers for Medicare & Medicaid Services) is the federal agency that rates nursing home quality. Its Overall Rating runs from 1 to 5 stars, combining health inspections, staffing, and quality measures, with inspections weighted most heavily.

O‘Connor Woods

Nursing Home, Assisted Living, Independent Living, Memory Care & Respite Care · Stockton, CA
CMS overall rating Info CMS (the Centers for Medicare & Medicaid Services) is the federal agency that rates nursing home quality. Its Overall Rating runs from 1 to 5 stars, combining health inspections, staffing, and quality measures, with inspections weighted most heavily.
Calculator: See prices in your area
O‘Connor Woods accepts Medicare, Medicaid, and private pay.

Overview of O‘connor Woods

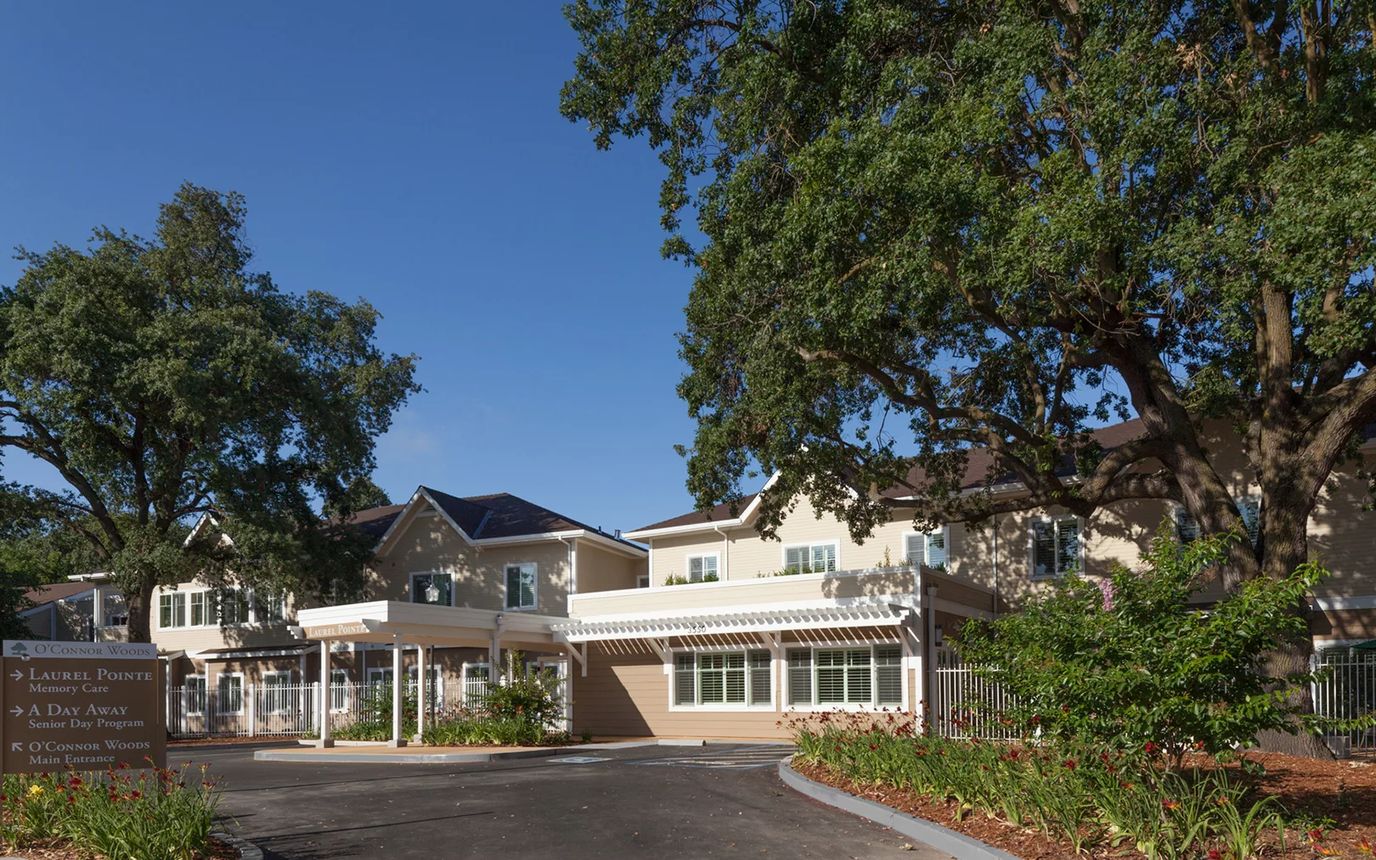
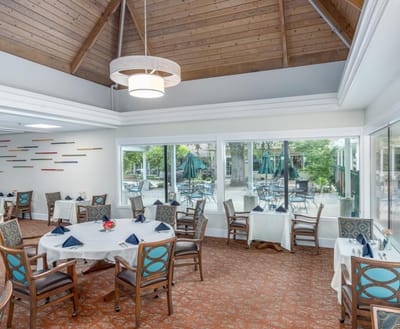
Situated in the vibrant Stockton, CA, O’Connor Woods provides a safe and supportive environment where independence and personal choice are celebrated. Their mission centers on providing holistic care that enriches the lives of residents, addressing their diverse needs and preferences through independent living and assisted living. Compassion, respect, and dignity guide their approach to senior living, ensuring everyone feels valued and supported.

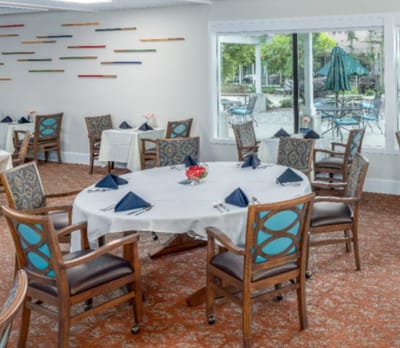
O’Connor Woods boasts resort-style amenities, including restaurant-style dining with locally sourced cuisine and social engagement opportunities. With pet-friendly residences and 24-hour staffing, residents enjoy a maintenance-free lifestyle while receiving constant support. The community offers innovative educational, cultural, and social programs alongside spiritual care options, promoting overall well-being. Additionally, top-notch exercise classes and personalized assistance with daily activities ensure residents lead fulfilling lives tailored to their unique needs and desires through excellent assisted living.

(209) 956-3400

Quality ratings

Measured by Centers for Medicare & Medicaid Services (CMS)

Overall rating Info The Overall CMS Rating combines results from health inspections, staffing levels and quality measures. Health inspections carry the most weight. Staffing and quality scores can increase or decrease the final rating based on performance compared to state and national standards.
▲ 58.8% Above CA avg. ▲ 58.8% Above CA avg.CA average: 3.1Click the badge to see the full State ranking.Click here to see the full State ranking.
Health Inspection Info Based on the results of the facility's three most recent standard inspections and any complaint investigations. CMS reviews the number, scope, and severity of deficiencies, with more recent findings weighted more heavily.
▲ 43.0% Above CA avg. ▲ 43.0% Above CA avg.CA average: 2.8Click the badge to see the full State ranking.Click here to see the full State ranking.
Staffing Info Measures average nursing staff hours per resident per day, including Registered Nurses (RNs) and total nursing staff. Ratings are adjusted based on the level of care residents require and are compared to state and national benchmarks.
▲ 59.3% Above CA avg. ▲ 59.3% Above CA avg.CA average: 3.1Click the badge to see the full State ranking.Click here to see the full State ranking.
Quality Measures Info Based on clinical and physical health indicators reported to CMS, such as hospital readmissions, falls, pressure ulcers, and improvements in mobility. These measures reflect how well residents' health needs are being managed.
▼ 2.1% Below CA avg. ▼ 2.1% Below CA avg.CA average: 4.1Click the badge to see the full State ranking.Click here to see the full State ranking.

Staffing hours breakdown

Info Daily nursing hours per resident by staff type, reported to CMS. Higher is generally better — compare this facility to state and national averages to see where staffing stands.

Hours per resident per day — compared to California state averages

Total nursing care / resident Info This home is ranked 69th out of 354 homes in California for nurse hours. Total adjusted nursing hours per resident per day, combining RN, LPN, and aide time. CMS adjusts this for case-mix so facilities can be fairly compared.
4h 42m per day
Rank #69 / 354Nurse hours — State benchmarkedThis home is ranked 69th out of 354 homes in California. Shows adjusted nurse hours per resident per day benchmarked to the California average, with a ranking across 354 California facilities. More hours mean more direct care. The national average is about 3.5 hrs; below 3.0 is a red flag.Rankings are based only on facilities in California that report data for that category. Facilities without available data are excluded from the ranking.Click the rank badge to see the full State ranking.Click here to see the full State ranking.
This facility California avg (4h 13m per day)
vs California avg
+11%

2 of 6 metrics below state avg

Standout metric Registered Nurse (RN) is +35% above state avg
Staff typeHours / Day / Residentvs state avg
Registered Nurse (RN) Info RNs hold the highest nursing license and can assess residents, interpret test results, and direct care plans. More RN hours per day often signals stronger clinical oversight and faster response to health changes. 55m per day ▲ 35% State avg: 40m per day · National avg: 41m per day
LPN / LVN Info Licensed Practical Nurses (LPNs) or Licensed Vocational Nurses (LVNs) deliver routine hands-on care — medication administration, wound dressing, and monitoring vital signs. They work under RN supervision and make up a large share of daily bedside care. 1h 34m per day ▲ 30% State avg: 1h 12m per day · National avg: 52m per day
Nurse Aide Info Certified Nurse Aides (CNAs) provide the most direct day-to-day assistance: bathing, dressing, feeding, and mobility. Nurse aide hours are typically the largest staffing category and directly affect residents' quality of life. 3h 9m per day ▲ 19% State avg: 2h 39m per day · National avg: 2h 20m per day
Weekend Total Nursing Info Combined nursing hours (RN + LPN + Nurse Aide) per resident per day on weekends. Staffing often drops on weekends — this figure reveals whether the facility maintains adequate coverage outside of weekday hours. 4h 52m per day ▲ 19% State avg: 4h 5m per day · National avg: 3h 27m per day
Physical Therapist Info Hours per resident per day provided by licensed Physical Therapists (PTs) or PT Assistants. PT services help residents recover mobility after injury or illness and are especially important for post-acute (short-stay) rehabilitation. 4m per day ▼ 35% State avg: 6m per day · National avg: 4m per day
Weekend RN Info Registered nurse hours specifically on weekends. Facilities sometimes reduce RN presence on Saturdays and Sundays — a low weekend RN figure compared to weekday hours can indicate reduced clinical oversight when most administrative staff are absent. 29m per day ▼ 7% State avg: 31m per day · National avg: 29m per day

Capacity and availability

This home usually has availability

Lower occupancy than the California average: 84.7%
Occupancy rate
73.4% Rank #863 / 1537Occupancy rate — State benchmarkedThis home is ranked 863rd out of 1537 homes in California. Shows this facility's occupancy rate versus the California average, with its Statewide rank out of 1537. Higher occupancy signals strong local demand and financial stability.Rankings are based only on facilities in California that report data for that category. Facilities without available data are excluded from the ranking.Click the rank badge to see the full State ranking.Click here to see the full State ranking.
Avg. Length of Stay
56 days
Bed community size
499-bed community Rank #23 / 1657Bed count — State benchmarkedThis home is ranked 23rd out of 1657 homes in California. Shows this facility's certified or reported bed count compared to other California facilities. Larger communities may offer more amenities, programs, and on-site services for residents and families.Rankings are based only on facilities in California that report data for that category. Facilities without available data are excluded from the ranking.Click the rank badge to see the full State ranking.Click here to see the full State ranking.
A large-scale community that may provide a wide range of amenities, services, and structured programs.
Years in operation
34 years in operation Rank #81 / 1487Years in operation — State benchmarkedThis home is ranked 81st out of 1487 homes in California. Shows how long this facility has been in operation compared to other California facilities. Longer operating histories may benefit residents, families, and staff.Rankings are based only on facilities in California that report data for that category. Facilities without available data are excluded from the ranking.Click the rank badge to see the full State ranking.Click here to see the full State ranking.
A longer operating history, which may indicate experience navigating regulations and delivering ongoing care.
Walk Score
Walk Score: 22 / 100 Rank #1826 / 2092Walk Score — State benchmarkedThis home is ranked 1826th out of 2092 homes in California. Shows how walkable this facility's neighborhood is compared to the average Walk Score across California facilities. Higher scores benefit residents, families, and staff.Rankings are based only on facilities in California that report data for that category. Facilities without available data are excluded from the ranking.Click the rank badge to see the full State ranking.Click here to see the full State ranking.
Car-dependent. Most errands require a car, with limited nearby walkable options.

About this community

License Details

Facility TypeRcfe-continuing Care Retirement Community
StatusLicensed
IssuanceAugust 14, 1991
CountySan Joaquin
RCFE Number390314809

Ownership & Operating Entity

O‘Connor Woods is legally operated by O'connor Woods Housing, and administered by Penny Leal-Mallete.

Therapy & Rehabilitation

2 services
Rehabilitation Services
Respite Care

Amenities & Lifestyle

Specific ProgramsA Day Away

Contact O‘Connor Woods

Inspection History

In California, the Department of Social Services (for assisted living facilities) and the Department of Public Health (for nursing homes) conduct inspections to ensure resident safety and regulatory compliance.

Inspection Score Info A composite 0–100 score combining this facility's inspections, citations, complaints, and enforcement actions relative to the California state average. The score below shows how many points this facility sits above or below the typical California nursing home score (the benchmark); higher is better.

13 points above the California average for nursing homes (81/100)

Rank #185 / 1401 in California Inspection Score — State benchmarked This home is ranked 185th out of 1401 homes in California. Shows this facility's inspection score compared to the California average among 1401 comparable communities in the ranking pool. Rankings are based only on facilities in California that report data for that category. Facilities without available data are excluded from the ranking. Inspection score: 94 out of 100. Letter grade A. 13 points above the California average for nursing homes (81/100)

Inspection Scorecard Info This scorecard compares key inspection, citation, and complaint metrics at this facility against the California state average. Metrics rated ≥15% worse than average are highlighted in red; those ≥15% better are highlighted in green.

Since 2020 vs. California state average
Overall vs. CA average 1 Worse Metrics worse than California average:
• Official inspections (25% above)
9 Better Metrics better than California average:
• Total citations (90% below)
• Serious citations (Type A) (100% below)
• Moderate citations (Type B) (75% below)
• Citations per year (88% below)
• Citations per inspection (97% below)
• Total visits (19% below)
• Complaint visits (85% below)
• Other visits (14% below)
• Complaint investigations (80% below)
Latest Inspection September 12, 2025

Citations Info Citations are formal regulatory issues recorded during state inspections.

This FacilityCA Averagevs. CA Avg
Total citations Info Formal regulatory issues recorded by inspectors across all inspection types. 110 This facility has 90% fewer total citations than a typical California nursing home (1 vs. CA avg 10).↓ 90% better
Serious citations (Type A) Info Violations that pose an immediate risk to resident health or safety. Type A citations are the most serious and typically require prompt corrective action. 03 This facility has 100% fewer serious citations (type a) than a typical California nursing home (0 vs. CA avg 3).↓ 100% better Rank #1 / 1164 Serious citations (Type A) — State benchmarked This home is ranked 1st out of 1164 homes in California. Shows this facility's # of serious citations compared to the California average among 1164 comparable communities in the ranking pool. Rankings are based only on facilities in California that report data for that category. Facilities without available data are excluded from the ranking.
Moderate citations (Type B) Info Violations that do not pose an immediate risk but still represent a departure from required care or operational standards. 14 This facility has 75% fewer moderate citations (type b) than a typical California nursing home (1 vs. CA avg 4).↓ 75% better
Citations per year Info Average citations per year since 2020. 0.21.7 This facility has 88% fewer citations per year than a typical California nursing home (0.2 vs. CA avg 1.7).↓ 88% better
Citations per inspection Info Average citations per inspection. 0.13.3 This facility has 97% fewer citations per inspection than a typical California nursing home (0.1 vs. CA avg 3.3).↓ 97% better

Inspections & Visits Info State inspections evaluate whether the facility meets health and safety standards.

This FacilityCA Averagevs. CA Avg
Total visits Info Combined count of complaint visits, other regulatory visits, and official scheduled inspections. 1316 This facility has 19% fewer total visits than a typical California nursing home (13 vs. CA avg 16).↓ 19% better
Complaint visits Info On-site visits triggered by formal complaints filed by residents, families, or staff. 213 This facility has 85% fewer complaint visits than a typical California nursing home (2 vs. CA avg 13).↓ 85% better Rank #324 / 1397 Complaint visits — State benchmarked This home is ranked 324th out of 1397 homes in California. Shows this facility's # of complaint visits compared to the California average among 1397 comparable communities in the ranking pool. Rankings are based only on facilities in California that report data for that category. Facilities without available data are excluded from the ranking.
Other visits Info Regulatory visits that are neither routine inspections nor complaint investigations — administrative check-ins, follow-up reviews, licensing-related visits. 67 This facility has 14% fewer other visits than a typical California nursing home (6 vs. CA avg 7).↓ 14% better
Official inspections Info Routine, scheduled inspections conducted by state regulators to evaluate whether the facility meets federal and state standards. 54 This facility has 25% more official inspections than a typical California nursing home (5 vs. CA avg 4).↑ 25% worse
Complaint investigations Info On-site investigations triggered by complaints filed with California regulators. 210 This facility has 80% fewer complaint investigations than a typical California nursing home (2 vs. CA avg 10).↓ 80% better

Health Inspection History

Inspections since 2022
Total health inspections 11

California average 12.5


Last Health inspection on Aug 2025

Total health citations
44 Rank #196 / 361Health citations — State benchmarkedThis home is ranked 196th out of 361 homes in California. Shows this facility's total health deficiency citations benchmarked to the California State average, with a ranking across all 361 CA facilities. Lower citation counts earn a better rank.Rankings are based only on facilities in California that report data for that category. Facilities without available data are excluded from the ranking.Click the rank badge to see the full State ranking.Click here to see the full State ranking.

California average 50.2

Citations per inspection
4 Rank #169 / 361Citations per inspection — State benchmarkedThis home is ranked 169th out of 361 homes in California. Shows average deficiency citations per CMS inspection for this facility versus the California mean across 361 facilities with citation data. Lower is better.Rankings are based only on facilities in California that report data for that category. Facilities without available data are excluded from the ranking.Click the rank badge to see the full State ranking.Click here to see the full State ranking.

California average 4.65


Health citations are formal notices following inspections when they fail to comply with safety and care standards.

30 of 44 citations resulted from standard inspections; and 14 of 44 resulted from complaint investigations.

Breakdown of citation severity (last 4 years)
Critical health citations
0
100% better than California average

California average: 0.4


Serious health citations
0
100% better than California average

California average: 1

0 critical citations California average: 0.4

0 serious citations California average: 1

44 moderate citations California average: 47.2

0 minor citations California average: 1.5
Citations history (last 4 years)
Environmental moderate citation Aug 14, 2025
Corrected

Abuse/Neglect moderate citation Feb 28, 2025
Corrected

Infection Control moderate citation Feb 28, 2025
Corrected

Nutrition moderate citation Feb 28, 2025
Corrected

Staffing Data

Reporting period: October 1 – December 31, 2025 (Q4 2025). Source: CMS Payroll-Based Journal report.

Total staff 111
Employees 93
Contractors 18
Staff to resident ratio 1.66 : 1
9% fewer staff per resident than California average
California average ratio: 1.81 : 1 California average ratio: 1.81 : 1See full California ranking
Avg staff/day 52
Average shift 8.2 hours
6% better than California average
California average: 7.7 hours California average shift: 7.7 hoursSee full California ranking
Total staff hours (quarter) 39,328

Nursing staff breakdown

Q4 2025 · Oct 1 – Dec 31 More info This data comes from the CMS Payroll-Based Journal report covering October 1 – December 31, 2025.
Registered Nurse

Manages medical care and health needs.

RN Staff Info All 14 RN Staff are full-time employees. No contractors work on this role. 14
Average shift length Info Average shift length. Calculated as total hours divided by days worked and average staff per day. 9 hours
Licensed Practical Nurse

Assists with medical care and medications.

LPN Staff Info All 19 LPN Staff are full-time employees. No contractors work on this role. 19
Average shift length Info Average shift length. Calculated as total hours divided by days worked and average staff per day. 8.9 hours
Certified Nursing Assistant

Helps with daily care and mobility.

CNA Staff Info All 48 CNA Staff are full-time employees. No contractors work on this role. 48
Average shift length Info Average shift length. Calculated as total hours divided by days worked and average staff per day. 8.5 hours

Contractor staffing

Q4 2025 · Oct 1 – Dec 31 More info This data comes from the CMS Payroll-Based Journal report covering October 1 – December 31, 2025.

Total hours from contractors

6.8%

2,658 contractor hours this quarter

Physical Therapy Aide: 5 Speech Language Pathologist: 5 Respiratory Therapy Technician: 3 Physical Therapy Assistant: 3 Qualified Social Worker: 2

Staff by category

Q4 2025 · Oct 1 – Dec 31 More info This data comes from the CMS Payroll-Based Journal report covering October 1 – December 31, 2025.
Certified Nursing Assistant4804819,20992100%8.5
Licensed Practical Nurse190199,02492100%8.9
Registered Nurse140143,61692100%9
Clinical Nurse Specialist3031,4127278%8.4
Other Dietary Services Staff2021,01792100%7.8
Speech Language Pathologist0558558188%6.2
Mental Health Service Worker2027826773%7.9
Physical Therapy Aide0557017885%6.2
Administrator1015286672%8
Nurse Practitioner1015286672%8
RN Director of Nursing1015286672%8
Physical Therapy Assistant0334947885%5
Respiratory Therapy Technician0334036672%4.6
Qualified Social Worker0222055964%3.5
Dietitian2022644%6.5
48 Certified Nursing Assistant
% of Days 100%
19 Licensed Practical Nurse
% of Days 100%
14 Registered Nurse
% of Days 100%
3 Clinical Nurse Specialist
% of Days 78%
2 Other Dietary Services Staff
% of Days 100%
5 Speech Language Pathologist
% of Days 88%
2 Mental Health Service Worker
% of Days 73%
5 Physical Therapy Aide
% of Days 85%
1 Administrator
% of Days 72%
1 Nurse Practitioner
% of Days 72%
1 RN Director of Nursing
% of Days 72%
3 Physical Therapy Assistant
% of Days 85%
3 Respiratory Therapy Technician
% of Days 72%
2 Qualified Social Worker
% of Days 64%
2 Dietitian
% of Days 4%

Penalties and fines

Federal penalties imposed by CMS for regulatory violations, including civil money penalties (fines) and denials of payment for new Medicare/Medicaid admissions.

Source: CMS Penalties Database

No penalties in the past 3 years

No civil money penalties or payment denials were reported in the last 3 years.

Quality of care over time

These measures show how residents usually do over time at this home, based on health outcomes and preventive care.

High-risk clinical events score Info A composite score based on pressure ulcers, falls with injury, weight loss, walking ability decline, and activities of daily living decline. 7.1
6% worse than California average

California average: 6.6

Functional decline score Info A composite score based on activities of daily living decline, walking ability decline, and incontinence. 7.9
30% better than California average

California average: 11.3

Long-stay resident measures
Need for Help with Daily Activities Increased Info Percent of long-stay residents whose need for help with daily activities has increased 9.4%
15% better than California average

California average: 11.1%

Walking Ability Worsened Info Percent of long-stay residents whose ability to move independently worsened 9.7%
19% better than California average

California average: 12.0%

Low Risk Residents with Bowel/Bladder Incontinence Info Percent of low risk long-stay residents who lose control of their bowels or bladder 4.6%
60% better than California average

California average: 11.3%

Falls with Major Injury Info Percent of long-stay residents experiencing one or more falls with major injury 1.3%
23% better than California average

California average: 1.7%

High Risk Residents with Pressure Ulcers Info Percent of long-stay high risk residents with pressure ulcers 10.6%
113% worse than California average

California average: 5.0%

Urinary Tract Infection Info Percent of long-stay residents with a urinary tract infection 3.4%
171% worse than California average

California average: 1.2%

Lost Too Much Weight Info Percent of long-stay residents who lose too much weight 4.3%
In line with California average

California average: 4.2%

Depressive Symptoms Info Percent of long-stay residents who have depressive symptoms 0.0%
100% better than California average

California average: 6.7%

Antipsychotic Use Info Percent of long-stay residents who received an antipsychotic medication 3.2%
68% better than California average

California average: 10.1%

Pneumococcal Vaccine Info Percent of long-stay residents assessed and appropriately given the pneumococcal vaccine 100.0%
In line with California average

California average: 98.5%

Influenza Vaccine Info Percent of long-stay residents assessed and appropriately given the seasonal influenza vaccine 90.0%
8% worse than California average

California average: 98.2%

Short-stay resident measures
Pneumococcal Vaccine Info Percent of short-stay residents assessed and appropriately given the pneumococcal vaccine 93.3%
In line with California average

California average: 94.0%

Antipsychotic medication increase Info Percent of short-stay residents who newly received an antipsychotic medication 0.8%
48% better than California average

California average: 1.5%

Influenza Vaccine Info Percent of short-stay residents assessed and appropriately given the seasonal influenza vaccine 87.4%
6% worse than California average

California average: 93.2%

Breakdown by payment type

Medicare

20% of new residents, usually for short-term rehab.

Typical stay 1 - 2 months

Private pay

31% of new residents, often for short stays.

Typical stay 1 - 2 months

Medicaid

49% of new residents, often for long-term daily care.

Typical stay 1 - 2 months

Facility Characteristics

Source: CMS Long-Term Care Facility Characteristics (Data as of Jan 2026)

Total residents 67
Medicare
19
28.4% of residents
Medicaid
27
40.3% of residents
Private pay or other
21
31.3% of residents
Programs & Services
Residents Group

Residents meet regularly to discuss policies, care quality, and activities

Nurse Aide Training

State-approved Nurse Aide Training and Competency Evaluation Program on-site

CCRC

Part of a Continuing Care Retirement Community offering multiple care levels

Active Resident Council

Organized group of residents that meets regularly to discuss facility policies, quality of life, and activities.

Finances and operations

Based on CMS SNF Cost Report for fiscal year ending in 12/2023.

Governmental community
Operated by a subsidized facility district.
Net patient revenue Info Net patient revenue — what the home actually collects for resident care, after contractual allowances, bad debt and discounts are subtracted from its gross charges (CMS cost report, Worksheet G-3). It covers resident care only; money the home earns from other sources is shown separately as "Other income."
$34.5M
Net patient income Info Net patient income: net patient revenue minus the home's total operating expenses. A positive figure means it earns more from resident care than it spends to deliver it; a negative figure means the opposite. It excludes non-operating "other income."
-$5.4M
Governmental community Operated by a subsidized facility district.
Net patient revenue Info Net patient revenue — what the home actually collects for resident care, after contractual allowances, bad debt and discounts are subtracted from its gross charges (CMS cost report, Worksheet G-3). It covers resident care only; money the home earns from other sources is shown separately as "Other income."
$34.5M Rank #26 / 355Revenue — State benchmarkedThis home is ranked 26th out of 355 homes in California. Shows this facility's annual revenue compared to the California average. Higher revenue generally means more resources for staffing and capital — read alongside Payroll %.Rankings are based only on facilities in California that report data for that category. Facilities without available data are excluded from the ranking.Click the rank badge to see the full State ranking.Click here to see the full State ranking.
Net patient income Info Net patient income: net patient revenue minus the home's total operating expenses. A positive figure means it earns more from resident care than it spends to deliver it; a negative figure means the opposite. It excludes non-operating "other income."
-$5.4M
Other income Info Money the home earns outside of resident care — such as investments, grants, rentals and other non-operating sources (CMS cost report, Worksheet G-3). It is tracked separately from net patient revenue: it is not part of that figure, and it is not included in net patient income.
$3.5M
Payroll costs Info Staff salaries plus wage-related costs — benefits such as payroll taxes, health insurance and retirement — from the home's own accounting records (CMS cost report, Worksheet A). Contract or agency labor is counted separately, under other operating costs. Rank #18 / 355Payroll — State benchmarkedThis home is ranked 18th out of 355 homes in California. Shows total annual staff payroll benchmarked to the California average. Higher payroll investment relative to peers often signals better staffing and less reliance on cheaper contract labor.Rankings are based only on facilities in California that report data for that category. Facilities without available data are excluded from the ranking.Click the rank badge to see the full State ranking.Click here to see the full State ranking.
$15.8M 45.7% of net patient revenue Info Payroll as a share of revenue: staff salaries and wage-related benefits divided by net patient revenue. A higher figure means more of each revenue dollar goes to staff pay. Rank #229 / 355Payroll % — State benchmarkedThis home is ranked 229th out of 355 homes in California. Shows payroll as a percentage of revenue versus the California average. Well-run California facilities typically land around 56–67% — the top third Statewide. Below 25% may signal understaffing or heavy agency use — read with Staffing ratings.Rankings are based only on facilities in California that report data for that category. Facilities without available data are excluded from the ranking.Click the rank badge to see the full State ranking.Click here to see the full State ranking.
Other operating costs Info Everything it costs to run the home apart from payroll — food, utilities, supplies, maintenance, contract labor and administration. Calculated as total operating expense minus payroll (staff salaries and wage-related benefits).
$24.1M
Total costs Info The home's total operating expense for the year — all the costs of running it, salaries included (CMS cost report, Worksheet G-3).
$39.9M

What does this home offer?

Pets allowed icon
Pets allowed icon

Pets Allowed

Room sizes icon
Room sizes icon

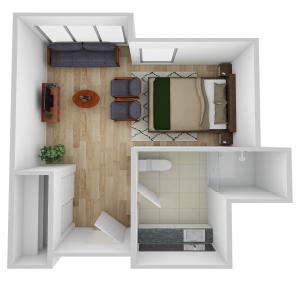
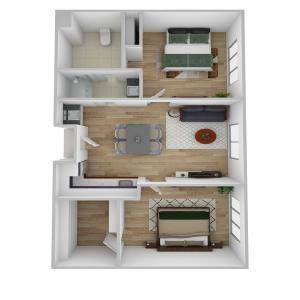
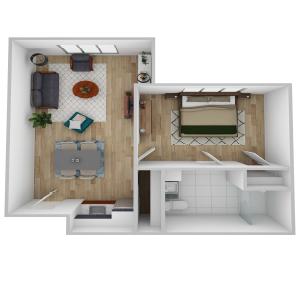
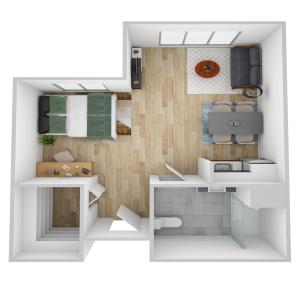
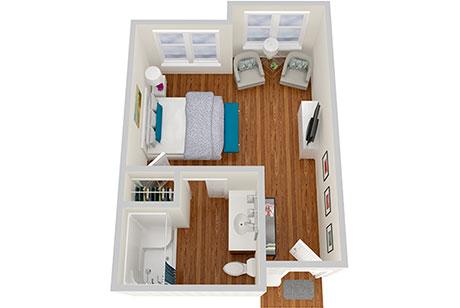
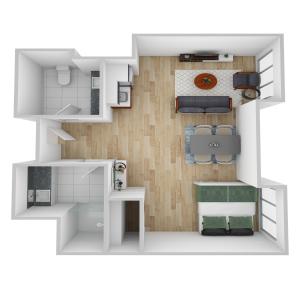
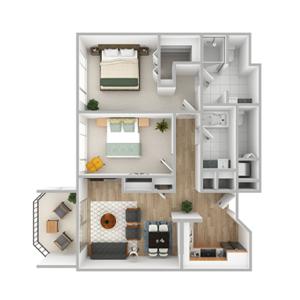
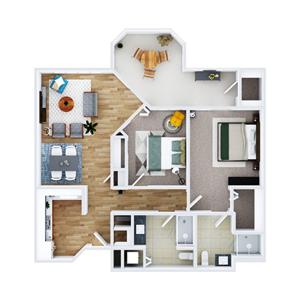
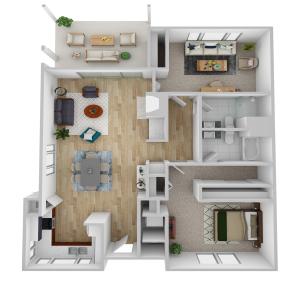
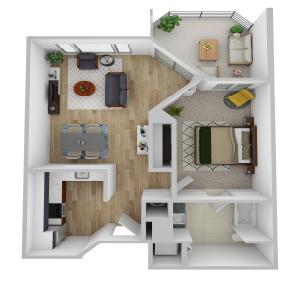
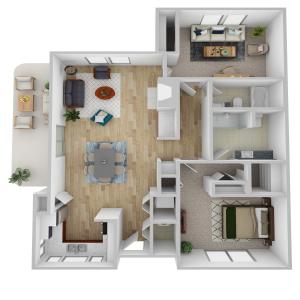
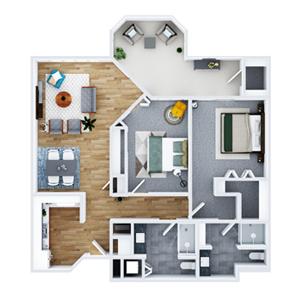
Room Sizes: 276 / 350 / 469 / 528 / 546 / 680 sq. ft

Housing options icon

Housing Options: Studio / 1 Bed / 2 Bed

Building type icon
Building type icon

Building Type: Single-story

Transportation services icon

Transportation Services

Fitness and recreation icon

Fitness and Recreation

Who this home usually serves

TYPE OF STAY

Mostly long-term care residents

Most residents stay for extended periods and receive ongoing daily care.

New residents most often arrive under Medicaid (49% of admissions), and a typical Medicaid stay runs around 1 - 2 months.

Admissions
477 total

Coverage residents most often arrive under.

Medicare 20%
Private pay 31%
Medicaid 49%
Discharges
479 total

Coverage residents most often leave under.

Medicare 42%
Private pay 9%
Medicaid 49%

Living Spaces & Floor Plans for O‘Connor Woods

Oconnor Woods Studio 2
Oconnor Woods 2 Bed
Oconnor Woods 1 Bed
Oconnor Woods Studio
Oconnor Woods Studio Mc
Oconnor Woods Deluxe Studio
Riesling
Riesling
Merlot
Merlot
Cabernet
Cabernet
Chardonnay
Chardonnay
Zinfandel
Zinfandel
Syrah
Syrah

Places of interest near O‘Connor Woods

Address 8.6 miles from city center Info Estimated distance in miles from Stockton's city center to O‘Connor Woods's address, calculated via Google Maps.

Calculate Travel Distance to O‘Connor Woods

Add your location

Address

Compare Nursing Homes around Stockton

The information below is reported by the California Department of Social Services and Department of Public Health.

5 facilities compared · CMS & CA Dept. of Health data

O‘Connor Woods
NH
AL
IL
MC
RC
Stockton (Sherwood Manor)
499
Facility 499
CA AVG 103
Rank #23 / 1657
--
4.69
Facility 4.69
CA AVG 4.22
Rank #69 / 354
+42%+11%
$0
Facility $0
CA AVG $56.5k
Rank #1 / 362
94
Facility 94
CA AVG 81
Rank #185 / 1401
44
Facility 44
CA AVG 50.2
Rank #196 / 361
4.0
Facility 4.0
CA AVG 4.6
Rank #169 / 361
-67-
22
Facility 22
CA AVG 57
Rank #1826 / 2092
O'connor Woods Housing Corp
$34.5M
Facility $34.5M
CA AVG $17.0M
Rank #26 / 355
$15.8M
Facility $15.8M
CA AVG $7.0M
Rank #18 / 355
45.7%
Facility 45.7%
CA AVG 45.2%
Rank #229 / 355
555713
Creekside Center
NH
HC
MC
RC
Stockton (Stonewood)
75
Facility 75
CA AVG 103
Rank #956 / 1657
95.0%
Facility 95.0%
CA AVG 84.7%
Rank #193 / 1537
+12%
3.99
Facility 3.99
CA AVG 4.22
Rank #184 / 354
-55%-5%
$0
Facility $0
CA AVG $56.5k
Rank #1 / 362
-
41
Facility 41
CA AVG 50.2
Rank #176 / 361
2.4
Facility 2.4
CA AVG 4.6
Rank #25 / 361
-72-
65
Facility 65
CA AVG 57
Rank #888 / 2092
-
$12.5M
Facility $12.5M
CA AVG $17.0M
Rank #226 / 355
$5.4M
Facility $5.4M
CA AVG $7.0M
Rank #251 / 355
43%
Facility 43%
CA AVG 45.2%
Rank #219 / 355
555387
Riverwood Healthcare Center
NH
HC
MC
RC
Stockton (Valley Oak)
99
Facility 99
CA AVG 103
Rank #725 / 1657
90.5%
Facility 90.5%
CA AVG 84.7%
Rank #308 / 1537
+7%
4.23
Facility 4.23
CA AVG 4.22
Rank #138 / 354
-10%0%
$52.9k
Facility $52.9k
CA AVG $56.5k
Rank #315 / 362
-
31
Facility 31
CA AVG 50.2
Rank #118 / 361
3.9
Facility 3.9
CA AVG 4.6
Rank #161 / 361
190-
63
Facility 63
CA AVG 57
Rank #951 / 2092
Martin Gittleman
$15.4M
Facility $15.4M
CA AVG $17.0M
Rank #200 / 355
$7.6M
Facility $7.6M
CA AVG $7.0M
Rank #153 / 355
49.2%
Facility 49.2%
CA AVG 45.2%
Rank #84 / 355
555496
Stockton Nursing Center
NH
Stockton (Pacific)
119
Facility 119
CA AVG 103
Rank #597 / 1657
88.2%
Facility 88.2%
CA AVG 84.7%
Rank #372 / 1537
+4%
4.57
Facility 4.57
CA AVG 4.22
Rank #80 / 354
-20%+8%
$83.7k
Facility $83.7k
CA AVG $56.5k
Rank #336 / 362
-
110
Facility 110
CA AVG 50.2
Rank #348 / 361
2.5
Facility 2.5
CA AVG 4.6
Rank #33 / 361
2113-
71
Facility 71
CA AVG 57
Rank #702 / 2092
Stockton Nursing And Rehab Center, LLC
$13.6M
Facility $13.6M
CA AVG $17.0M
Rank #231 / 355
$8.2M
Facility $8.2M
CA AVG $7.0M
Rank #172 / 355
60.5%
Facility 60.5%
CA AVG 45.2%
Rank #44 / 355
55201
Noble Care Center
NH
MC
RC
Stockton (Pacific)
99
Facility 99
CA AVG 103
Rank #725 / 1657
91.9%
Facility 91.9%
CA AVG 84.7%
Rank #269 / 1537
+9%
3.72
Facility 3.72
CA AVG 4.22
Rank #245 / 354
-17%-12%
$0
Facility $0
CA AVG $56.5k
Rank #1 / 362
-
91
Facility 91
CA AVG 50.2
Rank #329 / 361
3.5
Facility 3.5
CA AVG 4.6
Rank #115 / 361
-96A+
55
Facility 55
CA AVG 57
Rank #1215 / 2092
-
$17.7M
Facility $17.7M
CA AVG $17.0M
Rank #252 / 355
$5.7M
Facility $5.7M
CA AVG $7.0M
Rank #270 / 355
32.2%
Facility 32.2%
CA AVG 45.2%
Rank #211 / 355
555105

Financial Assistance for
Nursing Home in California

O‘Connor Woods is located in Stockton, California.
Here are the financial assistance programs available to residents in California.

Get Financial aid guidance

Multipurpose Senior Services Program

MSSP (Medi-Cal Waiver)

Age 65+
General California resident, Medi-Cal eligible, nursing home risk.
Income Limits (2025) ~$2,829/month 300% FBR, individual
Asset Limits $2,000 (individual), $3,000 (couple).
CA

County-managed; waitlists possible.

Benefits
In-home support (4-6 hours/day) Respite care (14 days/year) Meals (~$6/meal) Transportation (8 trips/month) Care management

In-Home Supportive Services (IHSS)

California IHSS

Age 65+
General California resident, Medicaid-eligible or low-income.
Income Limits ~$1,732/month individual, Medi-Cal threshold
Asset Limits $2,000 individual
CA

Can hire family as caregivers.

Benefits
Personal care (up to 283 hours/month) Homemaker services Respite (varies)

Multipurpose Senior Services Program (MSSP)

CA MSSP

Age 65+
General California resident, Medi-Cal-eligible, nursing home-eligible but community-capable.
Income Limits ~$2,829/month 300% FBR, individual
Asset Limits $2,000 individual
CA

Available in 38 counties; waitlists common.

Benefits
Case management Respite care (up to 10 days/year) Minor home mods (avg. $500) Adult day care (~$50/day)

Property Tax Postponement Program (PTP)

CA PTP

Age 62+
General California resident, own and live in home, 40% equity.
Income Limits (2025) ~$51,500/year household, adjusted annually
Asset Limits Equity-based; no strict asset cap.
CA

Deferred taxes accrue interest (5% as of 2024); repaid upon sale/death.

Benefits
Property tax deferral (avg. $1,000-$3,000/year, varies by county)

Assisted Living Waiver (ALW)

CA ALW

Age 65+ or disabled
General California resident, Medi-Cal-eligible, nursing home-eligible.
Income Limits ~$2,829/month 300% FBR, individual
Asset Limits $2,000 individual
CA

Available in 15 counties (e.g., LA, Sacramento); waitlists common.

Benefits
Personal care in ALFs (5-7 hours/day) Medication management Social services

California CARES Program

CA CARES

Age
General Caregivers of California residents 60+ needing help with 3+ daily activities; no caregiver age limit.
Income Limits No strict limit; cost-sharing above ~$2,500/month threshold.
Asset Limits Not applicable; need-based.
CA

High demand in urban areas; complements IHSS respite.

Benefits
Respite care (up to 10 days/year) Counseling (4-6 sessions/year) Training (2-3 workshops/year) Supplies (~$200/year)

Frequently Asked Questions about O‘Connor Woods

What neighborhood is O‘Connor Woods in?

O‘Connor Woods is in the Sherwood Manor neighborhood of Stockton.

Who is the owner of O‘Connor Woods?

The legal owner and operator of O‘Connor Woods is O'connor Woods Housing.

Is O‘Connor Woods in a walkable area?

O‘Connor Woods has a walk score of 22. Car-dependent. Most errands require a car, with limited nearby walkable options.

What is the occupancy rate at O‘Connor Woods?

O‘Connor Woods's occupancy is 19%.

Does O‘Connor Woods have different floorplan options?

Yes — see the floorplan options available at O‘Connor Woods on this page.

Who is the administrator of O‘Connor Woods?

Penny Leal-Mallete is the administrator of O‘Connor Woods.

How many beds does O‘Connor Woods have?

O‘Connor Woods has 499 beds.

Guides for Better Senior Living

Care Cost Calculator: See Prices in Your Area

Nursing Home Data Explorer

Don’t Wait Too Long: 7 Red Flag Signs Your Parent Needs Assisted Living Now

The True Cost of Assisted Living in 2025 – And How Families Are Paying For It

Understanding Senior Living Costs: Pricing Models, Discounts & Financial Assistance