The Green House Cottages of Homewood
Nursing Home, Hospice Care, Memory Care, Palliative Care, Respite Care & Skilled Nursing · Mena, AR
CMS overall rating Info CMS (the Centers for Medicare & Medicaid Services) is the federal agency that rates nursing home quality. Its Overall Rating runs from 1 to 5 stars, combining health inspections, staffing, and quality measures, with inspections weighted most heavily.

The Green House Cottages of Homewood

Nursing Home, Hospice Care, Memory Care, Palliative Care, Respite Care & Skilled Nursing · Mena, AR
CMS overall rating Info CMS (the Centers for Medicare & Medicaid Services) is the federal agency that rates nursing home quality. Its Overall Rating runs from 1 to 5 stars, combining health inspections, staffing, and quality measures, with inspections weighted most heavily.
Calculator: See prices in your area
The Green House Cottages of Homewood accepts Medicare, Medicaid, and private pay.

Overview of The Green House Cottages of Homewood

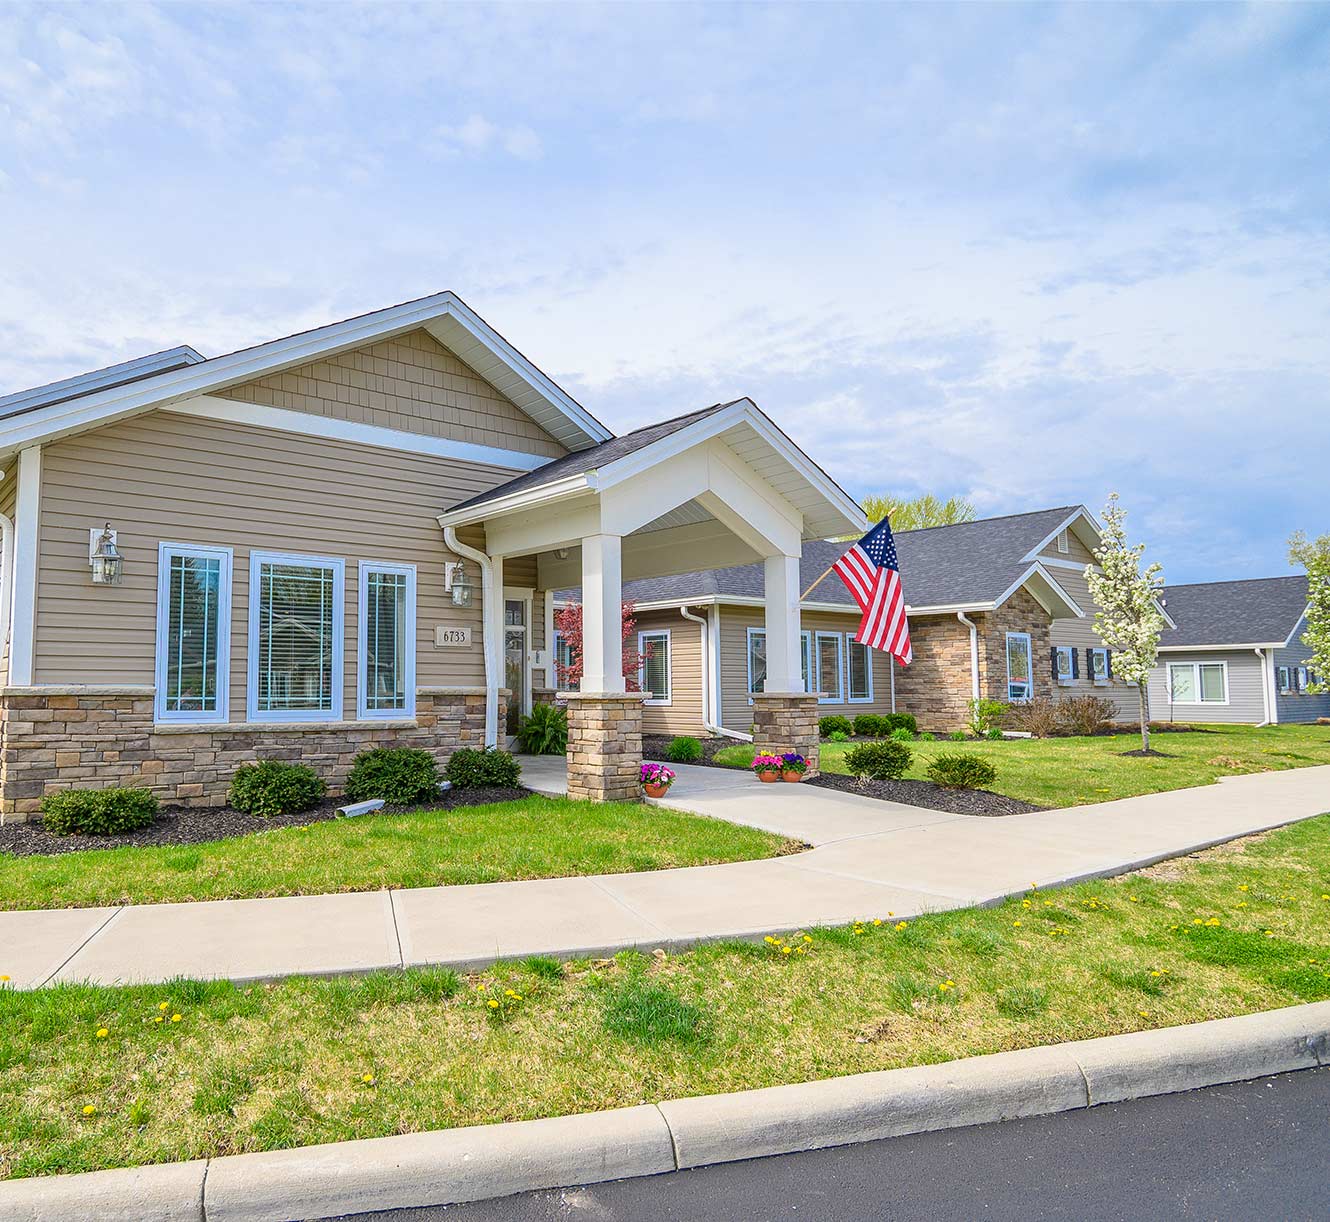
The Green House Cottages of Homewood is a 138-bed skilled nursing and rehabilitation facility at 215 Homewood Circle in Mena, Arkansas, Polk County. Privately owned and administered by Vicki Hughes through Mena SNF Operations, LLC, the facility holds dual Medicare and Medicaid certification and accepts private pay. Current occupancy is 62.6 percent, below the Arkansas average of 71.3 percent, ranking 111th of 166 and suggesting availability. The facility’s signature is affiliated with The Green House Project, a nationally recognized culture-change model now operating as AgingIN, which restructures nursing home care around person-directed, relationship-rich environments. It incorporates comprehensive dementia education and training into its care philosophy, setting apart Green House Cottages from conventional skilled nursing facilities in the region.

The inspection record spans three standard surveys: December 2022, February 2024, and February 2025, totaling 20 citations. All 20 were moderate in severity. No critical or serious citations were issued, and all have been corrected. No complaint investigations, fines, or immediate jeopardy findings appear in the record. The leading deficiency categories over the seven-year window are Quality of Life & Care (4 deficiencies), Infection Control (3), Resident Rights (2), and Pharmacy Services (2). The February 2024 survey cited Administration, Infection Control, and Nursing Services, while the February 2025 survey cited Infection Control only, a contained pattern with no escalation in severity. CMS place the facility solidly above the Arkansas average across every measured dimension. The overall rating exceeds the state benchmark by 27 percent, with health inspection performance running 38.9 percent above average, staffing 23.1 percent above, and quality measures 8.1 percent above, earning the facility 4 stars from CMS.

Adjusted total nursing hours reach 5 hours 10 minutes per resident per day, ranking 25th among 164 Arkansas SNFs. The staffing model leans heavily on licensed practical nurses at 1 hour 24 minutes per day, LPN hours at 47 percent, above the state average, and certified nursing assistant hours at 3 hours 19 minutes per day, running 22 percent above state. Weekend nursing coverage of 4 hours 29 minutes per day is 29 percent above the Arkansas average, an indicator that staffing levels reach weekends. RN hours, 23 minutes per day, are modestly below the state average of 24 minutes, worth noting for residents with complex clinical needs. Q2 2025 payroll data shows 147 total staff, including 80 CNAs, 22 LPNs, and 6 RNs, with only 5 percent of total hours coming from contractors. The facility primarily serves short-stay rehabilitation residents: 48 percent of admissions are Medicare-funded with typical stays of one to two months, and 44 percent are private-pay with stays of two to three months. Long-term Medicaid residents account for 9 percent of admissions. Annual revenue is $12.3 million with a $1.3 million profit, while payroll costs of $5.4 million amount to 44.2 percent of revenue.

Green House Cottages of Homewood suits individuals recovering from surgery, illness, or a hospital stay who want above-average staffing, a clean severity record, and a care model built on dignity and personal connection. It’s also a strong option for families seeking memory-care-informed skilled nursing in rural southwest Arkansas near Mena.

Quality ratings

Measured by Centers for Medicare & Medicaid Services (CMS)

Overall rating Info The Overall CMS Rating combines results from health inspections, staffing levels and quality measures. Health inspections carry the most weight. Staffing and quality scores can increase or decrease the final rating based on performance compared to state and national standards.
Health Inspection Info Based on the results of the facility's three most recent standard inspections and any complaint investigations. CMS reviews the number, scope, and severity of deficiencies, with more recent findings weighted more heavily.
Staffing Info Measures average nursing staff hours per resident per day, including Registered Nurses (RNs) and total nursing staff. Ratings are adjusted based on the level of care residents require and are compared to state and national benchmarks.
Quality Measures Info Based on clinical and physical health indicators reported to CMS, such as hospital readmissions, falls, pressure ulcers, and improvements in mobility. These measures reflect how well residents' health needs are being managed.

Staffing hours breakdown

Info Daily nursing hours per resident by staff type, reported to CMS. Higher is generally better — compare this facility to state and national averages to see where staffing stands.

Hours per resident per day — compared to state averages

Total nursing care / resident Info Total adjusted nursing hours per resident per day, combining RN, LPN, and aide time. CMS adjusts this for case-mix so facilities can be fairly compared.
5h 10m per day
vs avg

2 of 6 metrics below state avg

Standout metric LPN / LVN is +48% above state avg
Staff typeHours / Day / Residentvs state avg
Registered Nurse (RN) Info RNs hold the highest nursing license and can assess residents, interpret test results, and direct care plans. More RN hours per day often signals stronger clinical oversight and faster response to health changes. 24m per day ■ Avg State avg: 24m per day · National avg: 41m per day
LPN / LVN Info Licensed Practical Nurses (LPNs) or Licensed Vocational Nurses (LVNs) deliver routine hands-on care — medication administration, wound dressing, and monitoring vital signs. They work under RN supervision and make up a large share of daily bedside care. 1h 25m per day ▲ 48% State avg: 57m per day · National avg: 52m per day
Nurse Aide Info Certified Nurse Aides (CNAs) provide the most direct day-to-day assistance: bathing, dressing, feeding, and mobility. Nurse aide hours are typically the largest staffing category and directly affect residents' quality of life. 3h 14m per day ▲ 19% State avg: 2h 43m per day · National avg: 2h 20m per day
Weekend Total Nursing Info Combined nursing hours (RN + LPN + Nurse Aide) per resident per day on weekends. Staffing often drops on weekends — this figure reveals whether the facility maintains adequate coverage outside of weekday hours. 4h 28m per day ▲ 28% State avg: 3h 29m per day · National avg: 3h 26m per day
Physical Therapist Info Hours per resident per day provided by licensed Physical Therapists (PTs) or PT Assistants. PT services help residents recover mobility after injury or illness and are especially important for post-acute (short-stay) rehabilitation. 1m per day ▼ 68% State avg: 2m per day · National avg: 4m per day
Weekend RN Info Registered nurse hours specifically on weekends. Facilities sometimes reduce RN presence on Saturdays and Sundays — a low weekend RN figure compared to weekday hours can indicate reduced clinical oversight when most administrative staff are absent. 14m per day ▼ 13% State avg: 16m per day · National avg: 28m per day

Capacity and availability

Avg. Length of Stay Info Average number of days residents stay at this facility, based on CMS cost report data. Shorter stays often reflect post-acute or rehab care; longer stays reflect long-term care.
166 days
Bed community size
138-bed community Rank #37 / 330Bed count — State benchmarkedThis home is ranked 37th out of 330 homes in Arkansas. Shows this facility's certified or reported bed count compared to other Arkansas facilities. Larger communities may offer more amenities, programs, and on-site services for residents and families.Rankings are based only on facilities in Arkansas that report data for that category. Facilities without available data are excluded from the ranking.Click the rank badge to see the full State ranking.Click here to see the full State ranking.
A larger shared setting that may offer more common spaces and organized community services.
Walk Score
Walk Score: 67 / 100 Rank #24 / 419Walk Score — State benchmarkedThis home is ranked 24th out of 419 homes in Arkansas. Shows how walkable this facility's neighborhood is compared to the average Walk Score across Arkansas facilities. Higher scores benefit residents, families, and staff.Rankings are based only on facilities in Arkansas that report data for that category. Facilities without available data are excluded from the ranking.Click the rank badge to see the full State ranking.Click here to see the full State ranking.
Moderately walkable. Some errands can be accomplished on foot, with a mix of nearby amenities.

About this community

Occupancy

Occupancy rate
59%
Lower than the Arkansas average: 71.3%
Occupied beds
82 / 138
Average occupied beds in Arkansas homes 77 beds

License Details

Facility TypeSkilled Nursing Facility With Dual Certified Beds (medicaid/medicare) And Private Beds
CountyPolk
CMS Certification Number045358
Certification TypeMedicaid / Medicare

Ownership & Operating Entity

The Green House Cottages of Homewood is legally operated by Mena SNF Operations, LLC, and administered by T Marquel (Kelly) Parks.

Owner NameMena Snf Operations, LLC
Profit StatusFor-profit

Type Of Units

Medicaid and Medicare
138 units
Total beds
138 units

Contact Information

Fax479-394-3123

Amenities & Lifestyle

Specific ProgramsLeadership + Team Development, Operational Support, Education, Research Partnerships, Calendar of Events, Webinars, Annual Conference, Exhibitor, Workshops + Symposiums, Learning Opportunities

Contact The Green House Cottages of Homewood

Inspection History

In Arkansas, the Department of Human Services, Office of Long Term Care is authorized to conduct unannounced inspections and issue official quality of care reports for all senior living providers.

Since 2022 · 4 years of data 19 deficiencies

Inspection Scorecard Info This scorecard compares key inspection, deficiency, and complaint metrics at this facility against the Arkansas state average. Metrics rated ≥15% worse than average are highlighted in red; those ≥15% better are highlighted in green.

Since 2022 vs. Arkansas state average
Overall vs. AR average 0 Worse No metrics in this bucket. 2 Better Metrics better than Arkansas average:
• Total deficiencies (10% below)
• Deficiencies per year (9% below)
Latest Inspection February 27, 2025 Routine

Deficiencies Info Deficiencies are formal regulatory issues recorded during state inspections.

This FacilityAR Averagevs. AR Avg
Total deficiencies Info Formal regulatory issues recorded by inspectors across all inspection types. 1921 This facility has 10% fewer total deficiencies than a typical Arkansas assisted living residence (19 vs. AR avg 21).↓ 10% better
Deficiencies per year Info Average deficiencies per year since 2022. 4.85.3 This facility has 9% fewer deficiencies per year than a typical Arkansas assisted living residence (4.8 vs. AR avg 5.3).↓ 9% better

Inspection Reports Summary Info An editor-reviewed summary of the themes and findings across this facility's recent inspection reports.

  • February 27, 2025 inspection found one infection control deficiency involving failure to follow Enhanced Barrier Precautions during intravenous catheter care for one resident.
  • February 1, 2024 annual inspection cited 13 deficiencies affecting multiple residents, including resident dignity at meals, care plan accuracy, medication storage, and food safety.
  • December 1, 2022 routine inspection found five deficiencies related to care plan revisions, personal hygiene, range of motion care, and inconsistent infection control practices.

Health Inspection History

Inspections since 2022
Total health inspections 3

State average N/A


Last Health inspection on Feb 2025

Total health citations
20

State average N/A

Citations per inspection
6.67

State average N/A


Health citations are formal notices following inspections when they fail to comply with safety and care standards.

All 20 citations resulted from standard inspections.

Breakdown of citation severity (last 4 years)
Critical health citations
0
In line with State average

State average: N/A


Serious health citations
0
In line with State average

State average: N/A

0 critical citations State average: N/A

0 serious citations State average: N/A

20 moderate citations State average: N/A

0 minor citations State average: N/A
Citations history (last 4 years)
Infection Control moderate citation Feb 27, 2025
Corrected

Administration moderate citation Feb 01, 2024
Corrected

Infection Control moderate citation Feb 01, 2024
Corrected

Nursing Services moderate citation Feb 01, 2024
Corrected

Staffing Data

Reporting period: October 1 – December 31, 2025 (Q4 2025). Source: CMS Payroll-Based Journal report.

Total staff 132
Employees 115
Contractors 17
Staff to resident ratio 1.45 : 1
0% compared with State average

State average ratio: 0 : 0

Avg staff/day 55
Average shift 8.8 hours
0% compared with State average

State average: 0 hours

Total staff hours (quarter) 44,474

Nursing staff breakdown

Q4 2025 · Oct 1 – Dec 31 More info This data comes from the CMS Payroll-Based Journal report covering October 1 – December 31, 2025.
Registered Nurse

Manages medical care and health needs.

RN Staff Info All 3 RN Staff are full-time employees. No contractors work on this role. 3
Average shift length Info Average shift length. Calculated as total hours divided by days worked and average staff per day. 8.7 hours
Licensed Practical Nurse

Assists with medical care and medications.

LPN Staff Info All 25 LPN Staff are full-time employees. No contractors work on this role. 25
Average shift length Info Average shift length. Calculated as total hours divided by days worked and average staff per day. 9.9 hours
Certified Nursing Assistant

Helps with daily care and mobility.

CNA Staff Info All 70 CNA Staff are full-time employees. No contractors work on this role. 70
Average shift length Info Average shift length. Calculated as total hours divided by days worked and average staff per day. 8.8 hours

Contractor staffing

Q4 2025 · Oct 1 – Dec 31 More info This data comes from the CMS Payroll-Based Journal report covering October 1 – December 31, 2025.

Total hours from contractors

4.9%

2,177 contractor hours this quarter

Speech Language Pathologist: 3 Respiratory Therapy Technician: 3 Physical Therapy Assistant: 2 Physical Therapy Aide: 2 Clinical Nurse Specialist: 2 Qualified Social Worker: 2 Medical Director: 1 Occupational Therapy Aide: 1 Occupational Therapy Assistant: 1

Staff by category

Q4 2025 · Oct 1 – Dec 31 More info This data comes from the CMS Payroll-Based Journal report covering October 1 – December 31, 2025.
Certified Nursing Assistant7007025,56292100%8.8
Licensed Practical Nurse2502511,09092100%9.9
Clinical Nurse Specialist3251,5778997%7.8
Registered Nurse3031,1608693%8.7
Nurse Aide in Training6069055054%9.7
Speech Language Pathologist0337297784%5.7
Nurse Practitioner4045596773%7.8
Dietitian1015226267%8.4
Dental Services Staff1014936267%8
RN Director of Nursing1014806065%8
Administrator1014465661%8
Physical Therapy Assistant0223796672%5.6
Physical Therapy Aide0223786975%5.3
Respiratory Therapy Technician033863033%2.9
Qualified Social Worker022781314%6
Occupational Therapy Aide0111933%6.2
Medical Director011633%2.1
Occupational Therapy Assistant011633%2
70 Certified Nursing Assistant
% of Days 100%
25 Licensed Practical Nurse
% of Days 100%
5 Clinical Nurse Specialist
% of Days 97%
3 Registered Nurse
% of Days 93%
6 Nurse Aide in Training
% of Days 54%
3 Speech Language Pathologist
% of Days 84%
4 Nurse Practitioner
% of Days 73%
1 Dietitian
% of Days 67%
1 Dental Services Staff
% of Days 67%
1 RN Director of Nursing
% of Days 65%
1 Administrator
% of Days 61%
2 Physical Therapy Assistant
% of Days 72%
2 Physical Therapy Aide
% of Days 75%
3 Respiratory Therapy Technician
% of Days 33%
2 Qualified Social Worker
% of Days 14%
1 Occupational Therapy Aide
% of Days 3%
1 Medical Director
% of Days 3%
1 Occupational Therapy Assistant
% of Days 3%

Penalties and fines

Federal penalties imposed by CMS for regulatory violations, including civil money penalties (fines) and denials of payment for new Medicare/Medicaid admissions.

Source: CMS Penalties Database

No penalties in the past 3 years

No civil money penalties or payment denials were reported in the last 3 years.

Quality of care over time

These measures show how residents usually do over time at this home, based on health outcomes and preventive care.

High-risk clinical events score Info A composite score based on pressure ulcers, falls with injury, weight loss, walking ability decline, and activities of daily living decline. 9.0
17% worse than State average

State average: 7.7

Functional decline score Info A composite score based on activities of daily living decline, walking ability decline, and incontinence. 17.0
28% worse than State average

State average: 13.3

Long-stay resident measures
Significantly above average State avg: 4.2 Info CMS star rating based on long-stay quality measure performance. 5 stars = significantly above average, 1 star = significantly below average.
Need for Help with Daily Activities Increased Info Percent of long-stay residents whose need for help with daily activities has increased 11.9%
In line with State average

State average: 11.5%

Walking Ability Worsened Info Percent of long-stay residents whose ability to move independently worsened 16.5%
24% worse than State average

State average: 13.4%

Low Risk Residents with Bowel/Bladder Incontinence Info Percent of low risk long-stay residents who lose control of their bowels or bladder 22.6%
49% worse than State average

State average: 15.1%

Falls with Major Injury Info Percent of long-stay residents experiencing one or more falls with major injury 6.1%
55% worse than State average

State average: 3.9%

High Risk Residents with Pressure Ulcers Info Percent of long-stay high risk residents with pressure ulcers 1.8%
63% better than State average

State average: 4.7%

Urinary Tract Infection Info Percent of long-stay residents with a urinary tract infection 0.0%
100% better than State average

State average: 1.3%

Lost Too Much Weight Info Percent of long-stay residents who lose too much weight 8.5%
70% worse than State average

State average: 5.0%

Depressive Symptoms Info Percent of long-stay residents who have depressive symptoms 0.3%
78% better than State average

State average: 1.5%

Antipsychotic Use Info Percent of long-stay residents who received an antipsychotic medication 6.6%
37% better than State average

State average: 10.5%

Pneumococcal Vaccine Info Percent of long-stay residents assessed and appropriately given the pneumococcal vaccine 99.4%
5% better than State average

State average: 94.4%

Influenza Vaccine Info Percent of long-stay residents assessed and appropriately given the seasonal influenza vaccine 98.8%
In line with State average

State average: 96.2%

Hospitalizations per 1,000 days Info Number of hospitalizations per 1,000 long-stay resident days. 0.33
83% better than State average

State average: 1.97

ED visits per 1,000 days Info Number of outpatient emergency department visits per 1,000 long-stay resident days. 1.01
54% better than State average

State average: 2.18

Short-stay resident measures
Above average State avg: 2.7 Info CMS star rating based on short-stay quality measure performance. 5 stars = much above average, 1 star = much below average.
Pneumococcal Vaccine Info Percent of short-stay residents assessed and appropriately given the pneumococcal vaccine 93.8%
16% better than State average

State average: 80.9%

Antipsychotic medication increase Info Percent of short-stay residents who newly received an antipsychotic medication 2.2%
47% worse than State average

State average: 1.5%

Influenza Vaccine Info Percent of short-stay residents assessed and appropriately given the seasonal influenza vaccine 80.5%
In line with State average

State average: 77.7%

Re-hospitalized after SNF stay Info Percentage of short-stay residents who were re-hospitalized after their nursing home admission. 17.2%
32% better than State average

State average: 25.2%

Emergency department visits Info Percentage of short-stay residents who had an outpatient emergency department visit. 16.8%
22% worse than State average

State average: 13.8%

Falls with major injury Info Percentage of SNF residents who experience falls with major injury during their stay. 1.1%
43% worse than State average

State average: 0.8%

Ability to care for self at discharge Info Percentage of residents at or above expected ability to care for themselves at discharge. 55.3%
In line with State average

State average: 53.7%

Successful return to home or community Info Rate of successful return to home or community from a skilled nursing facility. 48.4%
In line with State average

State average: 50.6%

Breakdown by payment type

Medicare

48% of new residents, usually for short-term rehab.

Typical stay 1 - 2 months

Private pay

44% of new residents, often for short stays.

Typical stay 2 - 3 months

Medicaid

9% of new residents, often for long-term daily care.

Typical stay 3 - 4 years

Facility Characteristics

Source: CMS Long-Term Care Facility Characteristics (Data as of Jan 2026)

Total residents 91
Medicare
15
16.5% of residents
Medicaid
60
65.9% of residents
Private pay or other
16
17.6% of residents
Programs & Services
Residents Group

Residents meet regularly to discuss policies, care quality, and activities

Family Member Group

Family members meet regularly to discuss policies, care quality, and activities

Nurse Aide Training

State-approved Nurse Aide Training and Competency Evaluation Program on-site

Active Family Council

Organized group of family members that meets regularly to discuss facility policies, resident care, and activities.

Active Resident Council

Organized group of residents that meets regularly to discuss facility policies, quality of life, and activities.

Finances and operations

Based on CMS SNF Cost Report for fiscal year ending in 12/2023.

For-profit
Operated by a single business entity.
Net patient revenue Info Net patient revenue — what the home actually collects for resident care, after contractual allowances, bad debt and discounts are subtracted from its gross charges (CMS cost report, Worksheet G-3). It covers resident care only; money the home earns from other sources is shown separately as "Other income."
$11.5M
Net patient income Info Net patient income: net patient revenue minus the home's total operating expenses. A positive figure means it earns more from resident care than it spends to deliver it; a negative figure means the opposite. It excludes non-operating "other income."
$487.7K
For-profit Operated by a single business entity.
Net patient revenue Info Net patient revenue — what the home actually collects for resident care, after contractual allowances, bad debt and discounts are subtracted from its gross charges (CMS cost report, Worksheet G-3). It covers resident care only; money the home earns from other sources is shown separately as "Other income."
$11.5M
Net patient income Info Net patient income: net patient revenue minus the home's total operating expenses. A positive figure means it earns more from resident care than it spends to deliver it; a negative figure means the opposite. It excludes non-operating "other income."
$487.7K
Other income Info Money the home earns outside of resident care — such as investments, grants, rentals and other non-operating sources (CMS cost report, Worksheet G-3). It is tracked separately from net patient revenue: it is not part of that figure, and it is not included in net patient income.
$799.7K
Payroll costs Info Staff salaries plus wage-related costs — benefits such as payroll taxes, health insurance and retirement — from the home's own accounting records (CMS cost report, Worksheet A). Contract or agency labor is counted separately, under other operating costs.
$4.9M 42.4% of net patient revenue Info Payroll as a share of revenue: staff salaries and wage-related benefits divided by net patient revenue. A higher figure means more of each revenue dollar goes to staff pay.
Other operating costs Info Everything it costs to run the home apart from payroll — food, utilities, supplies, maintenance, contract labor and administration. Calculated as total operating expense minus payroll (staff salaries and wage-related benefits).
$6.1M
Total costs Info The home's total operating expense for the year — all the costs of running it, salaries included (CMS cost report, Worksheet G-3).
$11.0M

Who this home usually serves

TYPE OF STAY

Mostly short-term rehab stays

Most residents typically stay for a few weeks or months before returning home or moving on.

New residents most often arrive under Medicare (48% of admissions), and a typical Medicare stay runs around 1 - 2 months.

Admissions
188 total

Coverage residents most often arrive under.

Medicare 48%
Private pay 44%
Medicaid 9%
Discharges
190 total

Coverage residents most often leave under.

Medicare 43%
Private pay 42%
Medicaid 16%

Places of interest near The Green House Cottages of Homewood

Address 0.0 miles from city center Info Estimated distance in miles from Mena's city center to The Green House Cottages of Homewood's address, calculated via Google Maps.

Calculate Travel Distance to The Green House Cottages of Homewood

Add your location

Address

Compare Nursing Homes around the area

The information below is reported by the Arkansas Department of Human Services, Office of Long Term Care.

Indian Rock Village
NH
Fairfield Bay -55 - 11 Studio / 1 Bed / 2 Bed
Bear Creek Healthcare LLC
NH
De Queen -131 - 35 -
Heartland Rehabilitation and Care Center
NH
RC
SNF
Benton -119 A+ 0 -
The Green House Cottages of Homewood
NH
HOS
MC
PC
RC
SNF
Mena -138 - 67 -
Barnes Healthcare
NH
MC
Lonoke -141 A+ 38 Private / Shared Rooms

Frequently Asked Questions about The Green House Cottages of Homewood

Who is the owner of The Green House Cottages of Homewood?

The Green House Cottages of Homewood is legally operated by Mena SNF Operations, LLC, and administered by T Marquel (Kelly) Parks.

Is The Green House Cottages of Homewood in a walkable area?

The Green House Cottages of Homewood has a walk score of 67. Moderately walkable. Some errands can be accomplished on foot, with a mix of nearby amenities.

What is the occupancy rate at The Green House Cottages of Homewood?

The Green House Cottages of Homewood's occupancy is 59%.

Does The Green House Cottages of Homewood operate as a for-profit or non-profit?

The Green House Cottages of Homewood is registered as a for-profit in AR.

Who is the administrator of The Green House Cottages of Homewood?

T Marquel (Kelly) Parks is the administrator of The Green House Cottages of Homewood.

How many beds does The Green House Cottages of Homewood have?

The Green House Cottages of Homewood has 138 beds.

Are there photos of The Green House Cottages of Homewood?

Yes — there are 5 photos of The Green House Cottages of Homewood in the photo gallery on this page.

Guides for Better Senior Living

Care Cost Calculator: See Prices in Your Area

Nursing Home Data Explorer

Don’t Wait Too Long: 7 Red Flag Signs Your Parent Needs Assisted Living Now

The True Cost of Assisted Living in 2025 – And How Families Are Paying For It

Understanding Senior Living Costs: Pricing Models, Discounts & Financial Assistance