


Occupancy rate
100%
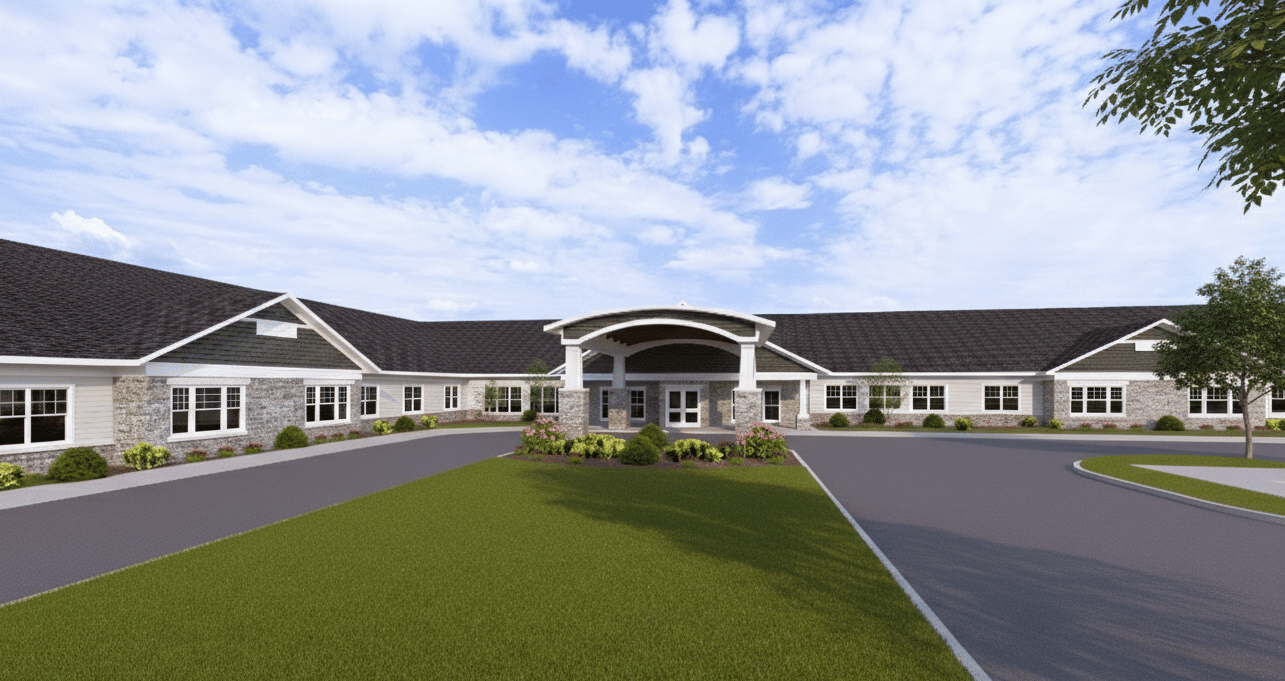
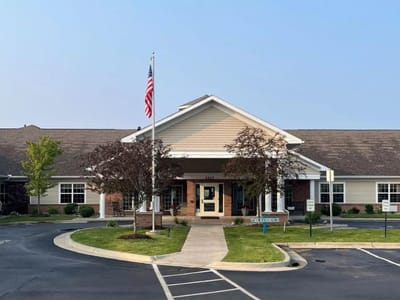
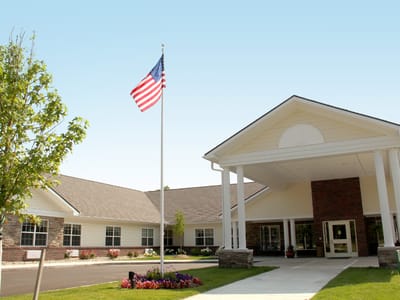
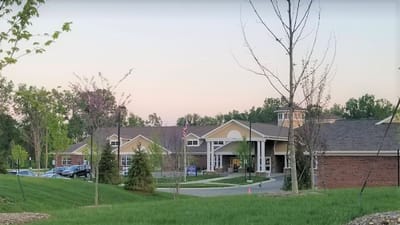
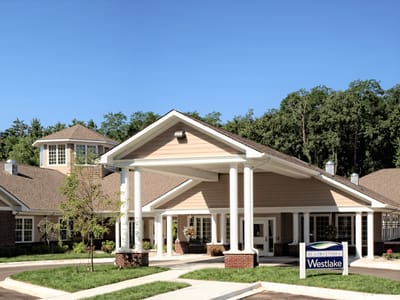


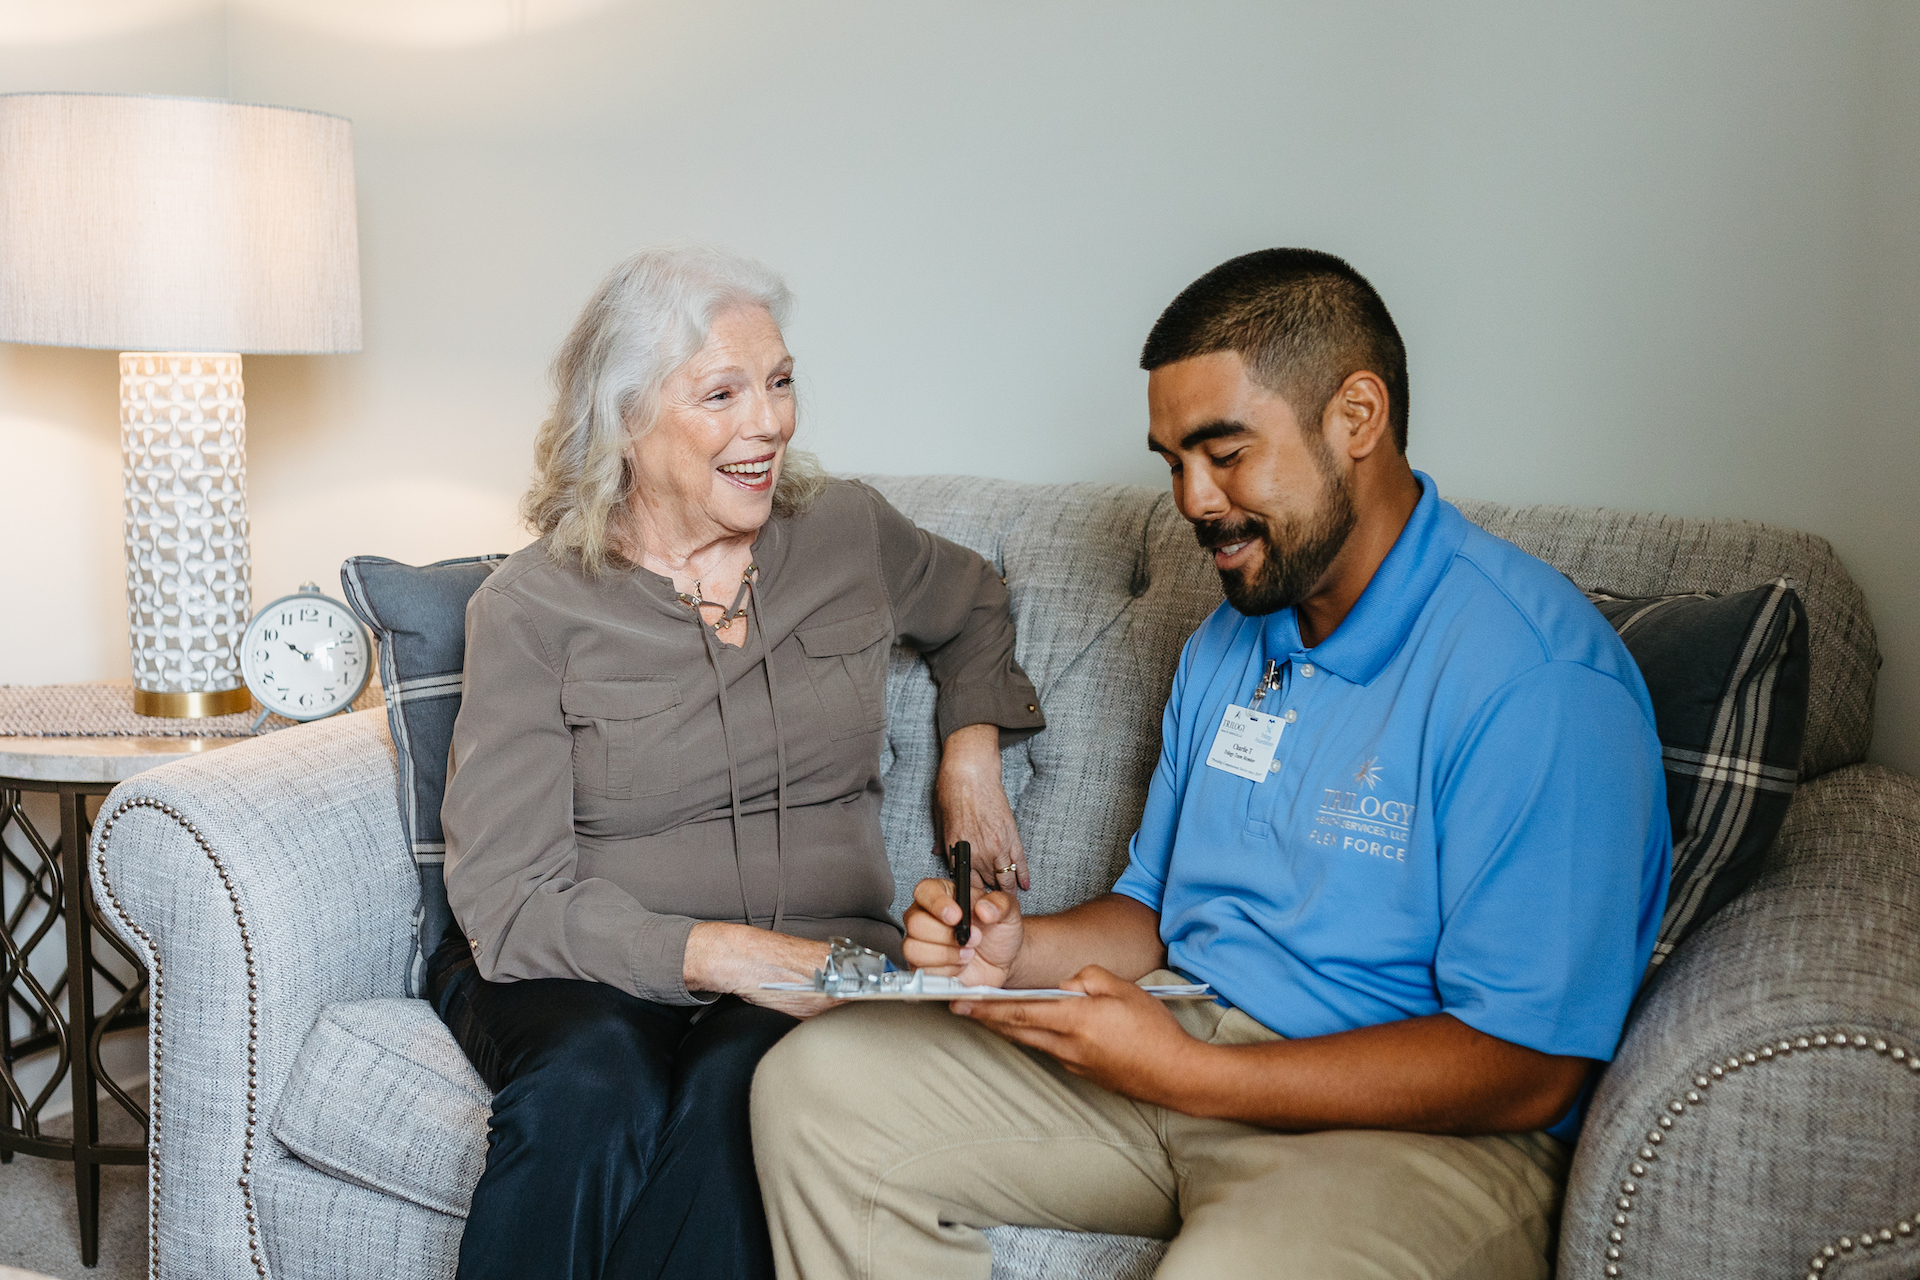
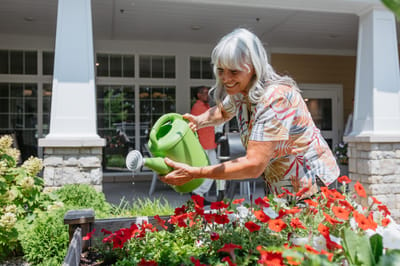
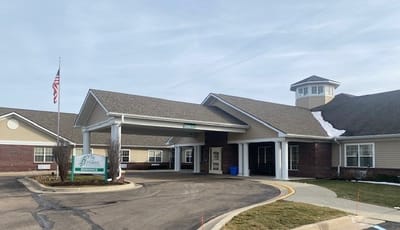

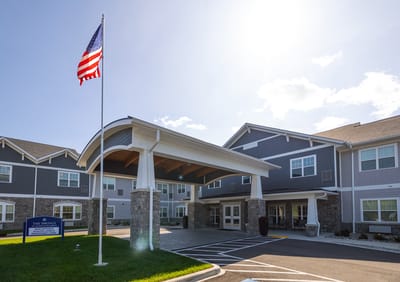


The Willows at Howell is a 39-bed skilled nursing facility that provides short-term rehabilitation, memory care, independent living, and assisted living services. Located in a walkable urban neighborhood, the property handles brief post-acute recovery stays, resulting in a 46-day average length of stay. Admissions primarily focus on a mix of Medicare (46%) and private-pay (43%) clients. Business records indicate strong financial health, with the operation posting a $1.4 million profit and a 9.8% margin while routing 52.7% of its revenue into payroll to support on-site amenities like a courtyard, library, resident garden, and private dining rooms.
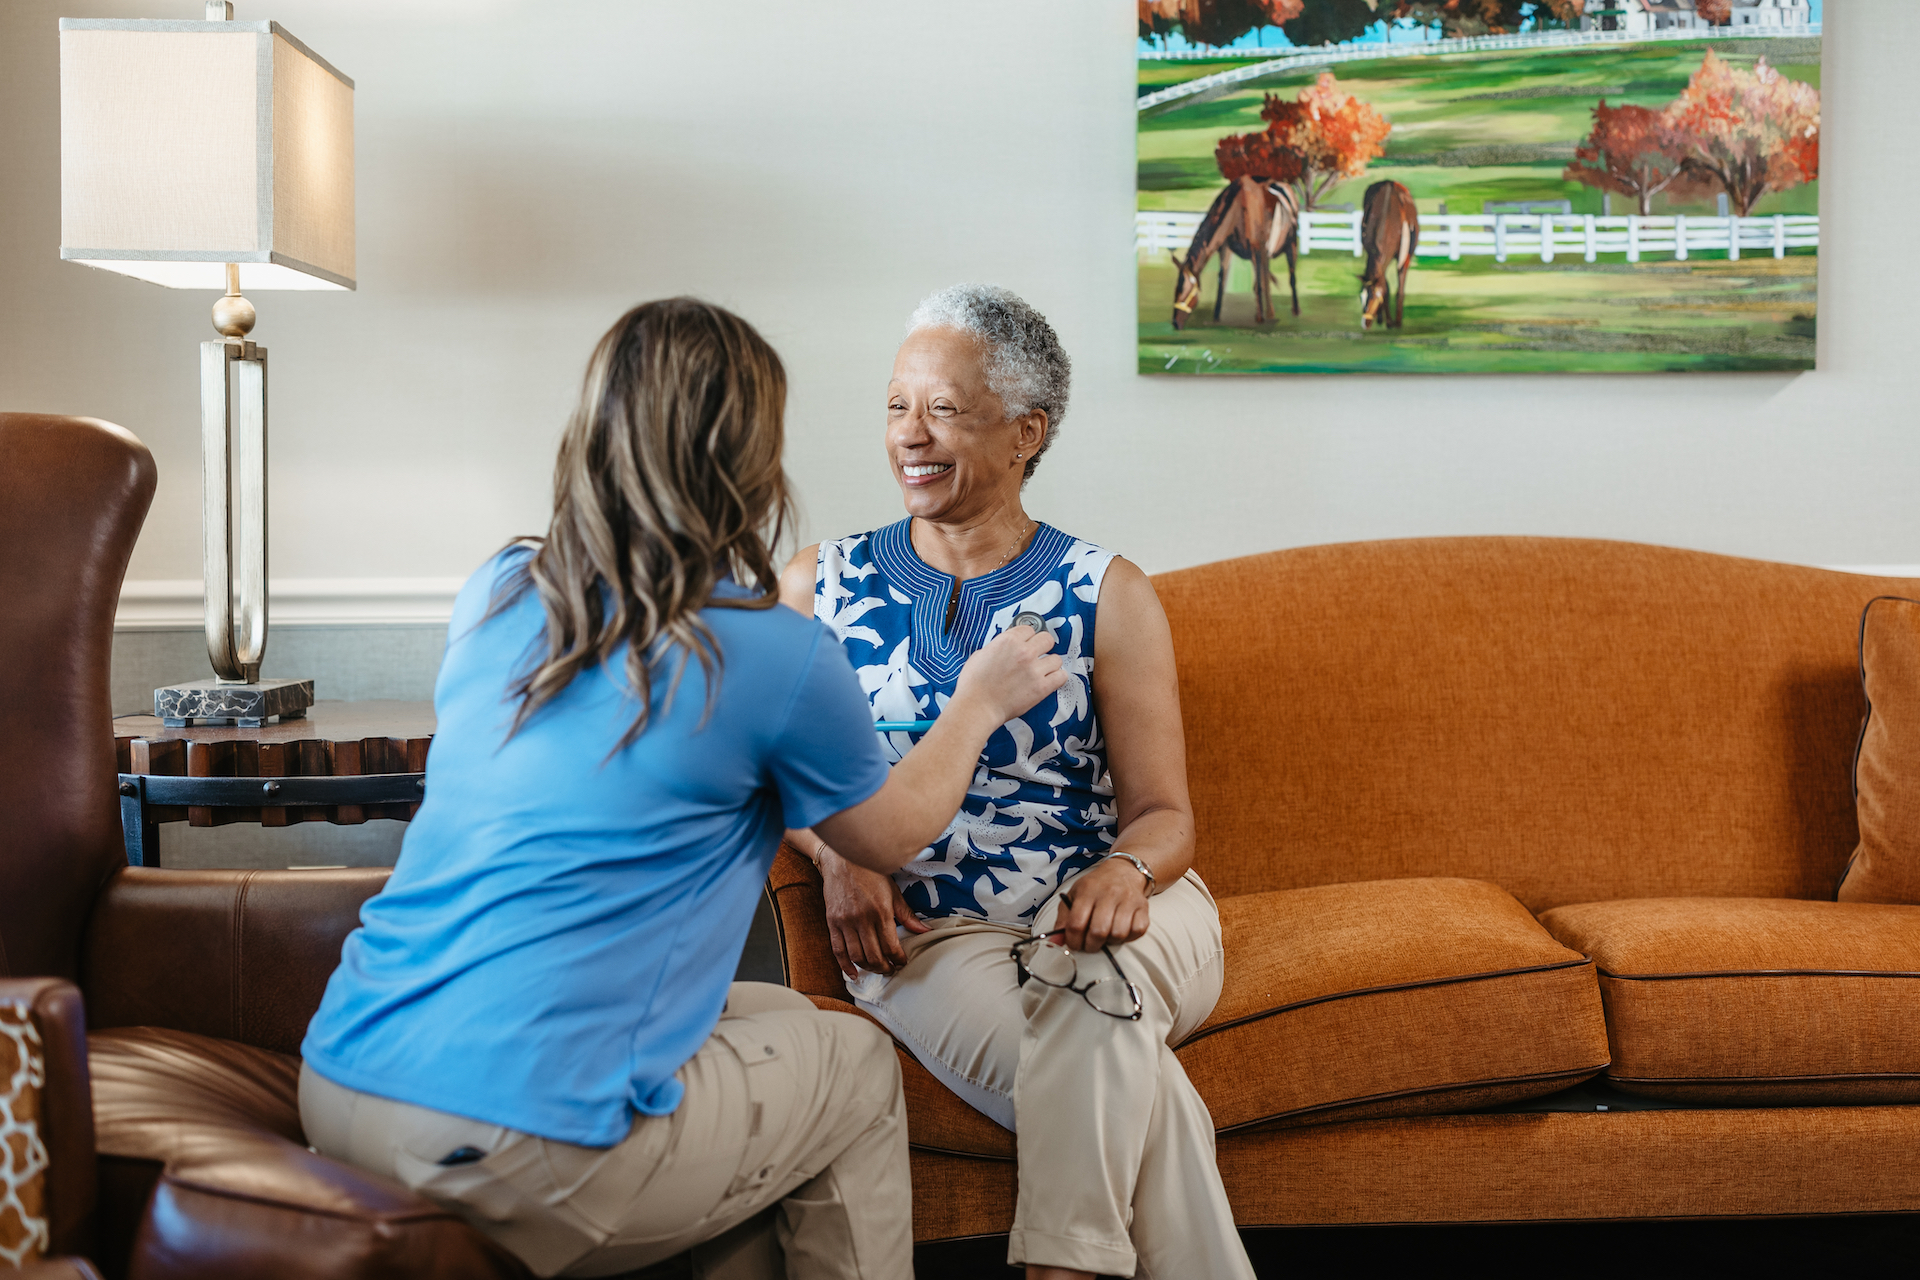
Public health tracking logs confirm an exceptional regulatory history paired with top-tier clinical outcomes despite a low local occupancy rate of 26%. Direct nursing care averages 3 hours and 44 minutes per resident daily, highlighted by weekend registered nurse coverage that runs 152% ahead of the Michigan state average, alongside physical therapy volumes that track 125% above the state baseline.
On the compliance side, the property has compiled just three total deficiencies since 2015, which sits 85% better than the state average, and carries zero history of federal financial penalties. Its most recent standard inspection in April 2024 flagged three minor, subsequently resolved documentation gaps regarding hospice roles and medication service plans. Clinical charts demonstrate high performance across both long-term and short-term metrics, documenting a zero percent rate for permanent resident pressure ulcers and a short-term community discharge success rate that beats the state norm by 36%.
Prospective representatives looking into premium post-acute physical rehabilitation or short-term recovery placements can analyze these public health profiles to evaluate the home’s baseline. Since the official tracking records low physical utilization alongside heavy weekend nurse staffing, high rehabilitation discharge numbers, and a near-flawless decade-long inspection track record, the documentation describes a highly capable and organized clinical environment.
| Staff type | Hours / Day / Resident | vs state avg |
|---|---|---|
|
Registered Nurse (RN)
| 1h 22m per day | ▲ 78% State avg: 46m per day · National avg: 41m per day |
|
LPN / LVN
| 39m per day | ▼ 27% State avg: 53m per day · National avg: 52m per day |
|
Nurse Aide
| 1h 54m per day | ▼ 20% State avg: 2h 23m per day · National avg: 2h 20m per day |
|
Weekend Total Nursing
| 3h 49m per day | ▲ 9% State avg: 3h 31m per day · National avg: 3h 26m per day |
|
Physical Therapist
| 7m per day | ▲ 78% State avg: 4m per day · National avg: 4m per day |
|
Weekend RN
| 1h 13m per day | ▲ 151% State avg: 29m per day · National avg: 28m per day |
In Michigan, the Department of Licensing and Regulatory Affairs (LARA) conducts unannounced inspections and investigations to ensure long-term care facilities comply with state health codes.
Deficiencies
| This Facility | MI Average | vs. MI Avg |
|---|---|---|---|
|
Total deficiencies
| 25 | 8 | This facility has 213% more total deficiencies than a typical Michigan assisted living residence (25 vs. MI avg 8).↑ 213% worse |
|
Deficiencies per year
| 2.3 | 0.7 | This facility has 229% more deficiencies per year than a typical Michigan assisted living residence (2.3 vs. MI avg 0.7).↑ 229% worse |
State average N/A
Last Health inspection on Jan 2025
State average N/A
State average N/A
Health citations are formal notices following inspections when they fail to comply with safety and care standards.
15 of 20 citations resulted from standard inspections; 2 of 20 resulted from complaint investigations; and 3 of 20 came from combined inspections (standard and complaint).
State average: N/A
State average: N/A
Reporting period: October 1 – December 31, 2025 (Q4 2025). Source: CMS Payroll-Based Journal report.
State average ratio: 0 : 0
State average: 0 hours
Manages medical care and health needs.
Assists with medical care and medications.
Helps with daily care and mobility.
Total hours from contractors
3,059 contractor hours this quarter
| Certified Nursing Assistant | 34 | 0 | 34 | 9,487 | 92 | 100% | 7.4 |
| Registered Nurse | 18 | 0 | 18 | 5,246 | 92 | 100% | 7.7 |
| Licensed Practical Nurse | 7 | 0 | 7 | 2,767 | 92 | 100% | 9.8 |
| Other Dietary Services Staff | 9 | 0 | 9 | 2,039 | 92 | 100% | 8.3 |
| Clinical Nurse Specialist | 6 | 0 | 6 | 1,075 | 88 | 96% | 8.9 |
| Physical Therapy Assistant | 0 | 3 | 3 | 900 | 80 | 87% | 6.5 |
| Speech Language Pathologist | 0 | 3 | 3 | 778 | 66 | 72% | 6.3 |
| Respiratory Therapy Technician | 0 | 3 | 3 | 596 | 77 | 84% | 5.7 |
| Nurse Practitioner | 1 | 0 | 1 | 510 | 64 | 70% | 8 |
| Dietitian | 1 | 0 | 1 | 508 | 64 | 70% | 7.9 |
| Administrator | 1 | 0 | 1 | 504 | 63 | 68% | 8 |
| Physical Therapy Aide | 0 | 2 | 2 | 487 | 66 | 72% | 5.8 |
| RN Director of Nursing | 1 | 0 | 1 | 463 | 48 | 52% | 9.7 |
| Qualified Social Worker | 0 | 2 | 2 | 299 | 64 | 70% | 4.7 |
| Nurse Aide in Training | 1 | 0 | 1 | 38 | 5 | 5% | 7.7 |
| Occupational Therapy Assistant | 2 | 0 | 2 | 36 | 55 | 60% | 0.6 |
Federal penalties imposed by CMS for regulatory violations, including civil money penalties (fines) and denials of payment for new Medicare/Medicaid admissions.
Source: CMS Penalties Database
No penalties in the past 3 years
No civil money penalties or payment denials were reported in the last 3 years.
These measures show how residents usually do over time at this home, based on health outcomes and preventive care.
State average: 8.4
State average: 16.3
State average: 12.5%
State average: 15.3%
State average: 21.0%
State average: 3.2%
State average: 5.7%
State average: 1.7%
State average: 5.7%
State average: 3.9%
State average: 15.0%
State average: 94.9%
State average: 95.0%
State average: 1.74
State average: 1.54
State average: 82.5%
State average: 1.4%
State average: 79.5%
State average: 24.2%
State average: 11.5%
State average: 0.8%
State average: 53.7%
State average: 50.6%
Quality measures are calculated from Minimum Data Set (MDS) assessments. For most measures, lower percentages indicate better care quality.
46% of new residents, usually for short-term rehab.
43% of new residents, often for short stays.
12% of new residents, often for long-term daily care.
Source: CMS Long-Term Care Facility Characteristics (Data as of Jan 2026)
Residents meet regularly to discuss policies, care quality, and activities
Family members meet regularly to discuss policies, care quality, and activities
Organized group of family members that meets regularly to discuss facility policies, resident care, and activities.
Organized group of residents that meets regularly to discuss facility policies, quality of life, and activities.
Data sourced from CMS Long-Term Care Facility Characteristics quarterly report. Payer mix reflects the current resident census by primary payment source.
Historical financial and operational data for The Willows at Howell from 2016–2023, based on CMS SNF Cost Reports.
Key figures below are for fiscal year ending in 12/2023.
Based on CMS SNF Cost Report for fiscal year ending in 12/2023.
Pets Allowed
Most residents typically stay for a few weeks or months before returning home or moving on.
New residents most often arrive under Medicare (46% of admissions), and a typical Medicare stay runs around 20 days.
Coverage residents most often arrive under.
Coverage residents most often leave under.
![]() 0.0 miles from city center
0.0 miles from city center
![]() Estimated distance in miles from Howell's city center to The Willows at Howell's address, calculated via Google Maps.
Estimated distance in miles from Howell's city center to The Willows at Howell's address, calculated via Google Maps.
Add your location
The information below is reported by the Michigan Department of Licensing and Regulatory Affairs (LARA).
| Chelsea Retirement Community | NH AL IL MC SNF | Chelsea | - | 172 | - | 13 | Studio / 1 Bed / 2 Bed / Cottage |
| Lourdes Senior Community | NH AL HOS IL MC SNF | Waterford Twp (Watkins-Pontiac Estates) | - | 80 | - | 8 | Studio / 1 Bed / 2 Bed |
| Bay Bluffs Emmet County Medical Care Facility | NH HOS MC SNF | Harbor Springs | - | 120 | - | 29 | - |
| Michigan Masonic Home | NH AL IL MC PC RC SNF | Alma | - | 124 | A+ | 67 | - |
| The Willows at Howell | NH ADC AL IL MC SNF | Howell | - | 39 | - | 78 | - |
The Willows at Howell is legally operated by Trilogy Healthcare of Livingston, LLC.
The Willows at Howell has a walk score of 78. Very walkable. Most errands can be accomplished on foot, and many essentials are within a short walk.
According to MI state health department records, The Willows at Howell's license number is AH470342721.
According to MI state health department records, The Willows at Howell's license expires on July 31, 2026.
The Willows at Howell's occupancy is 100%.
Yes, The Willows at Howell allows residents to bring their pets.
The Willows at Howell is registered as a for-profit in MI.
Care Cost Calculator: See Prices in Your Area
Nursing Home Data Explorer
Don’t Wait Too Long: 7 Red Flag Signs Your Parent Needs Assisted Living Now
The True Cost of Assisted Living in 2025 – And How Families Are Paying For It
Understanding Senior Living Costs: Pricing Models, Discounts & Financial Assistance


