Meadowbrook Rehabilitation Hospital
Nursing Home & Skilled Nursing · Gardner, KS
CMS overall rating Info CMS (the Centers for Medicare & Medicaid Services) is the federal agency that rates nursing home quality. Its Overall Rating runs from 1 to 5 stars, combining health inspections, staffing, and quality measures, with inspections weighted most heavily.

Meadowbrook Rehabilitation Hospital

Nursing Home & Skilled Nursing · Gardner, KS
CMS overall rating Info CMS (the Centers for Medicare & Medicaid Services) is the federal agency that rates nursing home quality. Its Overall Rating runs from 1 to 5 stars, combining health inspections, staffing, and quality measures, with inspections weighted most heavily.
Calculator: See prices in your area
Meadowbrook Rehabilitation Hospital accepts Medicaid.

Overview of Meadowbrook Rehabilitation Hospital

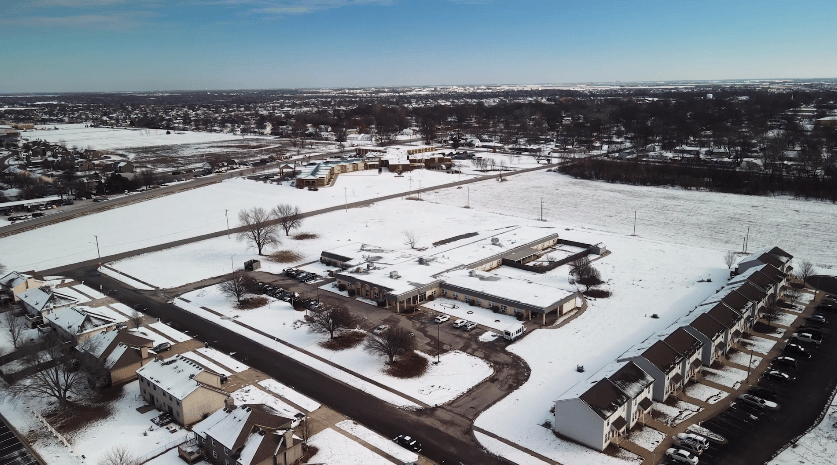
Meadowbrook Rehabilitation Hospital is a specialized facility located at 427 West Main Street in Gardner, Kansas. Owned by Recover-Care Healthcare, the center serves Johnson County as a 124-bed inpatient rehabilitation hospital and a 42-bed certified skilled nursing program.

Meadowbrook is uniquely positioned as the only Medicaid-approved inpatient brain injury rehabilitation hospital in Kansas. This specialized mission serves high-acuity, neurologically complex patients who require hospital-level care rather than traditional nursing home services. While the facility currently carries a 1-out-of-5-star overall CMS rating for its skilled nursing component, its acute rehabilitation program is CARF-accredited, reflecting high standards for traumatic and acquired brain injury recovery. Recent 2026 filings show a health inspection score trending below state averages, though its focused citations-per-inspection rate remains zero for recent infection control surveys.

The facility’s staffing model reflects the high clinical intensity of its neurologically complex patient population. Registered Nurse (RN) coverage is 54 minutes per resident per day, 26% above the Kansas average, and weekend RN coverage is 40 minutes, providing 33% more oversight than the state benchmark. Total adjusted nursing hours are 3 hours and 16 minutes daily, with nurse aides providing 1 hour and 55 minutes of care. The interdisciplinary clinical team includes neuropsychologists, board-certified music therapists, recreational therapists, and 24/7 respiratory care for tracheostomy weaning and pulmonary medical recovery.

Residents live in a hospital-based environment that includes private rooms, wheelchair-accessible showers, and 24-hour medical monitoring. All-inclusive services cover specialized therapeutic dining, housekeeping, and on-site laundry facilities. Intensive restorative physical, occupational, and speech therapy is available seven days a week, alongside life skills training for community reintegration. The campus also features a rehabilitation gym, music therapy rooms, a computer lounge with Wi-Fi, and WanderGuard elopement prevention systems, while providing a pet-friendly environment and a hair salon for resident comfort.

Those requiring hospital-level rehabilitation for traumatic or acquired brain injuries may find this facility to be an essential regional resource. Individuals should contact the admissions director directly to discuss specific medical criteria, as the length of stay can range from months to over a year, and schedule a tour to assess the specialized acute care units firsthand.

Quality ratings

Measured by Centers for Medicare & Medicaid Services (CMS)

Overall rating Info The Overall CMS Rating combines results from health inspections, staffing levels and quality measures. Health inspections carry the most weight. Staffing and quality scores can increase or decrease the final rating based on performance compared to state and national standards.
Health Inspection Info Based on the results of the facility's three most recent standard inspections and any complaint investigations. CMS reviews the number, scope, and severity of deficiencies, with more recent findings weighted more heavily.
Staffing Info Measures average nursing staff hours per resident per day, including Registered Nurses (RNs) and total nursing staff. Ratings are adjusted based on the level of care residents require and are compared to state and national benchmarks.
Quality Measures Info Based on clinical and physical health indicators reported to CMS, such as hospital readmissions, falls, pressure ulcers, and improvements in mobility. These measures reflect how well residents' health needs are being managed.

Staffing hours breakdown

Info Daily nursing hours per resident by staff type, reported to CMS. Higher is generally better — compare this facility to state and national averages to see where staffing stands.

Hours per resident per day — compared to state averages

Total nursing care / resident Info Total adjusted nursing hours per resident per day, combining RN, LPN, and aide time. CMS adjusts this for case-mix so facilities can be fairly compared.
3h 7m per day
vs avg

3 of 6 metrics below state avg

Standout metric Weekend RN is +32% above state avg
Staff typeHours / Day / Residentvs state avg
Registered Nurse (RN) Info RNs hold the highest nursing license and can assess residents, interpret test results, and direct care plans. More RN hours per day often signals stronger clinical oversight and faster response to health changes. 55m per day ▲ 27% State avg: 43m per day · National avg: 41m per day
LPN / LVN Info Licensed Practical Nurses (LPNs) or Licensed Vocational Nurses (LVNs) deliver routine hands-on care — medication administration, wound dressing, and monitoring vital signs. They work under RN supervision and make up a large share of daily bedside care. 37m per day ▼ 6% State avg: 40m per day · National avg: 52m per day
Nurse Aide Info Certified Nurse Aides (CNAs) provide the most direct day-to-day assistance: bathing, dressing, feeding, and mobility. Nurse aide hours are typically the largest staffing category and directly affect residents' quality of life. 2h 16m per day ▼ 15% State avg: 2h 41m per day · National avg: 2h 20m per day
Weekend Total Nursing Info Combined nursing hours (RN + LPN + Nurse Aide) per resident per day on weekends. Staffing often drops on weekends — this figure reveals whether the facility maintains adequate coverage outside of weekday hours. 3h 30m per day ■ Avg State avg: 3h 35m per day · National avg: 3h 26m per day
Physical Therapist Info Hours per resident per day provided by licensed Physical Therapists (PTs) or PT Assistants. PT services help residents recover mobility after injury or illness and are especially important for post-acute (short-stay) rehabilitation. 2m per day ▼ 14% State avg: 2m per day · National avg: 4m per day
Weekend RN Info Registered nurse hours specifically on weekends. Facilities sometimes reduce RN presence on Saturdays and Sundays — a low weekend RN figure compared to weekday hours can indicate reduced clinical oversight when most administrative staff are absent. 39m per day ▲ 32% State avg: 30m per day · National avg: 28m per day
Bed community size
124-bed community Rank #19 / 224Bed count — State benchmarkedThis home is ranked 19th out of 224 homes in Kansas. Shows this facility's certified or reported bed count compared to other Kansas facilities. Larger communities may offer more amenities, programs, and on-site services for residents and families.Rankings are based only on facilities in Kansas that report data for that category. Facilities without available data are excluded from the ranking.Click the rank badge to see the full State ranking.Click here to see the full State ranking.
A larger shared setting that may offer more common spaces and organized community services.
Walk Score
Walk Score: 1 / 100 Rank #352 / 363Walk Score — State benchmarkedThis home is ranked 352nd out of 363 homes in Kansas. Shows how walkable this facility's neighborhood is compared to the average Walk Score across Kansas facilities. Higher scores benefit residents, families, and staff.Rankings are based only on facilities in Kansas that report data for that category. Facilities without available data are excluded from the ranking.Click the rank badge to see the full State ranking.Click here to see the full State ranking.
Car-dependent. Most errands require a car, with limited nearby walkable options.
BBB Rating
BBB Rating: A+ (Not Accredited)
An independent rating from the Better Business Bureau based on factors such as complaint history, transparency, and business practices.
How BBB ratings work

About this community

Occupancy

Occupancy rate
88%
Higher than the Kansas average: 79.5%
Occupied beds
109 / 124
Average occupied beds in Kansas homes 50 beds

License Details

Facility TypeNursing Facility
StatusActive
CountyJohnson
License Number175130
AccreditationsCARF accredited

Ownership & Operating Entity

Meadowbrook Rehabilitation Hospital is administered by Musu Jawara.

Owner NameRecover-Care Meadowbrook Rehabilitation LLC

Staffing

Key information about the people who lead and staff this community.

Leadership

ContactDavid O'Brien (per BBB, record updated May 2026)

Payment & Insurance

1 service
Accept Medicaid

Therapy & Rehabilitation

1 service
Rehabilitation Services

Staffing & Medical

1 service
24-Hour Staffing

Amenities & Lifestyle

Specific ProgramsInpatient Acute Rehab, Brain Injury Rehabilitation, Price Transparency

Contact Meadowbrook Rehabilitation Hospital

Inspection History

In Kansas, the Department for Aging and Disability Services, Survey and Certification Commission performs the unannounced inspections required for facility licensing and federal certification.

Since 2012 · 14 years of data 144 deficiencies

Inspection Scorecard Info This scorecard compares key inspection, deficiency, and complaint metrics at this facility against the Kansas state average. Metrics rated ≥15% worse than average are highlighted in red; those ≥15% better are highlighted in green.

Since 2012 vs. Kansas state average
Overall vs. KS average 2 Worse Metrics worse than Kansas average:
• Total deficiencies (44% above)
• Deficiencies per year (45% above)
0 Better No metrics in this bucket.
Latest Inspection October 1, 2025

Deficiencies Info Deficiencies are formal regulatory issues recorded during state inspections.

This FacilityKS Averagevs. KS Avg
Total deficiencies Info Formal regulatory issues recorded by inspectors across all inspection types. 144100 This facility has 44% more total deficiencies than a typical Kansas assisted living residence (144 vs. KS avg 100).↑ 44% worse
Deficiencies per year Info Average deficiencies per year since 2012. 10.37.1 This facility has 45% more deficiencies per year than a typical Kansas assisted living residence (10.3 vs. KS avg 7.1).↑ 45% worse

Inspection Reports Summary Info An editor-reviewed summary of the themes and findings across this facility's recent inspection reports.

  • The most recent inspection on July 21, 2016, found no deficiencies, confirming that previously cited issues had been corrected. Earlier inspections showed a pattern of deficiencies related mainly to resident care, including skin condition assessments, fall investigations, infection control, medication management, and environmental safety such as secure handrails. A substantiated complaint investigation in August 2015 identified immediate jeopardy due to inadequate bathing care and failure to prevent resident elopement, which was later abated through corrective actions. Fines, license suspensions, or other enforcement actions were not listed in the available reports. The facility’s inspection history indicates improvement over time, with more recent surveys showing resolution of prior deficiencies.

Health Inspection History

Inspections since 2022
Total health inspections 8

State average N/A


Last Health inspection on Sep 2025

Total health citations
55

State average N/A

Citations per inspection
6.88

State average N/A


Health citations are formal notices following inspections when they fail to comply with safety and care standards.

23 of 55 citations resulted from standard inspections; 10 of 55 resulted from complaint investigations; and 22 of 55 came from combined inspections (standard and complaint).

Breakdown of citation severity (last 4 years)
Critical health citations
4
In line with State average

State average: N/A


Serious health citations
3
In line with State average

State average: N/A

4 critical citations State average: N/A

3 serious citations State average: N/A

46 moderate citations State average: N/A

2 minor citations State average: N/A
Citations history (last 4 years)
Abuse/Neglect moderate citation Sep 16, 2025
Corrected

Administration minor citation Sep 16, 2025
Corrected

Nursing Services moderate citation Sep 16, 2025
Corrected

Nutrition moderate citation Sep 16, 2025
Corrected

Staffing Data

Reporting period: October 1 – December 31, 2025 (Q4 2025). Source: CMS Payroll-Based Journal report.

Total staff 168
Employees 148
Contractors 20
Staff to resident ratio 1.68 : 1
0% compared with State average

State average ratio: 0 : 0

Avg staff/day 54
Average shift 8.7 hours
0% compared with State average

State average: 0 hours

Total staff hours (quarter) 43,456

Nursing staff breakdown

Q4 2025 · Oct 1 – Dec 31 More info This data comes from the CMS Payroll-Based Journal report covering October 1 – December 31, 2025.
Registered Nurse

Manages medical care and health needs.

RN Staff Info 27 total: 26 full-time employees and 1 contractor. 27
Average shift length Info Average shift length. Calculated as total hours divided by days worked and average staff per day. 8.8 hours
Licensed Practical Nurse

Assists with medical care and medications.

LPN Staff Info 16 total: 15 full-time employees and 1 contractor. 16
Average shift length Info Average shift length. Calculated as total hours divided by days worked and average staff per day. 10 hours
Certified Nursing Assistant

Helps with daily care and mobility.

CNA Staff Info All 72 CNA Staff are full-time employees. No contractors work on this role. 72
Average shift length Info Average shift length. Calculated as total hours divided by days worked and average staff per day. 9.5 hours

Contractor staffing

Q4 2025 · Oct 1 – Dec 31 More info This data comes from the CMS Payroll-Based Journal report covering October 1 – December 31, 2025.

Total hours from contractors

6.9%

2,995 contractor hours this quarter

Speech Language Pathologist: 4 Physical Therapy Assistant: 4 Respiratory Therapy Technician: 4 Qualified Social Worker: 3 Physical Therapy Aide: 3 Registered Nurse: 1 Licensed Practical Nurse: 1

Staff by category

Q4 2025 · Oct 1 – Dec 31 More info This data comes from the CMS Payroll-Based Journal report covering October 1 – December 31, 2025.
Certified Nursing Assistant7207219,27592100%9.5
Registered Nurse261277,68892100%8.8
Licensed Practical Nurse151165,60692100%10
Medication Aide/Technician180183,06892100%8.8
Nurse Practitioner4041,2606874%8
Dietitian2029756874%7.8
Speech Language Pathologist0449496975%6.7
Other Dietary Services Staff2028787582%7.5
Physical Therapy Aide0337756773%6.1
Administrator4047086773%5
Qualified Social Worker0335337278%6.8
RN Director of Nursing2025246267%8.3
Mental Health Service Worker2024534347%8.2
Physical Therapy Assistant0443846975%5.1
Respiratory Therapy Technician0442815863%4.7
Qualified Activities Professional101994043%2.5
72 Certified Nursing Assistant
% of Days 100%
27 Registered Nurse
% of Days 100%
16 Licensed Practical Nurse
% of Days 100%
18 Medication Aide/Technician
% of Days 100%
4 Nurse Practitioner
% of Days 74%
2 Dietitian
% of Days 74%
4 Speech Language Pathologist
% of Days 75%
2 Other Dietary Services Staff
% of Days 82%
3 Physical Therapy Aide
% of Days 73%
4 Administrator
% of Days 73%
3 Qualified Social Worker
% of Days 78%
2 RN Director of Nursing
% of Days 67%
2 Mental Health Service Worker
% of Days 47%
4 Physical Therapy Assistant
% of Days 75%
4 Respiratory Therapy Technician
% of Days 63%
1 Qualified Activities Professional
% of Days 43%

Penalties and fines

Includes penalties issued in 2024-2025

Federal penalties imposed by CMS for regulatory violations, including civil money penalties (fines) and denials of payment for new Medicare/Medicaid admissions.

Source: CMS Penalties Database (Data as of Jan 2026)

Total fines amount $103K
135% higher than State average

State average: $44K

Number of fines 3
24% more fines than State average

State average: 2.4

Payment Denials Info Serious action where Medicare and/or Medicaid temporarily stops payments for new residents until issues are fixed. 0
100% fewer payment denials than State average

State average: 0.3

Fines amount comparison
This facility $103K
State average $44K
Penalty History

Penalties are imposed by CMS for violations of federal nursing home regulations.

2 penalties in the past 3 years

Multiple penalties were reported in the last 3 years.

Civil Money Penalty Info Fines imposed for noncompliance, which can be assessed per day or per instance of violation. Apr 7, 2025
$83K
Civil Money Penalty Info Fines imposed for noncompliance, which can be assessed per day or per instance of violation. Nov 12, 2024
$10K

Last updated: Jan 2026

Quality of care over time

These measures show how residents usually do over time at this home, based on health outcomes and preventive care.

High-risk clinical events score Info A composite score based on pressure ulcers, falls with injury, weight loss, walking ability decline, and activities of daily living decline. 4.7
55% better than State average

State average: 10.5

Functional decline score Info A composite score based on activities of daily living decline, walking ability decline, and incontinence. 11.9
43% better than State average

State average: 20.7

Long-stay resident measures
Above average Info CMS star rating based on long-stay quality measure performance. 5 stars = significantly above average, 1 star = significantly below average.
Need for Help with Daily Activities Increased Info Percent of long-stay residents whose need for help with daily activities has increased 7.1%
63% better than State average

State average: 19.0%

Walking Ability Worsened Info Percent of long-stay residents whose ability to move independently worsened 10.0%
48% better than State average

State average: 19.4%

Low Risk Residents with Bowel/Bladder Incontinence Info Percent of low risk long-stay residents who lose control of their bowels or bladder 18.5%
22% better than State average

State average: 23.8%

Falls with Major Injury Info Percent of long-stay residents experiencing one or more falls with major injury 3.0%
33% better than State average

State average: 4.4%

High Risk Residents with Pressure Ulcers Info Percent of long-stay high risk residents with pressure ulcers 3.1%
34% better than State average

State average: 4.6%

Urinary Tract Infection Info Percent of long-stay residents with a urinary tract infection 0.8%
73% better than State average

State average: 3.1%

Lost Too Much Weight Info Percent of long-stay residents who lose too much weight 0.6%
88% better than State average

State average: 5.1%

Depressive Symptoms Info Percent of long-stay residents who have depressive symptoms 0.0%
100% better than State average

State average: 5.2%

Antipsychotic Use Info Percent of long-stay residents who received an antipsychotic medication 16.8%
In line with State average

State average: 16.9%

Pneumococcal Vaccine Info Percent of long-stay residents assessed and appropriately given the pneumococcal vaccine 90.3%
In line with State average

State average: 91.9%

Influenza Vaccine Info Percent of long-stay residents assessed and appropriately given the seasonal influenza vaccine 96.0%
In line with State average

State average: 95.5%

Hospitalizations per 1,000 days Info Number of hospitalizations per 1,000 long-stay resident days. 2.79
52% worse than State average

State average: 1.84

ED visits per 1,000 days Info Number of outpatient emergency department visits per 1,000 long-stay resident days. 1.37
37% better than State average

State average: 2.16

Short-stay resident measures
Below average Info CMS star rating based on short-stay quality measure performance. 5 stars = much above average, 1 star = much below average.
Pneumococcal Vaccine Info Percent of short-stay residents assessed and appropriately given the pneumococcal vaccine 63.6%
16% worse than State average

State average: 75.6%

Antipsychotic medication increase Info Percent of short-stay residents who newly received an antipsychotic medication 1.0%
55% better than State average

State average: 2.2%

Influenza Vaccine Info Percent of short-stay residents assessed and appropriately given the seasonal influenza vaccine 83.5%
14% better than State average

State average: 73.5%

Re-hospitalized after SNF stay Info Percentage of short-stay residents who were re-hospitalized after their nursing home admission. 27.7%
20% worse than State average

State average: 23.0%

Emergency department visits Info Percentage of short-stay residents who had an outpatient emergency department visit. 7.1%
39% better than State average

State average: 11.7%

Falls with major injury Info Percentage of SNF residents who experience falls with major injury during their stay. 1.0%
31% worse than State average

State average: 0.8%

Ability to care for self at discharge Info Percentage of residents at or above expected ability to care for themselves at discharge. 18.3%
66% worse than State average

State average: 53.7%

Successful return to home or community Info Rate of successful return to home or community from a skilled nursing facility. 44.5%
12% worse than State average

State average: 50.6%

Facility Characteristics

Source: CMS Long-Term Care Facility Characteristics (Data as of Jan 2026)

Total residents 100
Medicare
15
15% of residents
Medicaid
59
59% of residents
Private pay or other
26
26% of residents
Programs & Services
Residents Group

Residents meet regularly to discuss policies, care quality, and activities

CCRC

Part of a Continuing Care Retirement Community offering multiple care levels

Active Resident Council

Organized group of residents that meets regularly to discuss facility policies, quality of life, and activities.

Places of interest near Meadowbrook Rehabilitation Hospital

Address 1.7 miles from city center Info Estimated distance in miles from Gardner's city center to Meadowbrook Rehabilitation Hospital's address, calculated via Google Maps.

Calculate Travel Distance to Meadowbrook Rehabilitation Hospital

Add your location

Address

Compare Nursing Homes around the area

The information below is reported by the Kansas Department for Aging and Disability Services.

Lexington Park Assisted Living
NH
AL
IL
SNF
Topeka (West Southwest 2) -60 A+ 60 studio / 1 bed
Larksfield Place Independent Living
NH
AL
IL
MC
RC
SNF
Wichita -80 A+ 32 -
Brewster Place
NH
AL
IL
MC
RC
SNF
Topeka (South/Southeast 1) -141 A+ 56 -
Aberdeen Village
NH
AL
IL
MC
SNF
Olathe (Aberdeen Village) -60 - 45 -
Meadowbrook Rehabilitation Hospital
NH
SNF
Gardner -124 A+ 1 -

Frequently Asked Questions about Meadowbrook Rehabilitation Hospital

Who is the owner of Meadowbrook Rehabilitation Hospital?

Meadowbrook Rehabilitation Hospital is legally operated by Recover-Care Meadowbrook Rehabilitation LLC, and administered by Musu Jawara.

Is Meadowbrook Rehabilitation Hospital in a walkable area?

Meadowbrook Rehabilitation Hospital has a walk score of 1. Car-dependent. Most errands require a car, with limited nearby walkable options.

What is the license number of Meadowbrook Rehabilitation Hospital?

According to KS state health department records, Meadowbrook Rehabilitation Hospital's license number is 175130.

What is the occupancy rate at Meadowbrook Rehabilitation Hospital?

Meadowbrook Rehabilitation Hospital's occupancy is 88%.

Does Meadowbrook Rehabilitation Hospital operate as a for-profit or non-profit?

Meadowbrook Rehabilitation Hospital is registered as a for-profit in KS.

Who is the administrator of Meadowbrook Rehabilitation Hospital?

Musu Jawara is the administrator of Meadowbrook Rehabilitation Hospital.

How many beds does Meadowbrook Rehabilitation Hospital have?

Meadowbrook Rehabilitation Hospital has 124 beds.

Guides for Better Senior Living

Care Cost Calculator: See Prices in Your Area

Nursing Home Data Explorer

Don’t Wait Too Long: 7 Red Flag Signs Your Parent Needs Assisted Living Now

The True Cost of Assisted Living in 2025 – And How Families Are Paying For It

Understanding Senior Living Costs: Pricing Models, Discounts & Financial Assistance