Fairpark Health and Rehabilitation
CMS overall rating Info CMS (the Centers for Medicare & Medicaid Services) is the federal agency that rates nursing home quality. Its Overall Rating runs from 1 to 5 stars, combining health inspections, staffing, and quality measures, with inspections weighted most heavily.

Fairpark Health and Rehabilitation

CMS overall rating Info CMS (the Centers for Medicare & Medicaid Services) is the federal agency that rates nursing home quality. Its Overall Rating runs from 1 to 5 stars, combining health inspections, staffing, and quality measures, with inspections weighted most heavily.
Calculator: See prices in your area
Fairpark Health and Rehabilitation accepts Medicare, Medicaid, and private pay.

Overview of Fairpark Health and Rehabilitation

Fairpark Health and Rehabilitation is a 75-bed nursing home in Maryville, Tennessee, offering skilled nursing and rehabilitation services. Managed by Clearview Healthcare Management TN LLC under the ownership of Tn M53 Spe Opco Holdco LLC, which is part of the Simcha Hyman and Naftali Zanziper network, the community has maintained Medicare and Medicaid certification since 1992. Medicare, Medicaid, and private pay are all accepted.

The occupancy rate is 91.5%, which is significantly higher than the Tennessee state average of 73%. This suggests strong demand and limited availability. The average stay lasts 216 days, and the resident population is largely composed of those using private insurance or Medicaid, reflecting a focus on extended residential support alongside temporary recovery stays.

The current two-star CMS rating for the community presents a varied perspective on its operations. Health review scores are about 31.5% lower than the state average, and personnel levels are 59.2% below the Tennessee benchmark. This ranks the community 135th out of 137 nursing homes in the state for adjusted caregiver time, which may be a point of consideration for families. Daily nursing time averages 2 hours and 32 minutes per resident, compared to the state average of 3 hours and 40 minutes, with lower numbers noted for registered nurses, practical nurses, and assistants.

Additionally, staff turnover stands at 59.7%, which is higher than the state average of 48.7%. However, a significant strength is found in clinical quality metrics, where the community performs 34% better than the state average, earning a five-star score in that specific category for the older adults living there.

The regulatory history includes 15 findings over the last three inspections, largely influenced by a significant complaint review in August 2023. That investigation identified two high-priority concerns regarding resident protection and the execution of care plans, resulting in a fine. While the community was previously considered for the federal Special Focus Facility program, current data indicate it is no longer on that list, signaling that improvements were made.

More recent reviews in 2024 and 2025 identified fewer concerns, primarily related to equipment upkeep, food service, and infection management, all of which were categorized as having the potential for harm but resulting in no actual injury to residents. No further financial penalties or payment halts have been recorded since the 2023 incident.

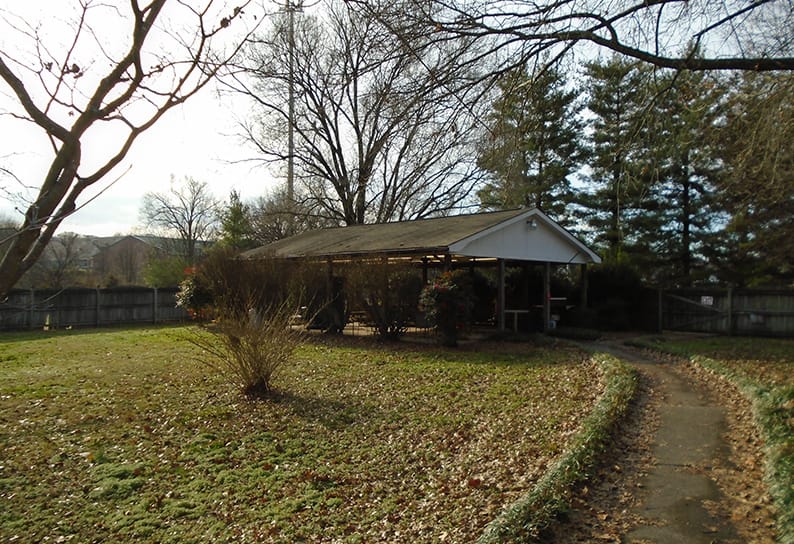
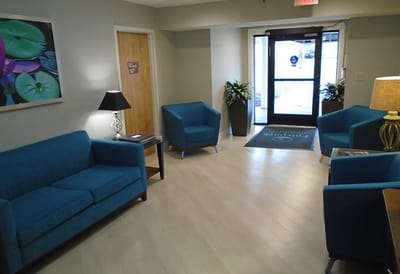
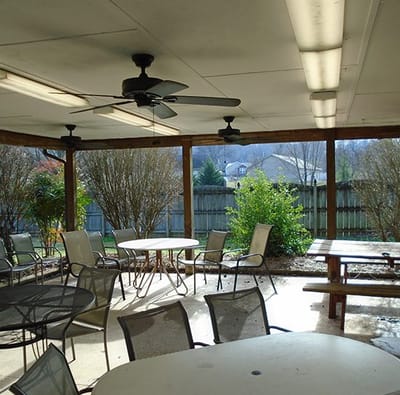
Medical offerings include physical, speech, and occupational therapies, as well as specialized wound management and long-term nursing. Memory support, end-of-life care, and transition planning are also provided. Amenities include a variety of activities, a hair salon, an outdoor patio, therapeutic animal visits, and spiritual services.

Fairpark Health and Rehabilitation is an ideal option for families in the Maryville and Blount County region looking for long-term nursing or memory support with a record of positive clinical results.

Quality ratings

Measured by Centers for Medicare & Medicaid Services (CMS)

Overall rating Info The Overall CMS Rating combines results from health inspections, staffing levels and quality measures. Health inspections carry the most weight. Staffing and quality scores can increase or decrease the final rating based on performance compared to state and national standards.
▼ 34.6% Below TN avg. ▼ 34.6% Below TN avg.Click the badge to see the full State ranking.Click here to see the full State ranking.
Health Inspection Info Based on the results of the facility's three most recent standard inspections and any complaint investigations. CMS reviews the number, scope, and severity of deficiencies, with more recent findings weighted more heavily.
▼ 31.5% Below TN avg. ▼ 31.5% Below TN avg.Click the badge to see the full State ranking.Click here to see the full State ranking.
Staffing Info Measures average nursing staff hours per resident per day, including Registered Nurses (RNs) and total nursing staff. Ratings are adjusted based on the level of care residents require and are compared to state and national benchmarks.
▼ 59.2% Below TN avg. ▼ 59.2% Below TN avg.Click the badge to see the full State ranking.Click here to see the full State ranking.
Quality Measures Info Based on clinical and physical health indicators reported to CMS, such as hospital readmissions, falls, pressure ulcers, and improvements in mobility. These measures reflect how well residents' health needs are being managed.
▲ 34.0% Above TN avg. ▲ 34.0% Above TN avg.Click the badge to see the full State ranking.Click here to see the full State ranking.

Staffing hours breakdown

Info Daily nursing hours per resident by staff type, reported to CMS. Higher is generally better — compare this facility to state and national averages to see where staffing stands.

Hours per resident per day — compared to Tennessee state averages

Total nursing care / resident Info This home is ranked 169th out of 172 homes in Tennessee for nurse hours. Total adjusted nursing hours per resident per day, combining RN, LPN, and aide time. CMS adjusts this for case-mix so facilities can be fairly compared.
2h 32m per day
Rank #169 / 172Nurse hours — State benchmarkedThis home is ranked 169th out of 172 homes in Tennessee for nurse hours. Shows adjusted nurse hours per resident per day benchmarked to the Tennessee average, with a ranking across 172 Tennessee SNFs. More hours mean more direct care. The national average is about 3.5 hrs; below 3.0 is a red flag.Click the rank badge to see the full State ranking.Click here to see the full State ranking.
This facility Tennessee avg (3h 40m per day)
vs Tennessee avg
-31%

6 of 6 metrics below state avg

Staff typeHours / Day / Residentvs state avg
Registered Nurse (RN) Info RNs hold the highest nursing license and can assess residents, interpret test results, and direct care plans. More RN hours per day often signals stronger clinical oversight and faster response to health changes. 33m per day ▼ 11% State avg: 37m per day · National avg: 41m per day
LPN / LVN Info Licensed Practical Nurses (LPNs) or Licensed Vocational Nurses (LVNs) deliver routine hands-on care — medication administration, wound dressing, and monitoring vital signs. They work under RN supervision and make up a large share of daily bedside care. 41m per day ▼ 37% State avg: 1h 5m per day · National avg: 52m per day
Nurse Aide Info Certified Nurse Aides (CNAs) provide the most direct day-to-day assistance: bathing, dressing, feeding, and mobility. Nurse aide hours are typically the largest staffing category and directly affect residents' quality of life. 1h 25m per day ▼ 34% State avg: 2h 9m per day · National avg: 2h 20m per day
Weekend Total Nursing Info Combined nursing hours (RN + LPN + Nurse Aide) per resident per day on weekends. Staffing often drops on weekends — this figure reveals whether the facility maintains adequate coverage outside of weekday hours. 2h 11m per day ▼ 35% State avg: 3h 21m per day · National avg: 3h 26m per day
Physical Therapist Info Hours per resident per day provided by licensed Physical Therapists (PTs) or PT Assistants. PT services help residents recover mobility after injury or illness and are especially important for post-acute (short-stay) rehabilitation. 1m per day ▼ 80% State avg: 5m per day · National avg: 4m per day
Weekend RN Info Registered nurse hours specifically on weekends. Facilities sometimes reduce RN presence on Saturdays and Sundays — a low weekend RN figure compared to weekday hours can indicate reduced clinical oversight when most administrative staff are absent. 16m per day ▼ 33% State avg: 24m per day · National avg: 28m per day

Capacity and availability

This home usually has limited availability

Higher occupancy than the Tennessee average: 73%
Occupancy rate
91.5% Rank #50 / 303Occupancy rate — State benchmarkedThis home is ranked 50th out of 303 homes in Tennessee for occupancy rate. Shows this facility's occupancy rate versus the Tennessee average, with its Statewide rank out of 303. Higher occupancy signals strong local demand and financial stability.Click the rank badge to see the full State ranking.Click here to see the full State ranking.
Avg. Length of Stay
216 days
Bed community size
75-bed community Rank #228 / 427Bed count — State benchmarkedThis home is ranked 228th out of 427 homes in Tennessee for bed count. Shows this facility's certified or reported bed count compared to other Tennessee SNFs. Larger communities may offer more amenities, programs, and on-site services for residents and families.Click the rank badge to see the full State ranking.Click here to see the full State ranking.
A moderately sized community that may balance personal attention with shared amenities and social activities.
Years in operation
33 years in operation Rank #67 / 385Years in operation — State benchmarkedThis home is ranked 67th out of 385 homes in Tennessee for years in operation. Shows how long this facility has been in operation compared to other Tennessee SNFs. Longer operating histories may benefit residents, families, and staff.Click the rank badge to see the full State ranking.Click here to see the full State ranking.
A longer operating history, which may indicate experience navigating regulations and delivering ongoing care.
Walk Score
Walk Score: 0 / 100 Rank #532 / 554Walk Score — State benchmarkedThis home is ranked 532nd out of 554 homes in Tennessee for walk score. Shows how walkable this facility's neighborhood is compared to the average Walk Score across Tennessee SNFs. Higher scores benefit residents, families, and staff.Click the rank badge to see the full State ranking.Click here to see the full State ranking.
Car-dependent. Most errands require a car, with limited nearby walkable options.

About this community

License Details

Facility TypeNursing Home
StatusLicensed
IssuanceJuly 1, 1992
ExpirationJuly 8, 2026
License Number00000012

Ownership & Operating Entity

Fairpark Health and Rehabilitation is administrated by Amanda Overholt.

Owner NameMaryville Fairpark Opco, LLC

Therapy & Rehabilitation

1 service
Rehabilitation Services

Amenities & Lifestyle

On-Site Hair Salon
Wireless Internet
Beautiful Patio & Courtyard Area
Outside Community Groups
Religious Groups
Arts & Crafts
Holiday Celebrations
Musical Entertainment
Book Club
Smoke Area
Community Group Outing
Individualized Programming
Exercise
Volunteer Programming
Entertainment
Gardening Area
Pet Therapy
Crafts
Religious Services
Gardening Club
Specific ProgramsSpeech Therapy, Occupational Therapy, Physical Therapy, Advanced Wound Care, Discharge Planning Services, Hospice

Contact Fairpark Health and Rehabilitation

Inspection History

In Tennessee, the Department of Health, Division of Health Care Facilities performs unannounced inspections and investigations to ensure facilities provide high-quality resident care.

Since 2023 · 3 years of data 1 citation

Inspection Scorecard Info This scorecard compares key inspection, citation, and complaint metrics at this facility against the Tennessee state average. Metrics rated ≥15% worse than average are highlighted in red; those ≥15% better are highlighted in green.

Since 2023 vs. Tennessee state average
Overall vs. TN average 0 Worse No metrics in this bucket. 2 Better Metrics better than Tennessee average:
• Total citations (75% below)
• Citations per year (77% below)
Latest Inspection March 20, 2024

Citations Info Citations are formal regulatory issues recorded during state inspections.

This FacilityTN Averagevs. TN Avg
Total citations Info Formal regulatory issues recorded by inspectors across all inspection types. 14 This facility has 75% fewer total citations than a typical Tennessee nursing home (1 vs. TN avg 4).↓ 75% better
Citations per year Info Average citations per year since 2023. 0.31.3 This facility has 77% fewer citations per year than a typical Tennessee nursing home (0.3 vs. TN avg 1.3).↓ 77% better

Health Inspection History

Inspections since 2023
Total health inspections 3

Tennessee average 3.5


Last Health inspection on Jul 2025

Total health citations
15 Rank #88 / 176Health citations — State benchmarkedThis home is ranked 88th out of 176 homes in Tennessee for health citations. Shows this facility's total health deficiency citations benchmarked to the Tennessee State average, with a ranking across all 176 TN SNFs. Lower citation counts earn a better rank.Click the rank badge to see the full State ranking.Click here to see the full State ranking.

Tennessee average 15.4

Citations per inspection
5 Rank #109 / 176Citations per inspection — State benchmarkedThis home is ranked 109th out of 176 homes in Tennessee for citations per inspection. Shows average deficiency citations per CMS inspection for this facility versus the Tennessee mean across 176 SNFs with citation data. Lower is better.Click the rank badge to see the full State ranking.Click here to see the full State ranking.

Tennessee average 4.39


Health citations are formal notices following inspections when they fail to comply with safety and care standards.

12 of 15 citations resulted from standard inspections; and 3 of 15 resulted from complaint investigations.

Breakdown of citation severity (last 3 years)
Critical health citations
2
82% worse than Tennessee average

Tennessee average: 1.1


Serious health citations
0
100% better than Tennessee average

Tennessee average: 0.6

2 critical citations Tennessee average: 1.1

0 serious citations Tennessee average: 0.6

13 moderate citations Tennessee average: 13.7

0 minor citations Tennessee average: 0.1
Citations history (last 3 years)
Infection Control moderate citation Jul 01, 2025
Corrected

Nutrition moderate citation Jul 01, 2025
Corrected

Quality of Care moderate citation Jul 01, 2025
Corrected

Care Planning moderate citation Jul 01, 2025
Corrected

Staffing Data

Reporting period: October 1 – December 31, 2025 (Q4 2025). Source: CMS Payroll-Based Journal report.

Total staff 100
Employees 79
Contractors 21
Staff to resident ratio 1.41 : 1
19% fewer staff per resident than Tennessee average
Tennessee average ratio: 1.75 : 1 Tennessee average ratio: 1.75 : 1See full Tennessee ranking
Avg staff/day 29
Average shift 7.6 hours
8% worse than Tennessee average
Tennessee average: 8.3 hours Tennessee average shift: 8.3 hoursSee full Tennessee ranking
Total staff hours (quarter) 20,168

Nursing staff breakdown

Q4 2025 · Oct 1 – Dec 31 More info This data comes from the CMS Payroll-Based Journal report covering October 1 – December 31, 2025.
Registered Nurse

Manages medical care and health needs.

RN Staff Info All 11 RN Staff are full-time employees. No contractors work on this role. 11
Average shift length Info Average shift length. Calculated as total hours divided by days worked and average staff per day. 7.7 hours
Licensed Practical Nurse

Assists with medical care and medications.

LPN Staff Info All 16 LPN Staff are full-time employees. No contractors work on this role. 16
Average shift length Info Average shift length. Calculated as total hours divided by days worked and average staff per day. 8.7 hours
Certified Nursing Assistant

Helps with daily care and mobility.

CNA Staff Info All 40 CNA Staff are full-time employees. No contractors work on this role. 40
Average shift length Info Average shift length. Calculated as total hours divided by days worked and average staff per day. 7.7 hours

Contractor staffing

Q4 2025 · Oct 1 – Dec 31 More info This data comes from the CMS Payroll-Based Journal report covering October 1 – December 31, 2025.

Total hours from contractors

10.7%

2,154 contractor hours this quarter

Speech Language Pathologist: 6 Physical Therapy Aide: 5 Physical Therapy Assistant: 4 Respiratory Therapy Technician: 3 Qualified Social Worker: 3

Staff by category

Q4 2025 · Oct 1 – Dec 31 More info This data comes from the CMS Payroll-Based Journal report covering October 1 – December 31, 2025.
Certified Nursing Assistant400407,61892100%7.7
Licensed Practical Nurse160164,65692100%8.7
Registered Nurse110111,99192100%7.7
Clinical Nurse Specialist5051,0907480%6.3
Physical Therapy Aide0559457278%7
Speech Language Pathologist0668017278%5.9
Dietitian2027147278%7.7
Administrator1015206571%8
Nurse Practitioner1014976470%7.8
Medication Aide/Technician1014786267%7.7
Mental Health Service Worker1014435863%7.6
Physical Therapy Assistant0442573841%6.8
Respiratory Therapy Technician033833235%2.6
Qualified Social Worker033692628%2.6
Other Dietary Services Staff101811%8.3
40 Certified Nursing Assistant
% of Days 100%
16 Licensed Practical Nurse
% of Days 100%
11 Registered Nurse
% of Days 100%
5 Clinical Nurse Specialist
% of Days 80%
5 Physical Therapy Aide
% of Days 78%
6 Speech Language Pathologist
% of Days 78%
2 Dietitian
% of Days 78%
1 Administrator
% of Days 71%
1 Nurse Practitioner
% of Days 70%
1 Medication Aide/Technician
% of Days 67%
1 Mental Health Service Worker
% of Days 63%
4 Physical Therapy Assistant
% of Days 41%
3 Respiratory Therapy Technician
% of Days 35%
3 Qualified Social Worker
% of Days 28%
1 Other Dietary Services Staff
% of Days 1%

Penalties and fines

Includes penalties issued in 2023

Federal penalties imposed by CMS for regulatory violations, including civil money penalties (fines) and denials of payment for new Medicare/Medicaid admissions.

Source: CMS Penalties Database (Data as of Jan 2026)

Total fines amount $28K Rank #142 / 177Federal fines — State benchmarkedThis home is ranked 142nd out of 177 homes in Tennessee for federal fines. Shows this facility's cumulative CMS federal fine dollars versus the Tennessee average among facilities with fines, and where it ranks among 177 skilled nursing facilities in the pool. Lower total dollars mean a better rank.Click the rank badge to see the full State ranking.Click here to see the full State ranking.
68% lower than Tennessee average

Tennessee average: $86K

Number of fines 1
43% fewer fines than Tennessee average

Tennessee average: 1.7

Payment Denials Info Serious action where Medicare and/or Medicaid temporarily stops payments for new residents until issues are fixed. 0
100% fewer payment denials than Tennessee average

Tennessee average: 0.5

Fines amount comparison
This facility $28K
Tennessee average $86K
Penalty History

Penalties are imposed by CMS for violations of federal nursing home regulations.

1 penalty in the past 3 years

Aug 12, 2023 · $28K

Civil Money Penalty Info Fines imposed for noncompliance, which can be assessed per day or per instance of violation. Aug 12, 2023
$28K

Last updated: Jan 2026

Quality of care over time

These measures show how residents usually do over time at this home, based on health outcomes and preventive care.

High-risk clinical events score Info A composite score based on pressure ulcers, falls with injury, weight loss, walking ability decline, and activities of daily living decline. 12.0
14% worse than Tennessee average

Tennessee average: 10.5

Functional decline score Info A composite score based on activities of daily living decline, walking ability decline, and incontinence. 19.5
In line with Tennessee average

Tennessee average: 19.5

Long-stay resident measures
Significantly above average Info CMS star rating based on long-stay quality measure performance. 5 stars = significantly above average, 1 star = significantly below average.
Need for Help with Daily Activities Increased Info Percent of long-stay residents whose need for help with daily activities has increased 19.4%
21% worse than Tennessee average

Tennessee average: 16.0%

Walking Ability Worsened Info Percent of long-stay residents whose ability to move independently worsened 20.8%
In line with Tennessee average

Tennessee average: 21.7%

Low Risk Residents with Bowel/Bladder Incontinence Info Percent of low risk long-stay residents who lose control of their bowels or bladder 18.4%
11% better than Tennessee average

Tennessee average: 20.7%

Falls with Major Injury Info Percent of long-stay residents experiencing one or more falls with major injury 5.6%
54% worse than Tennessee average

Tennessee average: 3.7%

High Risk Residents with Pressure Ulcers Info Percent of long-stay high risk residents with pressure ulcers 6.9%
26% worse than Tennessee average

Tennessee average: 5.4%

Urinary Tract Infection Info Percent of long-stay residents with a urinary tract infection 0.4%
82% better than Tennessee average

Tennessee average: 2.1%

Lost Too Much Weight Info Percent of long-stay residents who lose too much weight 7.2%
14% worse than Tennessee average

Tennessee average: 6.3%

Depressive Symptoms Info Percent of long-stay residents who have depressive symptoms 22.8%
107% worse than Tennessee average

Tennessee average: 11.0%

Antipsychotic Use Info Percent of long-stay residents who received an antipsychotic medication 5.0%
70% better than Tennessee average

Tennessee average: 16.5%

Pneumococcal Vaccine Info Percent of long-stay residents assessed and appropriately given the pneumococcal vaccine 90.2%
In line with Tennessee average

Tennessee average: 89.9%

Influenza Vaccine Info Percent of long-stay residents assessed and appropriately given the seasonal influenza vaccine 97.4%
In line with Tennessee average

Tennessee average: 94.5%

Short-stay resident measures
Pneumococcal Vaccine Info Percent of short-stay residents assessed and appropriately given the pneumococcal vaccine 76.5%
In line with Tennessee average

Tennessee average: 79.7%

Antipsychotic medication increase Info Percent of short-stay residents who newly received an antipsychotic medication 0.0%
100% better than Tennessee average

Tennessee average: 1.7%

Influenza Vaccine Info Percent of short-stay residents assessed and appropriately given the seasonal influenza vaccine 91.7%
15% better than Tennessee average

Tennessee average: 79.8%

Breakdown by payment type

Medicare

22% of new residents, usually for short-term rehab.

Typical stay 26 days

Private pay

47% of new residents, often for short stays.

Typical stay 1 - 2 months

Medicaid

30% of new residents, often for long-term daily care.

Typical stay 1 - 2 years

Facility Characteristics

Source: CMS Long-Term Care Facility Characteristics (Data as of Jan 2026)

Total residents 71
Medicare
1
1.4% of residents
Medicaid
45
63.4% of residents
Private pay or other
25
35.2% of residents
Programs & Services
Residents Group

Residents meet regularly to discuss policies, care quality, and activities

Active Resident Council

Organized group of residents that meets regularly to discuss facility policies, quality of life, and activities.

Finances and operations

Privately-owned community
Operated by a business corporation.
Home revenue
$7.4M
Profit
$376.5K
Privately-owned community Operated by a business corporation.
Home revenue
$7.4M Rank #150 / 176Revenue — State benchmarkedThis home is ranked 150th out of 176 homes in Tennessee for revenue. Shows this facility's annual revenue compared to the Tennessee SNF average. Higher revenue generally means more resources for staffing and capital — read alongside Payroll %.Click the rank badge to see the full State ranking.Click here to see the full State ranking.
Profit
$376.5K
Payroll costs Info The portion of the home's budget spent on staff, including nurses, caregivers, and other employees who support care and operations. Rank #154 / 176Payroll — State benchmarkedThis home is ranked 154th out of 176 homes in Tennessee for payroll. Shows total annual staff payroll benchmarked to the Tennessee average. Higher payroll investment relative to peers often signals better staffing and less reliance on cheaper contract labor.Click the rank badge to see the full State ranking.Click here to see the full State ranking.
$2.9M
39.7% of revenue Rank #120 / 176Payroll % — State benchmarkedThis home is ranked 120th out of 176 homes in Tennessee for payroll %. Shows payroll as a percentage of revenue versus the Tennessee average. Well-run Tennessee SNFs typically land around 50–60% — the top third Statewide. Below 25% may signal understaffing or heavy agency use — read with Staffing ratings.Click the rank badge to see the full State ranking.Click here to see the full State ranking.
Other operating costs Info All remaining costs needed to run the home, such as food, utilities, building maintenance, supplies and administrative expenses.
$4.1M
Total costs $7.0M

Who this home usually serves

TYPE OF STAY

Mostly long-term care residents

Most residents stay for extended periods and receive ongoing daily care.

Places of interest near Fairpark Health and Rehabilitation

Address 3.8 miles from city center Info Estimated distance in miles from Maryville's city center to Fairpark Health and Rehabilitation's address, calculated via Google Maps.

Calculate Travel Distance to Fairpark Health and Rehabilitation

Add your location

Address

Financial Assistance for
Nursing Home in Tennessee

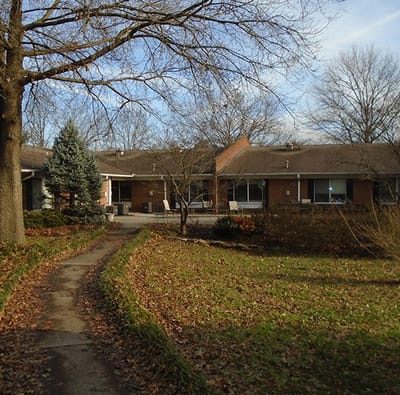
Fairpark Health and Rehabilitation is located in Maryville, Tennessee.
Here are the financial assistance programs available to residents in Tennessee.

Get Financial aid guidance

CHOICES Program

TN Medicaid CHOICES

Age 65+ or disabled
General Tennessee resident, Medicaid-eligible, nursing home-level care need.
Income Limits (2025) ~$2,829/month 300% FBR, individual
Asset Limits $2,000 (individual), $3,000 (couple).
TN

Managed care model; high rural demand.

Benefits
Personal care (5-7 hours/day) Respite (240 hours/year) Adult day care ($65/day) Home modifications ($1,500 avg.)

Tennessee Options for Community Living

TN Options

Age 60+
General Tennessee resident, at risk of nursing home.
Income Limits ~$2,000/month individual, varies
Asset Limits $5,000 individual
TN

Limited funding; rural/urban balance.

Benefits
In-home care (3-5 hours/week) Respite (up to 10 days/year) Transportation (~5 trips/month)

Medicare Savings Program (MSP)

Tennessee Medicare Savings Program

Age 65+ or disabled
General TN resident, Medicare Part A/B.
Income Limits (2025) ~$2,510/month (QMB), ~$3,380/month (SLMB), ~$3,598/month (QI)—individual.
Asset Limits $9,430 (individual), $14,130 (couple).
TN

Three tiers; includes Extra Help for Part D; no waitlist.

Benefits
Covers Part B premiums ($174.70/month) Deductibles ($240/year) Copays (~20%)

Family Caregiver Support Program (FCSP)

Tennessee Family Caregiver Support Program

Age
General Caregivers of 60+ needing care or 55+ caregivers of others; TN resident; functional needs (2+ ADLs).
Income Limits (2025) No strict cap; prioritizes low-income ~$24,980/year
Asset Limits Not assessed; need-based.
TN

Includes grandparent caregivers; high rural demand.

Benefits
Respite (4-6 hours/week or 5 days/year) Adult day care ($60/day) Training Supplies (~$500/year)

VA Aid and Attendance (A&A) and Housebound Benefits

Tennessee VA Aid and Attendance/Housebound

Age 65+ or disabled veteran/spouse
General TN resident, wartime service, need for ADL help (A&A) or homebound.
Income Limits (2025) Net income < ~$1,984/month (veteran with dependent, A&A); pension offsets income.
Asset Limits ~$155,356 net worth limit
TN

High veteran population; supports rural/urban care needs.

Benefits
Cash (~$1,433-$2,642/month veteran, ~$951-$1,318 spouse) for care costs (e.g., in-home, assisted living)

Elderly Nutrition Program

Tennessee Elderly Nutrition Program

Age 60+
General TN resident; no income limit but prioritizes low-income.
Income Limits (2025) None; donations encouraged.
Asset Limits Not assessed.
TN

Serves ~50,000 annually; 200+ congregate sites plus Meals on Wheels.

Benefits
Congregate meals ($5-$7/meal value) at senior centers Home-delivered meals ($5-$7/meal)

Property Tax Relief Program

Tennessee Property Tax Relief Program

Age 65+
General TN resident, homeowner/renter (or widow/er 50+, disabled 18+).
Income Limits (2025) ~$45,000/year household, excludes half of Social Security
Asset Limits Not assessed; income-focused.
TN

Rebates up to $1,000; serves ~100,000 annually.

Benefits
Tax rebates (~$250-$1,000 based on income; e.g., $1,000 if income < $8,000)

Frequently Asked Questions about Fairpark Health and Rehabilitation

Who is the owner of Fairpark Health and Rehabilitation?

The legal owner and operator of Fairpark Health and Rehabilitation is Maryville Fairpark Opco, LLC.

What is the license number of Fairpark Health and Rehabilitation?

According to TN state health department records, Fairpark Health and Rehabilitation's license number is 00000012.

When does Fairpark Health and Rehabilitation's license expire?

According to TN state health department records, Fairpark Health and Rehabilitation's license expires on July 8, 2026.

Who is the administrator of Fairpark Health and Rehabilitation?

Amanda Overholt is the administrator of Fairpark Health and Rehabilitation.

How many beds does Fairpark Health and Rehabilitation have?

Fairpark Health and Rehabilitation has 75 beds.

Are there photos of Fairpark Health and Rehabilitation?

Yes — there are 8 photos of Fairpark Health and Rehabilitation in the photo gallery on this page.

What is the address of Fairpark Health and Rehabilitation?

Fairpark Health and Rehabilitation is located at 307 North Fifth Street.

Guides for Better Senior Living

Care Cost Calculator: See Prices in Your Area

Nursing Home Data Explorer

Don’t Wait Too Long: 7 Red Flag Signs Your Parent Needs Assisted Living Now

The True Cost of Assisted Living in 2025 – And How Families Are Paying For It

Understanding Senior Living Costs: Pricing Models, Discounts & Financial Assistance

Explore Open Rooms
1 Contact details
2 What type of senior care service are you looking for?
3 What budget do you have in mind for senior care?
4 How soon do you need to find care?
5 Additional details

Thank you for your interest!

Our team will be in touch shortly to help with next steps.