


Total health inspections
3
Montana average 5.1
Last Health inspection on Feb 2025
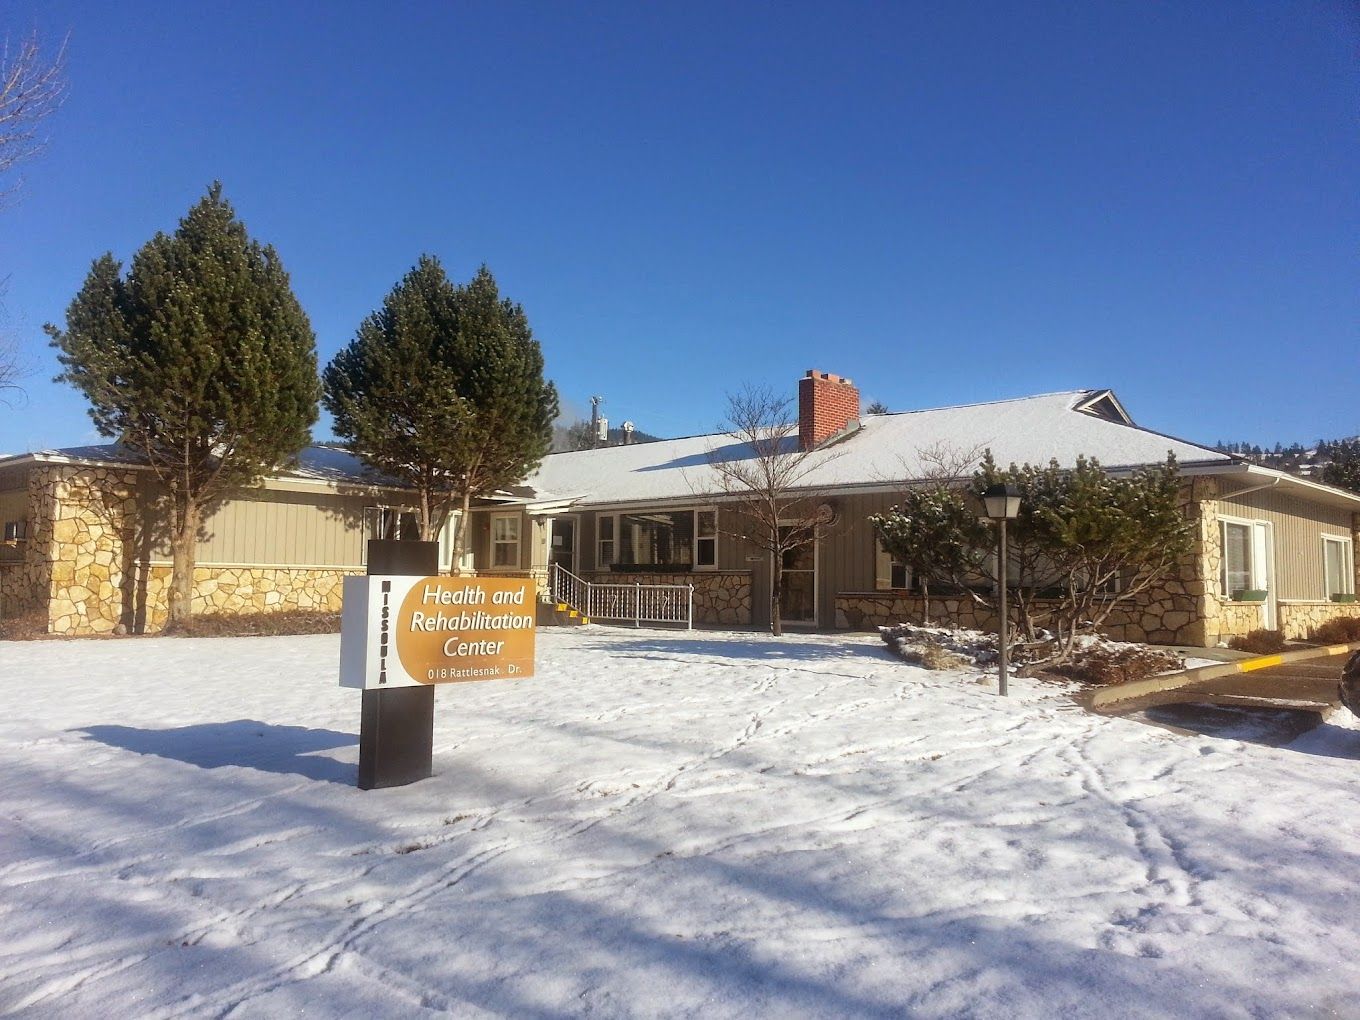
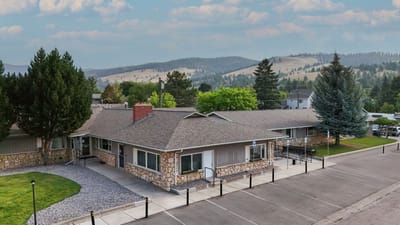

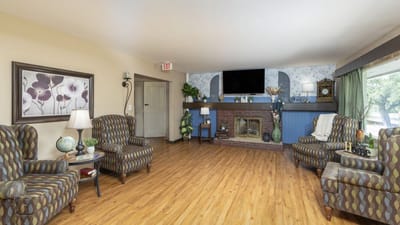

Missoula Health and Rehabilitation Center has been part of its Rattlesnake Dr neighborhood for 17 years now, a 49-bed nursing home tucked into a stretch of Missoula where you pretty much need a car to get anywhere. Right now it’s running at 80 percent occupancy, and the average resident stays close to six months, 179 days to be exact.
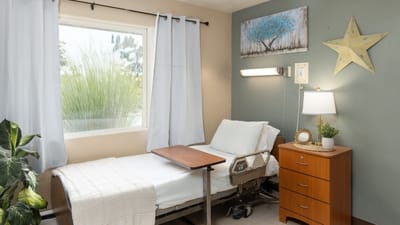
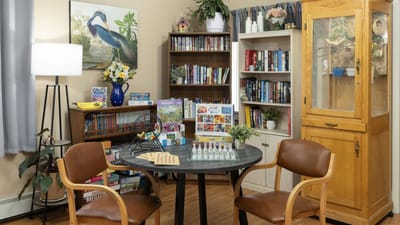
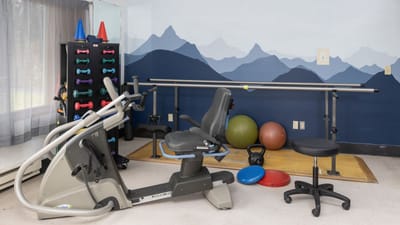
The clinical side of things centers on rehabilitation. Residents have access to rehabilitation services, respite care, and short-term rehab, the kind of support that matters whether someone’s recovering from a hip replacement or settling in for longer-term nursing care. Nursing staff put in an average of 4 hours and 15 minutes of total nursing care per resident each day, which gives a sense of how much hands-on attention is built into the daily rhythm here. A wellness program rounds out the picture.
Coverage-wise, the facility takes Medicare, Medicaid, and private pay, so families have options no matter where they are in figuring out how to fund care. Rebecca Davis administers the facility, and Karrie Holt holds the Executive Director role.
Montana’s Department of Public Health and Human Services, Quality Assurance Division, handles inspections statewide, and here those inspections have tended to circle back to medication management, infection control, and food service rather than anything tied to direct hands-on resident care.
Put together, this is a smaller nursing home built around rehabilitation and sustained nursing support, the kind of place suited to someone who needs real clinical attention day to day, not just a place to land.
| Staff type | Hours / Day / Resident | vs state avg |
|---|---|---|
|
Registered Nurse (RN)
| 39m per day | ▼ 30% State avg: 56m per day · National avg: 41m per day |
|
LPN / LVN
| 59m per day | ▲ 96% State avg: 30m per day · National avg: 52m per day |
|
Nurse Aide
| 2h 14m per day | ▼ 12% State avg: 2h 32m per day · National avg: 2h 21m per day |
|
Weekend Total Nursing
| 3h 26m per day | ■ Avg State avg: 3h 29m per day · National avg: 3h 26m per day |
|
Physical Therapist
| 0m per day | ▼ 100% State avg: 4m per day · National avg: 4m per day |
|
Weekend RN
| 16m per day | ▼ 61% State avg: 41m per day · National avg: 29m per day |
Missoula Health and Rehabilitation Center is administered by Rebecca Davis.
Key information about the people who lead and staff this community.
In Montana, the Department of Public Health and Human Services, Quality Assurance Division is the state body responsible for inspecting and licensing all senior residential care facilities.
Deficiencies
| This Facility | MT Average | vs. MT Avg |
|---|---|---|---|
|
Total deficiencies
| 37 | 21 | This facility has 76% more total deficiencies than a typical Montana nursing home (37 vs. MT avg 21).↑ 76% worse |
Montana average 5.1
Last Health inspection on Feb 2025
Montana average 29.7
Montana average 5.72
Health citations are formal notices following inspections when they fail to comply with safety and care standards.
31 of 34 citations resulted from standard inspections; and 3 of 34 came from combined inspections (standard and complaint).
Montana average: 0.3
Montana average: 2.2
Reporting period: October 1 – December 31, 2025 (Q4 2025). Source: CMS Payroll-Based Journal report.
Manages medical care and health needs.
Assists with medical care and medications.
Helps with daily care and mobility.
Total hours from contractors
460 contractor hours this quarter
| Certified Nursing Assistant | 28 | 13 | 41 | 6,761 | 92 | 100% | 7.2 |
| Physical Therapist | 14 | 0 | 14 | 2,711 | 92 | 100% | 6.3 |
| Licensed Practical Nurse | 7 | 1 | 8 | 2,402 | 91 | 99% | 7.8 |
| Registered Nurse | 6 | 0 | 6 | 910 | 72 | 78% | 9 |
| RN Director of Nursing | 2 | 0 | 2 | 909 | 75 | 82% | 7.3 |
| Clinical Nurse Specialist | 3 | 0 | 3 | 812 | 69 | 75% | 7 |
| Occupational Therapy Aide | 2 | 0 | 2 | 777 | 78 | 85% | 6.8 |
| Nurse Aide in Training | 5 | 0 | 5 | 764 | 65 | 71% | 6.8 |
| Other Dietary Services Staff | 4 | 0 | 4 | 735 | 67 | 73% | 7.4 |
| Administrator | 1 | 0 | 1 | 496 | 62 | 67% | 8 |
| Nurse Practitioner | 1 | 0 | 1 | 493 | 61 | 66% | 8.1 |
| Mental Health Service Worker | 1 | 0 | 1 | 401 | 58 | 63% | 6.9 |
| Dietitian | 3 | 0 | 3 | 262 | 39 | 42% | 6.7 |
Federal penalties imposed by CMS for regulatory violations, including civil money penalties (fines) and denials of payment for new Medicare/Medicaid admissions.
Source: CMS Penalties Database
No penalties in the past 3 years
No civil money penalties or payment denials were reported in the last 3 years.
These measures show how residents usually do over time at this home, based on health outcomes and preventive care.
Montana average: 11.2
Montana average: 21.8
Montana average: 19.4%
Montana average: 20.8%
Montana average: 25.2%
Montana average: 4.3%
Montana average: 6.3%
Montana average: 2.8%
Montana average: 6.1%
Montana average: 4.7%
Montana average: 19.1%
Montana average: 93.8%
Montana average: 93.7%
Montana average: 1.27
Montana average: 2.17
Montana average: 76.4%
Montana average: 1.8%
Montana average: 73.8%
Montana average: 19.4%
Montana average: 15.0%
Montana average: 0.8%
Montana average: 53.7%
Montana average: 50.6%
Quality measures are calculated from Minimum Data Set (MDS) assessments. For most measures, lower percentages indicate better care quality.
40% of new residents, usually for short-term rehab.
30% of new residents, often for short stays.
30% of new residents, often for long-term daily care.
Source: CMS Long-Term Care Facility Characteristics (Data as of Jan 2026)
Residents meet regularly to discuss policies, care quality, and activities
State-approved Nurse Aide Training and Competency Evaluation Program on-site
Organized group of residents that meets regularly to discuss facility policies, quality of life, and activities.
Data sourced from CMS Long-Term Care Facility Characteristics quarterly report. Payer mix reflects the current resident census by primary payment source.
Historical financial and operational data for Missoula Health and Rehabilitation Center from 2011–2022, based on CMS SNF Cost Reports.
Key figures below are for fiscal year ending in 12/2022 — the home's most recent complete cost report, an older period than most facilities report.
Based on the home's most recent complete CMS SNF Cost Report — fiscal year ending in 12/2022. This is an older period than most facilities report, so compare with that in mind.
Most residents typically stay for a few weeks or months before returning home or moving on.
New residents most often arrive under Medicare (40% of admissions), and a typical Medicare stay runs around 1 months.
Coverage residents most often arrive under.
Coverage residents most often leave under.
![]() 2.6 miles from city center
2.6 miles from city center
![]() Estimated distance in miles from Missoula's city center to Missoula Health and Rehabilitation Center's address, calculated via Google Maps.
— 2.06 miles to nearest hospital (St. Patrick Hospital/General Hospital)
Estimated distance in miles from Missoula's city center to Missoula Health and Rehabilitation Center's address, calculated via Google Maps.
— 2.06 miles to nearest hospital (St. Patrick Hospital/General Hospital)
Add your location
Info below is compiled from CMS reports & the MT Dept. of Public Health & Human Services (DPHHS), senior community websites & trusted data sources such as Walk Score & BBB.
Communities are listed from highest to lowest based on our ranking methodology.
| The Living Centre | NH AL IL SNF | Stevensville (Main Street) | 50
Facility
50
MT AVG
70
Rank
#61 / 103 |
74.6%
Facility
74.6%
MT AVG
61.5
Rank
#14 / 32 | +21% | 4.87
Facility
4.87
MT AVG
4.53
Rank
#8 / 33 | -41% | +8% | $37.5k
Facility
$37.5k
MT AVG
$83.8k
Rank
#18 / 34 | 15
Facility
15
MT AVG
29.7
Rank
#4 / 34 | 2.5
Facility
2.5
MT AVG
5.7
Rank
#3 / 34 | 2 | 37 | A+ |
38
Facility
38
MT AVG
43
Rank
#90 / 159 | Living Centre Limited | $6.0MFiscal year ending 08/2024
Facility
$6.0MFiscal year ending 08/2024
MT AVG
$6.3M
Rank
#23 / 32 | $3.4MFiscal year ending 08/2024
Facility
$3.4MFiscal year ending 08/2024
MT AVG
$2.8M
Rank
#19 / 32 | 56.7%Fiscal year ending 08/2024
Facility
56.7%Fiscal year ending 08/2024
MT AVG
45.6%
Rank
#4 / 32 | 275125 | ||||
| Missoula Health and Rehabilitation Center | NH AL MC RC SNF | Missoula (Upper Rattlesnake) | 49
Facility
49
MT AVG
70
Rank
#62 / 103 | - | - | 4.24
Facility
4.24
MT AVG
4.53
Rank
#10 / 33 | -58% | -6% | $0
Facility
$0
MT AVG
$83.8k
Rank
#1 / 34 | 34
Facility
34
MT AVG
29.7
Rank
#20 / 34 | 11.3
Facility
11.3
MT AVG
5.7
Rank
#34 / 34 | - | 37 | - |
13
Facility
13
MT AVG
43
Rank
#131 / 159 | Pacific Northwest Snf Operations Holdings (Mt) LLC | $4.0M*Fiscal year ending 12/2022These figures are from this home's most recent complete cost report — an older period than most facilities report. Compare with that in mind.
Facility
$4.0M*Fiscal year ending 12/2022These figures are from this home's most recent complete cost report — an older period than most facilities report. Compare with that in mind.
MT AVG
$6.3M
Rank
#22 / 32 | $2.0M*Fiscal year ending 12/2022These figures are from this home's most recent complete cost report — an older period than most facilities report. Compare with that in mind.
Facility
$2.0M*Fiscal year ending 12/2022These figures are from this home's most recent complete cost report — an older period than most facilities report. Compare with that in mind.
MT AVG
$2.8M
Rank
#27 / 32 | 48.7%*Fiscal year ending 12/2022These figures are from this home's most recent complete cost report — an older period than most facilities report. Compare with that in mind.
Facility
48.7%*Fiscal year ending 12/2022These figures are from this home's most recent complete cost report — an older period than most facilities report. Compare with that in mind.
MT AVG
45.6%
Rank
#28 / 32 | 275035 | ||||
| Riverside Nursing and Rehabilitation Center | NH AL | Missoula (Heart Of Missoula) | 72
Facility
72
MT AVG
70
Rank
#42 / 103 |
91.1%
Facility
91.1%
MT AVG
61.5
Rank
#5 / 32 | +48% | 4.24
Facility
4.24
MT AVG
4.53
Rank
#10 / 33 | -23% | -6% | $65.1k
Facility
$65.1k
MT AVG
$83.8k
Rank
#26 / 34 | 30
Facility
30
MT AVG
29.7
Rank
#17 / 34 | 6.0
Facility
6.0
MT AVG
5.7
Rank
#22 / 34 | 1 | 66 | - |
42
Facility
42
MT AVG
43
Rank
#82 / 159 | David Smilovitz Trust | $8.1MFiscal year ending 12/2023
Facility
$8.1MFiscal year ending 12/2023
MT AVG
$6.3M
Rank
#17 / 32 | $4.0MFiscal year ending 12/2023
Facility
$4.0MFiscal year ending 12/2023
MT AVG
$2.8M
Rank
#7 / 32 | 49.6%Fiscal year ending 12/2023
Facility
49.6%Fiscal year ending 12/2023
MT AVG
45.6%
Rank
#6 / 32 | 275126 | ||||
| Hillside Health & Rehabilitation | - | NH PC RC SNF | Missoula (South 39Th Street) | 95
Facility
95
MT AVG
70
Rank
#30 / 103 | - | - | - | - | - | - | - | - | - | - | - | - | - | - |
39
Facility
39
MT AVG
43
Rank
#85 / 159 | $6.1M*Fiscal year ending 08/2021These figures are from this home's most recent complete cost report — an older period than most facilities report. Compare with that in mind.
Facility
$6.1M*Fiscal year ending 08/2021These figures are from this home's most recent complete cost report — an older period than most facilities report. Compare with that in mind.
MT AVG
$6.3M
Rank
#21 / 32 | $2.8M*Fiscal year ending 08/2021These figures are from this home's most recent complete cost report — an older period than most facilities report. Compare with that in mind.
Facility
$2.8M*Fiscal year ending 08/2021These figures are from this home's most recent complete cost report — an older period than most facilities report. Compare with that in mind.
MT AVG
$2.8M
Rank
#20 / 32 | 46.3%*Fiscal year ending 08/2021These figures are from this home's most recent complete cost report — an older period than most facilities report. Compare with that in mind.
Facility
46.3%*Fiscal year ending 08/2021These figures are from this home's most recent complete cost report — an older period than most facilities report. Compare with that in mind.
MT AVG
45.6%
Rank
#5 / 32 | 275027 |
Missoula Health and Rehabilitation Center is located in Missoula, Montana.
Here are the financial assistance programs available to residents in Montana.
Missoula Health and Rehabilitation Center is in the Upper Rattlesnake neighborhood of Missoula.
Missoula Health and Rehabilitation Center has a walk score of 13. Car-dependent. Most errands require a car, with limited nearby walkable options.
According to MT state health department records, Missoula Health and Rehabilitation Center's license number is 97.
According to MT state health department records, Missoula Health and Rehabilitation Center's license expires on February 28, 2027.
Missoula Health and Rehabilitation Center's occupancy is 80.4%.
Missoula Health and Rehabilitation Center has been operating for approximately 17 years, based on available licensing and registration records.
No, Missoula Health and Rehabilitation Center has a no-pet policy.
Care Cost Calculator: See Prices in Your Area
Nursing Home Data Explorer
Don’t Wait Too Long: 7 Red Flag Signs Your Parent Needs Assisted Living Now
The True Cost of Assisted Living in 2025 – And How Families Are Paying For It
Understanding Senior Living Costs: Pricing Models, Discounts & Financial Assistance


