Concordia Manor
Nursing Home, Nursing Care, Palliative Care & Respite Care · St. Petersburg, FL
CMS overall rating Info CMS (the Centers for Medicare & Medicaid Services) is the federal agency that rates nursing home quality. Its Overall Rating runs from 1 to 5 stars, combining health inspections, staffing, and quality measures, with inspections weighted most heavily.

Concordia Manor

Nursing Home, Nursing Care, Palliative Care & Respite Care · St. Petersburg, FL
CMS overall rating Info CMS (the Centers for Medicare & Medicaid Services) is the federal agency that rates nursing home quality. Its Overall Rating runs from 1 to 5 stars, combining health inspections, staffing, and quality measures, with inspections weighted most heavily.
Calculator: See prices in your area
Concordia Manor accepts Medicare, Medicaid, and private pay.

Overview of Concordia Manor

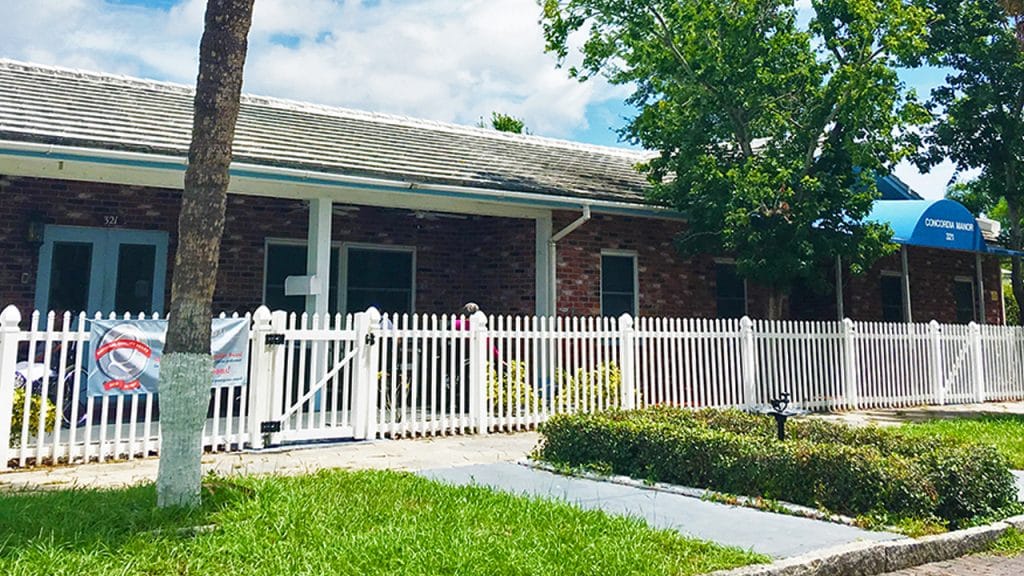
Tucked in the heart of St. Petersburg, Florida, lies Concordia Manor, a nonprofit facility dedicated to providing a nurturing home for seniors. With a focus on post-acute skilled nursing and rehab programs, this extraordinary residence not only cares for their residents’ physical needs but also takes the time to understand and cherish their individual stories. The genuine and heartfelt approach to senior care makes Concordia Manor a truly ideal and award-winning facility. Its tight-knit community and welcoming culture create a warm and inviting atmosphere, where residents can find comfort and companionship. 
With 39 beds, Concordia Manor maintains a sense of intimacy while ensuring each resident receives personalized attention. Impeccably clean and thoughtfully designed, this sanctuary becomes a home where seniors can truly thrive and create cherished memories. With a commitment to compassionate care and a genuine interest in the residents’ well-being, Concordia Manor exemplifies the heart of senior living, where every individual is celebrated.

Quality ratings

Measured by Centers for Medicare & Medicaid Services (CMS)

Overall rating Info The Overall CMS Rating combines results from health inspections, staffing levels and quality measures. Health inspections carry the most weight. Staffing and quality scores can increase or decrease the final rating based on performance compared to state and national standards.
▼ 68.5% Below FL avg. ▼ 68.5% Below FL avg.FL average: 3.2Click the badge to see the full State ranking.Click here to see the full State ranking.
Health Inspection Info Based on the results of the facility's three most recent standard inspections and any complaint investigations. CMS reviews the number, scope, and severity of deficiencies, with more recent findings weighted more heavily.
▼ 64.4% Below FL avg. ▼ 64.4% Below FL avg.FL average: 2.8Click the badge to see the full State ranking.Click here to see the full State ranking.
Staffing Info Measures average nursing staff hours per resident per day, including Registered Nurses (RNs) and total nursing staff. Ratings are adjusted based on the level of care residents require and are compared to state and national benchmarks.
▲ 18.2% Above FL avg. ▲ 18.2% Above FL avg.FL average: 3.4Click the badge to see the full State ranking.Click here to see the full State ranking.
Quality Measures Info Based on clinical and physical health indicators reported to CMS, such as hospital readmissions, falls, pressure ulcers, and improvements in mobility. These measures reflect how well residents' health needs are being managed.
▼ 1.4% Below FL avg. ▼ 1.4% Below FL avg.FL average: 4.1Click the badge to see the full State ranking.Click here to see the full State ranking.

Staffing hours breakdown

Info Daily nursing hours per resident by staff type, reported to CMS. Higher is generally better — compare this facility to state and national averages to see where staffing stands.

Hours per resident per day — compared to Florida state averages

Total nursing care / resident Info This home is ranked 145th out of 253 homes in Florida for nurse hours. Total adjusted nursing hours per resident per day, combining RN, LPN, and aide time. CMS adjusts this for case-mix so facilities can be fairly compared.
3h 50m per day
Rank #145 / 253Nurse hours — State benchmarkedThis home is ranked 145th out of 253 homes in Florida. Shows adjusted nurse hours per resident per day benchmarked to the Florida average, with a ranking across 253 Florida facilities. More hours mean more direct care. The national average is about 3.5 hrs; below 3.0 is a red flag.Rankings are based only on facilities in Florida that report data for that category. Facilities without available data are excluded from the ranking.Click the rank badge to see the full State ranking.Click here to see the full State ranking.
This facility Florida avg (4h 2m per day)
vs Florida avg
-5%

2 of 6 metrics below state avg

Standout metric Weekend RN is +63% above state avg
Staff typeHours / Day / Residentvs state avg
Registered Nurse (RN) Info RNs hold the highest nursing license and can assess residents, interpret test results, and direct care plans. More RN hours per day often signals stronger clinical oversight and faster response to health changes. 1h 1m per day ▲ 39% State avg: 44m per day · National avg: 41m per day
LPN / LVN Info Licensed Practical Nurses (LPNs) or Licensed Vocational Nurses (LVNs) deliver routine hands-on care — medication administration, wound dressing, and monitoring vital signs. They work under RN supervision and make up a large share of daily bedside care. 34m per day ▼ 29% State avg: 47m per day · National avg: 52m per day
Nurse Aide Info Certified Nurse Aides (CNAs) provide the most direct day-to-day assistance: bathing, dressing, feeding, and mobility. Nurse aide hours are typically the largest staffing category and directly affect residents' quality of life. 2h 34m per day ▲ 10% State avg: 2h 20m per day · National avg: 2h 20m per day
Weekend Total Nursing Info Combined nursing hours (RN + LPN + Nurse Aide) per resident per day on weekends. Staffing often drops on weekends — this figure reveals whether the facility maintains adequate coverage outside of weekday hours. 3h 53m per day ▲ 10% State avg: 3h 32m per day · National avg: 3h 27m per day
Physical Therapist Info Hours per resident per day provided by licensed Physical Therapists (PTs) or PT Assistants. PT services help residents recover mobility after injury or illness and are especially important for post-acute (short-stay) rehabilitation. 3m per day ▼ 42% State avg: 6m per day · National avg: 4m per day
Weekend RN Info Registered nurse hours specifically on weekends. Facilities sometimes reduce RN presence on Saturdays and Sundays — a low weekend RN figure compared to weekday hours can indicate reduced clinical oversight when most administrative staff are absent. 52m per day ▲ 63% State avg: 32m per day · National avg: 29m per day

Capacity and availability

This home usually has availability

Lower occupancy than the Florida average: 84.3%
Occupancy rate
79.8% Rank #191 / 258Occupancy rate — State benchmarkedThis home is ranked 191st out of 258 homes in Florida. Shows this facility's occupancy rate versus the Florida average, with its Statewide rank out of 258. Higher occupancy signals strong local demand and financial stability.Rankings are based only on facilities in Florida that report data for that category. Facilities without available data are excluded from the ranking.Click the rank badge to see the full State ranking.Click here to see the full State ranking.
Avg. Length of Stay
132 days
Bed community size
39-bed community Rank #825 / 1074Bed count — State benchmarkedThis home is ranked 825th out of 1074 homes in Florida. Shows this facility's certified or reported bed count compared to other Florida facilities. Larger communities may offer more amenities, programs, and on-site services for residents and families.Rankings are based only on facilities in Florida that report data for that category. Facilities without available data are excluded from the ranking.Click the rank badge to see the full State ranking.Click here to see the full State ranking.
A moderately sized community that may balance personal attention with shared amenities and social activities.
Walk Score
Walk Score: 86 / 100 Rank #58 / 1486Walk Score — State benchmarkedThis home is ranked 58th out of 1486 homes in Florida. Shows how walkable this facility's neighborhood is compared to the average Walk Score across Florida facilities. Higher scores benefit residents, families, and staff.Rankings are based only on facilities in Florida that report data for that category. Facilities without available data are excluded from the ranking.Click the rank badge to see the full State ranking.Click here to see the full State ranking.
Very walkable. Most errands can be accomplished on foot, and many essentials are within a short walk.

Therapy & Rehabilitation

2 services
Rehabilitation Services
Respite Care

Amenities & Lifestyle

Specific ProgramsPost Acute Services, Rehabilitation Programs, Restorative Programs

Contact Concordia Manor

Staffing Data

Reporting period: October 1 – December 31, 2025 (Q4 2025). Source: CMS Payroll-Based Journal report.

Total staff 95
Employees 76
Contractors 19
Staff to resident ratio 2.71 : 1
84% more staff per resident than Florida average
Florida average ratio: 1.47 : 1 Florida average ratio: 1.47 : 1See full Florida ranking
Avg staff/day 23
Average shift 7 hours
11% worse than Florida average
Florida average: 7.9 hours Florida average shift: 7.9 hoursSee full Florida ranking
Total staff hours (quarter) 14,788

Nursing staff breakdown

Q4 2025 · Oct 1 – Dec 31 More info This data comes from the CMS Payroll-Based Journal report covering October 1 – December 31, 2025.
Registered Nurse

Manages medical care and health needs.

RN Staff Info 11 total: 9 full-time employees and 2 contractors. 11
Average shift length Info Average shift length. Calculated as total hours divided by days worked and average staff per day. 8 hours
Licensed Practical Nurse

Assists with medical care and medications.

LPN Staff Info All 11 LPN Staff are full-time employees. No contractors work on this role. 11
Average shift length Info Average shift length. Calculated as total hours divided by days worked and average staff per day. 8 hours
Certified Nursing Assistant

Helps with daily care and mobility.

CNA Staff Info All 37 CNA Staff are full-time employees. No contractors work on this role. 37
Average shift length Info Average shift length. Calculated as total hours divided by days worked and average staff per day. 7.1 hours

Contractor staffing

Q4 2025 · Oct 1 – Dec 31 More info This data comes from the CMS Payroll-Based Journal report covering October 1 – December 31, 2025.

Total hours from contractors

10.8%

1,599 contractor hours this quarter

Speech Language Pathologist: 5 Qualified Social Worker: 3 Physical Therapy Assistant: 3 Respiratory Therapy Technician: 2 Registered Nurse: 2 Occupational Therapy Assistant: 1 Nurse Practitioner: 1 Physical Therapy Aide: 1 Medical Director: 1

Staff by category

Q4 2025 · Oct 1 – Dec 31 More info This data comes from the CMS Payroll-Based Journal report covering October 1 – December 31, 2025.
Certified Nursing Assistant370377,42692100%7.1
Registered Nurse92111,6258997%8
Licensed Practical Nurse110111,6169199%8
Clinical Nurse Specialist5058978693%8.4
Speech Language Pathologist0557246874%6.3
Physical Therapy Assistant0335457177%5
Other Dietary Services Staff7075326773%7.4
Administrator2024645762%8
Nurse Practitioner1124215459%7.8
Respiratory Therapy Technician0221616065%2.7
Dietitian1011121516%7.5
Mental Health Service Worker202791011%7.9
Qualified Social Worker033564549%1.2
Occupational Therapy Aide1014767%7.8
Physical Therapy Aide011441112%4
Occupational Therapy Assistant0112278%3.1
Medical Director0112133%6.9
37 Certified Nursing Assistant
% of Days 100%
11 Registered Nurse
% of Days 97%
11 Licensed Practical Nurse
% of Days 99%
5 Clinical Nurse Specialist
% of Days 93%
5 Speech Language Pathologist
% of Days 74%
3 Physical Therapy Assistant
% of Days 77%
7 Other Dietary Services Staff
% of Days 73%
2 Administrator
% of Days 62%
2 Nurse Practitioner
% of Days 59%
2 Respiratory Therapy Technician
% of Days 65%
1 Dietitian
% of Days 16%
2 Mental Health Service Worker
% of Days 11%
3 Qualified Social Worker
% of Days 49%
1 Occupational Therapy Aide
% of Days 7%
1 Physical Therapy Aide
% of Days 12%
1 Occupational Therapy Assistant
% of Days 8%
1 Medical Director
% of Days 3%

Penalties and fines

Federal penalties imposed by CMS for regulatory violations, including civil money penalties (fines) and denials of payment for new Medicare/Medicaid admissions.

Source: CMS Penalties Database

No penalties in the past 3 years

No civil money penalties or payment denials were reported in the last 3 years.

Quality of care over time

These measures show how residents usually do over time at this home, based on health outcomes and preventive care.

High-risk clinical events score Info A composite score based on pressure ulcers, falls with injury, weight loss, walking ability decline, and activities of daily living decline. 5.2
30% better than Florida average

Florida average: 7.4

Functional decline score Info A composite score based on activities of daily living decline, walking ability decline, and incontinence. 3.0
76% better than Florida average

Florida average: 12.4

Long-stay resident measures
Need for Help with Daily Activities Increased Info Percent of long-stay residents whose need for help with daily activities has increased 4.9%
54% better than Florida average

Florida average: 10.5%

Walking Ability Worsened Info Percent of long-stay residents whose ability to move independently worsened 3.1%
76% better than Florida average

Florida average: 12.9%

Low Risk Residents with Bowel/Bladder Incontinence Info Percent of low risk long-stay residents who lose control of their bowels or bladder 1.0%
93% better than Florida average

Florida average: 13.5%

Falls with Major Injury Info Percent of long-stay residents experiencing one or more falls with major injury 0.0%
100% better than Florida average

Florida average: 2.6%

High Risk Residents with Pressure Ulcers Info Percent of long-stay high risk residents with pressure ulcers 5.3%
In line with Florida average

Florida average: 5.4%

Urinary Tract Infection Info Percent of long-stay residents with a urinary tract infection 0.9%
In line with Florida average

Florida average: 0.9%

Lost Too Much Weight Info Percent of long-stay residents who lose too much weight 12.7%
112% worse than Florida average

Florida average: 6.0%

Depressive Symptoms Info Percent of long-stay residents who have depressive symptoms 3.7%
12% worse than Florida average

Florida average: 3.3%

Antipsychotic Use Info Percent of long-stay residents who received an antipsychotic medication 12.0%
50% worse than Florida average

Florida average: 8.0%

Pneumococcal Vaccine Info Percent of long-stay residents assessed and appropriately given the pneumococcal vaccine 100.0%
In line with Florida average

Florida average: 97.7%

Influenza Vaccine Info Percent of long-stay residents assessed and appropriately given the seasonal influenza vaccine 100.0%
In line with Florida average

Florida average: 99.2%

Short-stay resident measures
Pneumococcal Vaccine Info Percent of short-stay residents assessed and appropriately given the pneumococcal vaccine 100.0%
6% better than Florida average

Florida average: 94.0%

Antipsychotic medication increase Info Percent of short-stay residents who newly received an antipsychotic medication 1.5%
In line with Florida average

Florida average: 1.5%

Influenza Vaccine Info Percent of short-stay residents assessed and appropriately given the seasonal influenza vaccine 100.0%
6% better than Florida average

Florida average: 94.7%

Breakdown by payment type

Medicare

46% of new residents, usually for short-term rehab.

Typical stay 25 days

Private pay

29% of new residents, often for short stays.

Typical stay 1 - 2 months

Medicaid

26% of new residents, often for long-term daily care.

Typical stay 1 years

Facility Characteristics

Source: CMS Long-Term Care Facility Characteristics (Data as of Jan 2026)

Total residents 35
Medicare
3
8.6% of residents
Medicaid
32
91.4% of residents
Programs & Services
Residents Group

Residents meet regularly to discuss policies, care quality, and activities

Active Resident Council

Organized group of residents that meets regularly to discuss facility policies, quality of life, and activities.

Finances and operations

Based on CMS SNF Cost Report for fiscal year ending in 12/2023.

For-profit
Operated by a single business entity.
Net patient revenue Info Net patient revenue — what the home actually collects for resident care, after contractual allowances, bad debt and discounts are subtracted from its gross charges (CMS cost report, Worksheet G-3). It covers resident care only; money the home earns from other sources is shown separately as "Other income."
$3.6M
Net patient income Info Net patient income: net patient revenue minus the home's total operating expenses. A positive figure means it earns more from resident care than it spends to deliver it; a negative figure means the opposite. It excludes non-operating "other income."
-$252.4K
For-profit Operated by a single business entity.
Net patient revenue Info Net patient revenue — what the home actually collects for resident care, after contractual allowances, bad debt and discounts are subtracted from its gross charges (CMS cost report, Worksheet G-3). It covers resident care only; money the home earns from other sources is shown separately as "Other income."
$3.6M Rank #255 / 257Revenue — State benchmarkedThis home is ranked 255th out of 257 homes in Florida. Shows this facility's annual revenue compared to the Florida average. Higher revenue generally means more resources for staffing and capital — read alongside Payroll %.Rankings are based only on facilities in Florida that report data for that category. Facilities without available data are excluded from the ranking.Click the rank badge to see the full State ranking.Click here to see the full State ranking.
Net patient income Info Net patient income: net patient revenue minus the home's total operating expenses. A positive figure means it earns more from resident care than it spends to deliver it; a negative figure means the opposite. It excludes non-operating "other income."
-$252.4K
Other income Info Money the home earns outside of resident care — such as investments, grants, rentals and other non-operating sources (CMS cost report, Worksheet G-3). It is tracked separately from net patient revenue: it is not part of that figure, and it is not included in net patient income.
$11.9K
Payroll costs Info Staff salaries plus wage-related costs — benefits such as payroll taxes, health insurance and retirement — from the home's own accounting records (CMS cost report, Worksheet A). Contract or agency labor is counted separately, under other operating costs. Rank #252 / 257Payroll — State benchmarkedThis home is ranked 252nd out of 257 homes in Florida. Shows total annual staff payroll benchmarked to the Florida average. Higher payroll investment relative to peers often signals better staffing and less reliance on cheaper contract labor.Rankings are based only on facilities in Florida that report data for that category. Facilities without available data are excluded from the ranking.Click the rank badge to see the full State ranking.Click here to see the full State ranking.
$1.9M 53.5% of net patient revenue Info Payroll as a share of revenue: staff salaries and wage-related benefits divided by net patient revenue. A higher figure means more of each revenue dollar goes to staff pay. Rank #18 / 257Payroll % — State benchmarkedThis home is ranked 18th out of 257 homes in Florida. Shows payroll as a percentage of revenue versus the Florida average. Well-run Florida facilities typically land around 49–56% — the top third Statewide. Below 25% may signal understaffing or heavy agency use — read with Staffing ratings.Rankings are based only on facilities in Florida that report data for that category. Facilities without available data are excluded from the ranking.Click the rank badge to see the full State ranking.Click here to see the full State ranking.
Other operating costs Info Everything it costs to run the home apart from payroll — food, utilities, supplies, maintenance, contract labor and administration. Calculated as total operating expense minus payroll (staff salaries and wage-related benefits).
$1.9M
Total costs Info The home's total operating expense for the year — all the costs of running it, salaries included (CMS cost report, Worksheet G-3).
$3.8M

Who this home usually serves

TYPE OF STAY

Mostly short-term rehab stays

Most residents typically stay for a few weeks or months before returning home or moving on.

New residents most often arrive under Medicare (46% of admissions), and a typical Medicare stay runs around 25 days.

Admissions
90 total

Coverage residents most often arrive under.

Medicare 46%
Private pay 29%
Medicaid 26%
Discharges
86 total

Coverage residents most often leave under.

Medicare 29%
Private pay 30%
Medicaid 41%

Compare Nursing Homes around St Petersburg

The information below is reported by the Florida Agency for Health Care Administration (AHCA).

4 facilities compared · CMS & FL Dept. of Health data

Addington Place at College Harbor
NH
AL
IL
NC
St. Petersburg
90
Facility 90
FL AVG 89
Rank #533 / 1074
88.4%
Facility 88.4%
FL AVG 84.3%
Rank #142 / 258
+5%- +26%-
$0
Facility $0
FL AVG $78.9k
Rank #1 / 258
89
Facility 89
FL AVG 83
Rank #342 / 876
10
Facility 10
FL AVG 19.7
Rank #48 / 252
3.3
Facility 3.3
FL AVG 4.5
Rank #73 / 252
-38-
3
Facility 3
FL AVG 40
Rank #1383 / 1486
Rk3 LLC
$6.1M
Facility $6.1M
FL AVG $15.7M
Rank #243 / 257
$3.9M
Facility $3.9M
FL AVG $6.1M
Rank #226 / 257
63.2%
Facility 63.2%
FL AVG 39.8%
Rank #12 / 257
105959
Golfview HealthCARE Center
NH
HC
MC
NC
PC
St Petersburg
56
Facility 56
FL AVG 89
Rank #740 / 1074
69.9%
Facility 69.9%
FL AVG 84.3%
Rank #223 / 258
-17%
4.10
Facility 4.10
FL AVG 4.04
Rank #91 / 253
+28%+2%
$90.9k
Facility $90.9k
FL AVG $78.9k
Rank #235 / 258
-
15
Facility 15
FL AVG 19.7
Rank #93 / 252
2.5
Facility 2.5
FL AVG 4.5
Rank #35 / 252
153-
46
Facility 46
FL AVG 40
Rank #590 / 1486
Golfview Nursing Member LLC
$4.5M
Facility $4.5M
FL AVG $15.7M
Rank #252 / 257
$3.0M
Facility $3.0M
FL AVG $6.1M
Rank #243 / 257
67.6%
Facility 67.6%
FL AVG 39.8%
Rank #5 / 257
105409
Concordia Manor
NH
NC
PC
RC
St Petersburg
39
Facility 39
FL AVG 89
Rank #825 / 1074
79.8%
Facility 79.8%
FL AVG 84.3%
Rank #191 / 258
-5%
3.83
Facility 3.83
FL AVG 4.04
Rank #145 / 253
-4%-5%
$150.4k
Facility $150.4k
FL AVG $78.9k
Rank #245 / 258
-
17
Facility 17
FL AVG 19.7
Rank #123 / 252
2.8
Facility 2.8
FL AVG 4.5
Rank #45 / 252
431-
86
Facility 86
FL AVG 40
Rank #58 / 1486
Angelique Ames
$3.6M
Facility $3.6M
FL AVG $15.7M
Rank #255 / 257
$1.9M
Facility $1.9M
FL AVG $6.1M
Rank #252 / 257
53.5%
Facility 53.5%
FL AVG 39.8%
Rank #18 / 257
105714
St. Petersburg Nursing and Rehabilitation Center
NH
HC
MC
NC
PC
RC
St Petersburg
96
Facility 96
FL AVG 89
Rank #495 / 1074
83.1%
Facility 83.1%
FL AVG 84.3%
Rank #176 / 258
-1%
4.23
Facility 4.23
FL AVG 4.04
Rank #75 / 253
-2%+5%
$0
Facility $0
FL AVG $78.9k
Rank #1 / 258
-
42
Facility 42
FL AVG 19.7
Rank #245 / 252
7.0
Facility 7.0
FL AVG 4.5
Rank #221 / 252
284-
69
Facility 69
FL AVG 40
Rank #223 / 1486
-
$9.3M
Facility $9.3M
FL AVG $15.7M
Rank #233 / 257
$5.9M
Facility $5.9M
FL AVG $6.1M
Rank #200 / 257
63.3%
Facility 63.3%
FL AVG 39.8%
Rank #4 / 257
106033

Financial Assistance for
Nursing Home in Florida

Concordia Manor is located in St Petersburg, Florida.
Here are the financial assistance programs available to residents in Florida.

Get Financial aid guidance

Long-Term Care Waiver

Florida Medicaid LTC Waiver

Age 65+ or 21+ disabled
General Florida resident, Medicaid- eligible, nursing home-level care need.
Income Limits (2025) ~$2,829/month 300% FBR, individual
Asset Limits $2,000 (individual), $3,000 (couple).
FL

High demand; waitlists common.

Benefits
In-home care (6-8 hours/day) Assisted living Respite (240 hours/year) Case management

Community Care for the Elderly (CCE)

Florida CCE

Age 60+
General Florida resident, at risk of nursing home.
Income Limits ~$2,000/month varies
Asset Limits $5,000 individual
FL

Limited funding; regional variation.

Benefits
Homemaker services (3-5 hours/week) Adult day care (~$60/day) Respite (up to 10 days/year)

Home Care for the Elderly (HCE)

Florida Home Care for the Elderly

Age 60+
General Florida resident, at risk of nursing home placement; caregiver must be approved.
Income Limits (2025) ~$2,829/month individual, aligned with Medicaid thresholds
Asset Limits ~$2,000 (individual); varies by case manager discretion.
FL

Limited funding (~3,500 served annually); prioritizes low-income frail seniors.

Benefits
Basic subsidy (~$160/month) for housing/medical costs; special subsidies for supplies/services (e.g., incontinence supplies, ~$50-$200/month)

Program of All-Inclusive Care for the Elderly (PACE)

Florida Medicaid PACE

Age 55+
General Florida resident, nursing home-level care need, safe with PACE support.
Income Limits (2025) ~$2,829/month 300% FBR
Asset Limits $2,000 (individual), $3,000 (couple).
FL

Limited to specific counties (e.g., Hillsborough, Miami-Dade); ~10 sites statewide.

Benefits
Personal care (5-7 hours/day) Medical care Meals Transportation Therapy

Optional State Supplementation (OSS)

Florida Optional State Supplementation

Age 65+ or disabled
General Florida resident, living in approved facility, receiving SSI or low-income.
Income Limits (2025) ~$1,004/month individual, including SSI
Asset Limits $2,000 (individual), $3,000 (couple).
FL

Limited to specific facility types; ~$78.40/month max supplement.

Benefits
Cash payment (~$78.40/month) for room/board or personal needs in facilities

Frequently Asked Questions about Concordia Manor

Is Concordia Manor in a walkable area?

Concordia Manor has a walk score of 86. Very walkable. Most errands can be accomplished on foot, and many essentials are within a short walk.

What is the occupancy rate at Concordia Manor?

Concordia Manor's occupancy is 79.8%.

Does Concordia Manor operate as a for-profit or non-profit?

Concordia Manor is registered as a for-profit.

Are there photos of Concordia Manor?

Yes — there is 1 photo of Concordia Manor in the photo gallery on this page.

What is the phone number of Concordia Manor?

(727) 822-3030 will put you in contact with the team at Concordia Manor.

Is Concordia Manor Medicare or Medicaid certified?

Yes — Concordia Manor is a CMS-certified provider of Medicare and Medicaid.

Guides for Better Senior Living

Care Cost Calculator: See Prices in Your Area

Nursing Home Data Explorer

Don’t Wait Too Long: 7 Red Flag Signs Your Parent Needs Assisted Living Now

The True Cost of Assisted Living in 2025 – And How Families Are Paying For It

Understanding Senior Living Costs: Pricing Models, Discounts & Financial Assistance