Explore Open Rooms
1 Contact details
2 What type of senior care service are you looking for?
3 What budget do you have in mind for senior care?
4 How soon do you need to find care?
5 Additional details

Thank you for your interest!

Our team will be in touch shortly to help with next steps.

Senior Communities in North Carolina

CMS overall rating Info The Overall CMS Rating combines results from health inspections, staffing levels and quality measures. Health inspections carry the most weight. Staffing and quality scores can increase or decrease the final rating based on performance compared to state and national standards.

Given Estates

Overview of Given Estates

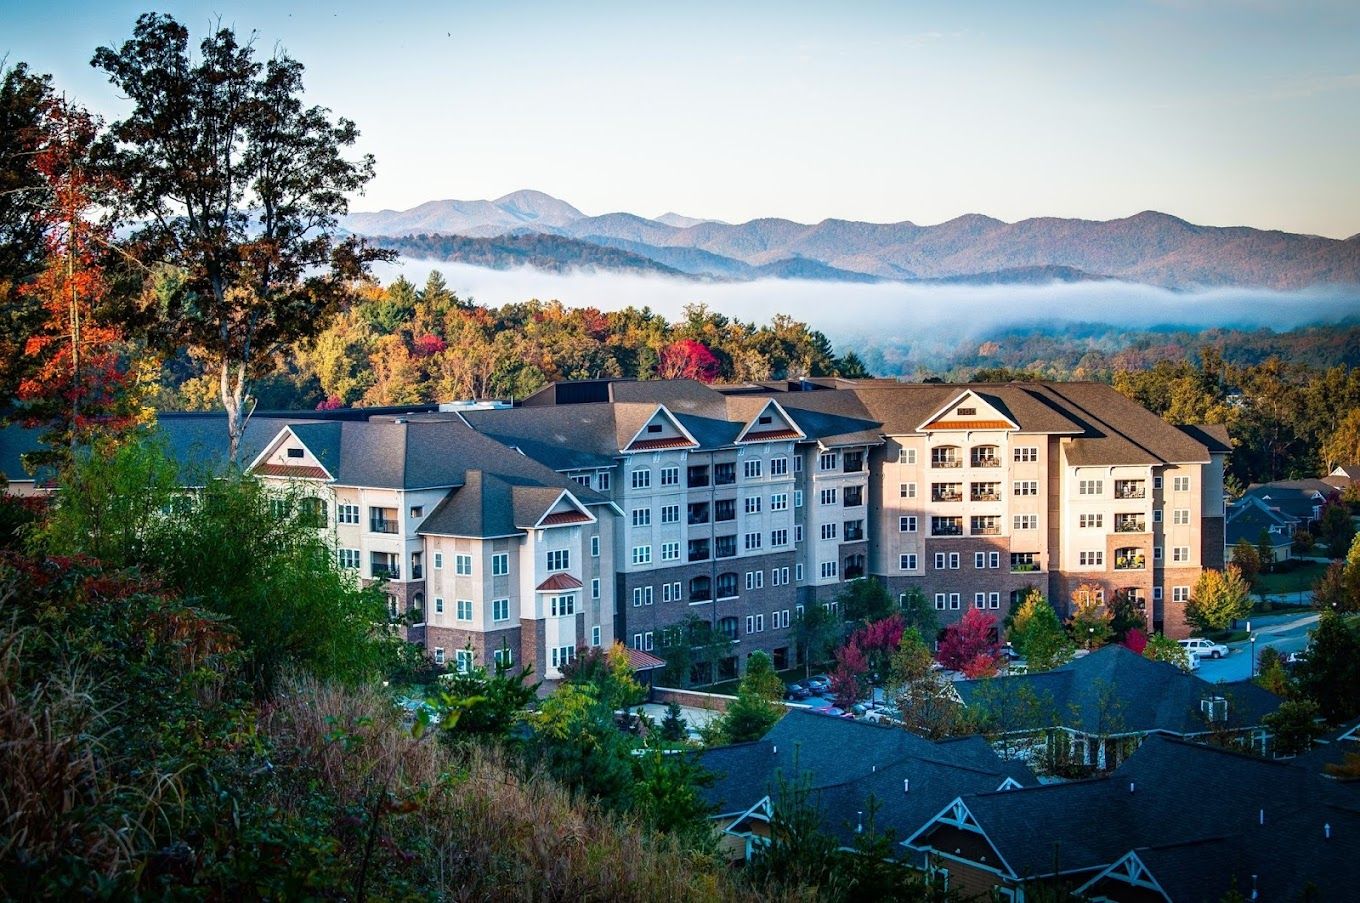
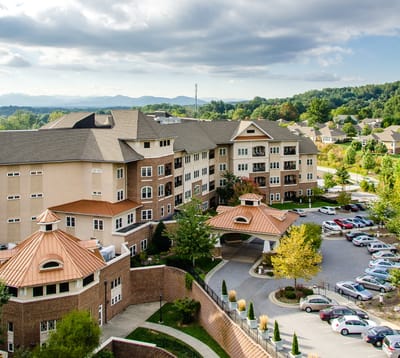
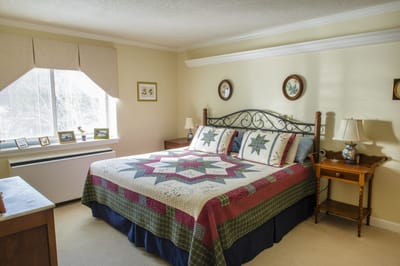
Nestled in Asheville, North Carolina, Givens Estates is a senior life plan community where residents are empowered to lead extraordinary lives filled with purpose, passion, and possibility. Their mission is to offer assisted living, skilled nursing, and home care that fosters personal growth, meaningful connections, and spiritual development. Rooted in compassion and respect, Givens Estates values each individual’s journey, providing a safe and nurturing space where seniors can thrive and pursue their dreams.

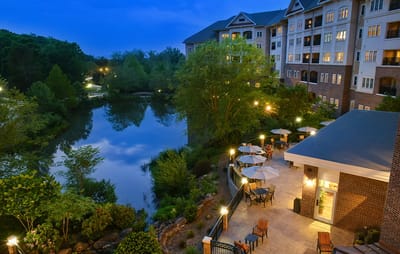
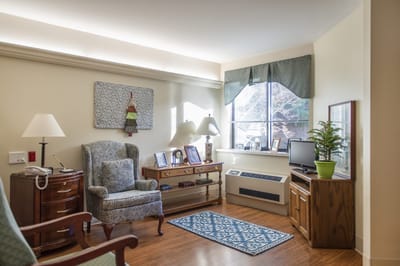
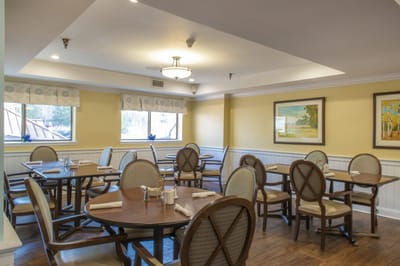
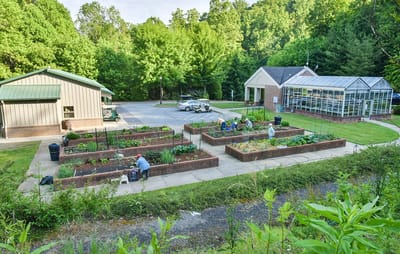
At Givens Estates, residents enjoy a wealth of assisted living and nursing home amenities and facilities designed to enhance their quality of life. From spacious retirement homes to restaurant-style dining experiences, the community offers a range of options tailored to meet diverse needs and preferences. Residents benefit from daily housekeeping, personal transportation services, and access to a fully equipped therapy gym. With breathtaking mountain views and serene garden beds, Givens Estates provides a tranquil setting for residents to relax and rejuvenate. Whether participating in on-site activities or exploring the surrounding nature trails, residents find endless opportunities for enrichment and enjoyment at Givens Estates.

(828) 274-4800

Quality ratings

Measured by Centers for Medicare & Medicaid Services (CMS)

Overall rating Info The Overall CMS Rating combines results from health inspections, staffing levels and quality measures. Health inspections carry the most weight. Staffing and quality scores can increase or decrease the final rating based on performance compared to state and national standards.
4/5
North Carolina average: 3.0/5
Health Inspection Info Based on the results of the facility's three most recent standard inspections and any complaint investigations. CMS reviews the number, scope, and severity of deficiencies, with more recent findings weighted more heavily.
3/5
North Carolina average: 3.4/5
Staffing Info Measures average nursing staff hours per resident per day, including Registered Nurses (RNs) and total nursing staff. Ratings are adjusted based on the level of care residents require and are compared to state and national benchmarks.
5/5
North Carolina average: 3.3/5
Quality Measures Info Based on clinical and physical health indicators reported to CMS, such as hospital readmissions, falls, pressure ulcers, and improvements in mobility. These measures reflect how well residents' health needs are being managed.
4/5
North Carolina average: 3.6/5

Nursing care per resident

Info This shows how many total hours of nursing staff time are available per resident each day. Higher numbers usually mean more staff support.
5h 36m per day

This home provides 14% more nursing time per resident than the North Carolina average.

North Carolina average: 4h 55m per day

Capacity and availability

Smaller home

May offer a more intimate, personalized care environment.

Total beds 70

This home usually has availability

Lower occupancy suggests more openings may be available.

Lower demand than the North Carolina average
Occupancy rate 81.4%
Residents per day (avg) 58
Occupancy rate
81.4%
Residents per day (avg)
58

Who this home usually serves

TYPE OF STAY

Mostly short-term rehab stays

Most residents typically stay for a few weeks or months before returning home or moving on.

Might be optimal for
Short stays Recovery Medicare-covered care

Breakdown by payment type

Medicare

53% of new residents, usually for short-term rehab.

Typical stay 29 days

Private pay

45% of new residents, often for short stays.

Typical stay 6 - 7 months

Medicaid

2% of new residents, often for long-term daily care.

Typical stay 2 - 3 years

Finances and operations

Voluntary non-profit community
Operated by a church.
Home revenue
$70.1M
Surplus of revenue
$16.9M
Voluntary non-profit community Operated by a church.
Home revenue
$70.1M
Surplus of revenue
$16.9M
Payroll costs Info The portion of the home's budget spent on staff, including nurses, caregivers, and other employees who support care and operations.
$19.2M
27.3% of revenue
Other operating costs Info All remaining costs needed to run the home, such as food, utilities, building maintenance, supplies and administrative expenses.
$34.1M
Total costs $53.3M
Walk Score
Walk Score: 29 / 100
Somewhat walkable. A few nearby services may be reachable on foot, but most trips require transportation.

About this community

Additional Licensing Details

CMS Certification Number345328
AccreditationsCARF accredited since 1993
Inspection RatingA- rating by Fitch Ratings

Safety & Compliance

Emergency Systems24-hour security and an urgent call system.
Safety FeaturesEmergency call system in each residence.

Staffing

Key information about the people who lead and staff this community.

Leadership

ContactKen Partin, Administrator

Payment & Insurance

1 service
Accept Medicare

Therapy & Rehabilitation

2 services
Rehabilitation Services
Respite Care

Staffing & Medical

3 services
Nursing Services
Skilled Nursing
24-Hour Staffing

Amenities & Lifestyle

21 amenities
Housekeeping
Grounds Keeping
Maintenance Services
24-Hour Security
Urgent Call System
Beauty Salon
Physician’s Office
Daily Clinic
Pharmacy
Fitness Coaching
Outpatient Therapy Services
Home Care Services
Scheduled Transportation
Guest Rooms For Visitors
Telephone
Internet
Cable Tv
Water
Sewer Service
Garbage Pickup
Fire Insurance
Specific ProgramsCommunity Life, Life Enrichment, Wellness Center, Dining Venues, Assisted Living, Skilled Nursing, Home Care, Residences

Pricing & Financial Information

Dining & Nutrition

Food DescriptionFlexible dining program available.

Access & Eligibility

Ways to qualify for care at this community, including accepted programs and payment options.

Medicare Accepted

This facility is certified for eligible Medicare services.

Payment & Funding Options

Medicare Long-term care insurance

Health Inspection History

Inspections
Total health inspections 3

State average 4


Last Health inspection on Feb 2025

Total health citations 20

State average 20.9

Citations per inspection
6.67

State average 4.99


Health citations are formal notices following inspections when they fail to comply with safety and care standards.

All 20 citations resulted from standard inspections.

Breakdown of citation severity (last 3 years)
Critical Health citations More info 0
100% better than State average

State average: 1.3


Serious Health citations More info 0
100% better than State average

State average: 0.9

0 critical citations More info State average: 1.3

0 serious citations More info State average: 0.9

18 moderate citations More info State average: 17.1

2 minor citations More info State average: 1.6
Citations history (last 3 years)
Infection Control moderate citation Info Issues related to preventing and controlling infections, including hygiene practices and safety protocols. Feb 06, 2025
Corrected

Nutrition moderate citation Info Issues related to food quality, meal service, and resident's nutritional needs. Feb 06, 2025
Corrected

Quality of Care moderate citation Info Issues related to how well residents receive appropriate treatment and support for their medical and daily care needs. Feb 06, 2025
Corrected

Care Planning moderate citation Info Issues related to creating and updating personalized care plans for residents based on their needs and conditions. Feb 06, 2025
Corrected

Compare Senior Communities around North Carolina The information below is reported by the North Carolina Department of Health and Human Services, Division of Health Service Regulation.

Filter by care type
Cross Road Retirement Community
AL

Assisted Living A licensed, long-term care setting for seniors or individuals with disabilities who need help with daily activities — like bathing, dressing, and medication management — but not 24-hour skilled nursing. Offers housing, meals, and around-the-clock support while aiming to maximize resident independence.

IL

Independent Living Lifestyle-focused communities for older adults offering dining, activities, and transportation with minimal personal care. Best for active, independent seniors who want community without medical support.

MC

Memory Care Secured, specialized care for people living with Alzheimer's or dementia. Staff trained in cognitive impairment, with higher staff-to-resident ratios and an environment designed to reduce confusion and wandering risk.

-
152
No
0
55.3%
-
102.50/200
21
66.7%
Given Estates
NH

Nursing Home Licensed facility providing 24/7 skilled nursing care for residents with complex, ongoing medical needs. Staffed by RNs, LPNs, and CNAs. Inspected and star-rated annually by CMS. Accepts Medicare (short-term rehab) and Medicaid (long-term care).

AL

Assisted Living A licensed, long-term care setting for seniors or individuals with disabilities who need help with daily activities — like bathing, dressing, and medication management — but not 24-hour skilled nursing. Offers housing, meals, and around-the-clock support while aiming to maximize resident independence.

Asheville
70
No
29
81.4%
-
-
-
0
0%
TerraBella Marchbanks
AL

Assisted Living A licensed, long-term care setting for seniors or individuals with disabilities who need help with daily activities — like bathing, dressing, and medication management — but not 24-hour skilled nursing. Offers housing, meals, and around-the-clock support while aiming to maximize resident independence.

MC

Memory Care Secured, specialized care for people living with Alzheimer's or dementia. Staff trained in cognitive impairment, with higher staff-to-resident ratios and an environment designed to reduce confusion and wandering risk.

Anderson
60
No
39
-
-
-
-
0
0%
Searstone Retirement Community
AL

Assisted Living A licensed, long-term care setting for seniors or individuals with disabilities who need help with daily activities — like bathing, dressing, and medication management — but not 24-hour skilled nursing. Offers housing, meals, and around-the-clock support while aiming to maximize resident independence.

MC

Memory Care Secured, specialized care for people living with Alzheimer's or dementia. Staff trained in cognitive impairment, with higher staff-to-resident ratios and an environment designed to reduce confusion and wandering risk.

NH

Nursing Home Licensed facility providing 24/7 skilled nursing care for residents with complex, ongoing medical needs. Staffed by RNs, LPNs, and CNAs. Inspected and star-rated annually by CMS. Accepts Medicare (short-term rehab) and Medicaid (long-term care).

Cary
-
No
49
-
A+
-
-
0
0%

Places of interest near Given Estates

Address 6.5 miles from city center — 0.47 miles to nearest hospital (Publix Pharmacy at Pinnacle Point)

Calculate Travel Distance to Given Estates

Add your location

Address

Staffing Data (Q2 2025)

This data corresponds to Q2 2025 and is based on CMS Payroll-Based Journal.

Total staff 162
Employees 89
Contractors 73
Staff to resident ratio 2.79:1
51% better than North Carolina average

North Carolina average ratio: 1.85:1

Avg staff/day 42
Average shift 8.3 hours
0% compared with North Carolina average

North Carolina average: 8 hours

Total staff hours (quarter) 31,758
Nursing staff breakdown
Registered Nurse

Manages medical care and health needs.

Total count 14
Average shift length Info Average shift length. Calculated as total hours divided by days worked and average staff per day. 8.9 hours

No contractors work on this role.

Licensed Practical Nurse

Assists with medical care and medications.

Total count 28
Average shift length Info Average shift length. Calculated as total hours divided by days worked and average staff per day. 10.1 hours

This role is partially covered by contractors.

Certified Nursing Assistant

Helps with daily care and mobility.

Total count 85
Average shift length Info Average shift length. Calculated as total hours divided by days worked and average staff per day. 9.1 hours

This role is partially covered by contractors.

Contractor staffing

Total hours from contractors

14.3%

4,544 contractor hours this quarter

Certified Nursing Assistant: 32 Licensed Practical Nurse: 19 Respiratory Therapy Technician: 6 Speech Language Pathologist: 5 Physical Therapy Assistant: 4 Physical Therapy Aide: 2 Qualified Social Worker: 2 Occupational Therapy Aide: 2 Occupational Therapy Assistant: 1
Staff by category
Certified Nursing Assistant 53 32 85 14,930 91 100% 9.1
Registered Nurse 14 0 14 4,440 91 100% 8.9
Licensed Practical Nurse 9 19 28 3,552 91 100% 10.1
Medication Aide/Technician 4 0 4 1,603 85 93% 10.4
Physical Therapy Aide 1 2 3 1,298 67 74% 7.5
Clinical Nurse Specialist 2 0 2 992 65 71% 8
Dietitian 2 0 2 941 74 81% 8
Mental Health Service Worker 2 0 2 810 62 68% 8.3
Speech Language Pathologist 0 5 5 640 75 82% 3.8
Physical Therapy Assistant 0 4 4 591 74 81% 4.6
Administrator 1 0 1 512 64 70% 8
Respiratory Therapy Technician 0 6 6 492 73 80% 3.8
Nurse Practitioner 1 0 1 488 61 67% 8
Qualified Social Worker 0 2 2 340 60 66% 5.7
Occupational Therapy Aide 0 2 2 94 22 24% 3.2
Occupational Therapy Assistant 0 1 1 37 12 13% 3
85 Certified Nursing Assistant
% of Days 100%
14 Registered Nurse
% of Days 100%
28 Licensed Practical Nurse
% of Days 100%
4 Medication Aide/Technician
% of Days 93%
3 Physical Therapy Aide
% of Days 74%
2 Clinical Nurse Specialist
% of Days 71%
2 Dietitian
% of Days 81%
2 Mental Health Service Worker
% of Days 68%
5 Speech Language Pathologist
% of Days 82%
4 Physical Therapy Assistant
% of Days 81%
1 Administrator
% of Days 70%
6 Respiratory Therapy Technician
% of Days 80%
1 Nurse Practitioner
% of Days 67%
2 Qualified Social Worker
% of Days 66%
2 Occupational Therapy Aide
% of Days 24%
1 Occupational Therapy Assistant
% of Days 13%

Facility Characteristics

Source: CMS Long-Term Care Facility Characteristics (Data as of Jan 2026)

Total census
58 residents
Residents by payment source
Medicare
15 residents (25.9%)
Medicaid
5 residents (8.6%)
Private pay or other
38 residents (65.5%)
Programs & Services
Residents' Group

Residents meet regularly to discuss policies, care quality, and activities

Nurse Aide Training

State-approved Nurse Aide Training and Competency Evaluation Program on-site

CCRC

Part of a Continuing Care Retirement Community offering multiple care levels

Active Resident Council

Organized group of residents that meets regularly to discuss facility policies, quality of life, and activities.

Quality of care over time

These measures show how residents usually do over time at this home, based on health outcomes and preventive care.

High-risk clinical events score Info A composite score based on pressure ulcers, falls with injury, weight loss, walking ability decline, and activities of daily living decline. 16.8
46% worse than North Carolina average

North Carolina average: 11.5

Functional decline score Info A composite score based on activities of daily living decline, walking ability decline, and incontinence. 31.9
55% worse than North Carolina average

North Carolina average: 20.6

Long-stay resident measures
Need for Help with Daily Activities Increased Info Percent of long-stay residents whose need for help with daily activities has increased 27.1%
54% worse than North Carolina average

North Carolina average: 17.5%

Walking Ability Worsened Info Percent of long-stay residents whose ability to move independently worsened 30.3%
30% worse than North Carolina average

North Carolina average: 23.3%

Low Risk Residents with Bowel/Bladder Incontinence Info Percent of low risk long-stay residents who lose control of their bowels or bladder 38.4%
79% worse than North Carolina average

North Carolina average: 21.4%

Falls with Major Injury Info Percent of long-stay residents experiencing one or more falls with major injury 13.8%
280% worse than North Carolina average

North Carolina average: 3.6%

High Risk Residents with Pressure Ulcers Info Percent of long-stay high risk residents with pressure ulcers 5.1%
19% better than North Carolina average

North Carolina average: 6.3%

Urinary Tract Infection Info Percent of long-stay residents with a urinary tract infection 4.5%
70% worse than North Carolina average

North Carolina average: 2.6%

Lost Too Much Weight Info Percent of long-stay residents who lose too much weight 7.4%
In line with North Carolina average

North Carolina average: 7.4%

Depressive Symptoms Info Percent of long-stay residents who have depressive symptoms 1.7%
61% better than North Carolina average

North Carolina average: 4.4%

Antipsychotic Use Info Percent of long-stay residents who received an antipsychotic medication 12.0%
11% better than North Carolina average

North Carolina average: 13.4%

Pneumococcal Vaccine Info Percent of long-stay residents assessed and appropriately given the pneumococcal vaccine 98.4%
7% better than North Carolina average

North Carolina average: 91.6%

Influenza Vaccine Info Percent of long-stay residents assessed and appropriately given the seasonal influenza vaccine 88.9%
6% worse than North Carolina average

North Carolina average: 94.1%

Short-stay resident measures
Pneumococcal Vaccine Info Percent of short-stay residents assessed and appropriately given the pneumococcal vaccine 94.8%
19% better than North Carolina average

North Carolina average: 79.9%

Antipsychotic medication increase Info Percent of short-stay residents who newly received an antipsychotic medication 0.9%
43% better than North Carolina average

North Carolina average: 1.5%

Influenza Vaccine Info Percent of short-stay residents assessed and appropriately given the seasonal influenza vaccine 74.4%
5% worse than North Carolina average

North Carolina average: 78.1%

Guides for Better Senior Living

Care Cost Calculator: See Prices in Your Area

Nursing Home Data Explorer

Don’t Wait Too Long: 7 Red Flag Signs Your Parent Needs Assisted Living Now

The True Cost of Assisted Living in 2025 – And How Families Are Paying For It

Understanding Senior Living Costs: Pricing Models, Discounts & Financial Assistance

Financial Aid for North Carolina Seniors

Get financial aid guidance

Community Alternatives Program for Disabled Adults

NC Medicaid CAP/DA

Age 65+ or disabled, North Carolina resident, Medicaid- eligible, nursing home-level care need.

~$2,829/month (300% FBR, individual).

$2,000 (individual), $3,000 (couple).

High demand; waitlists common in urban areas.

North Carolina Senior Care Options

NC SCO (via NFCSP)

Caregiver of someone 60+ (or with dementia), North Carolina resident.

No strict limit; prioritizes low-income.

Not applicable.

Limited slots; rural/urban balance.

Program of All-Inclusive Care for the Elderly (PACE)

North Carolina PACE (e.g., PACE of the Triad)

Age 55+, NC resident (specific counties), NFLOC, safe with PACE support.

~$2,829/month (Medicaid-eligible); private pay option available.

$2,000 (individual), $3,000 (couple) for Medicaid enrollees.

Available in 10+ counties (e.g., Guilford, Wake); multiple providers (e.g., PACE of the Southern Piedmont).

In-Home Aide Services

North Carolina In-Home Aide Services

Age 60+, NC resident, unable to perform 1+ ADL, at risk of nursing home placement.

No strict cap; prioritizes low-income (~$24,980/year).

Not assessed; need-based.

Family can be aides; varies by county funding.

Medicare Savings Program (MSP)

North Carolina Medicare Savings Program

Age 65+ or disabled, NC resident, Medicare Part A/B.

~$2,510/month (QMB), ~$3,380/month (SLMB), ~$3,598/month (QI)—individual.

$9,430 (individual), $14,130 (couple).

Three tiers; no waitlist; includes Extra Help for Part D.

Low-Income Energy Assistance Program (LIHEAP)

North Carolina LIHEAP

Age 60+ prioritized, NC resident, low-income household.

~$3,970/month (individual, 185% FPL).

Not assessed; income-focused.

Covers oil, gas, electric; emergency aid via Crisis Intervention Program (CIP).

Senior Community Service Employment Program (SCSEP)

North Carolina SCSEP

Age 55+, unemployed, low-income, NC resident.

~$1,983/month (125% FPL).

Not specified; income-focused.

Priority for veterans, rural residents; AARP partnership.

VA Aid and Attendance (A&A) and Housebound Benefits

North Carolina VA Aid and Attendance/Housebound

Age 65+ or disabled veteran/spouse, NC resident, wartime service, need for ADL help (A&A) or homebound.

Net income < ~$1,984/month (veteran with dependent, A&A); pension offsets income.

~$155,356 (net worth limit).

High veteran demand in rural/urban areas.

Urgent Repair Program (URP)

North Carolina Urgent Repair Program

Age 60+ prioritized, NC resident, homeowner, low-income.

~$30,258/year (50% AMI, varies by county).

Not strictly assessed; home value considered.

Forgivable at $2,000/year; statewide via local partners.

State/County Special Assistance (SA)

North Carolina Special Assistance

Age 65+ (or disabled), NC resident, in licensed adult care home, low-income.

~$1,255/month (individual, 100% FPL); varies by facility rate.

$2,000 (individual).

Covers assisted living; counties supplement state funds.

Tour Icon
Planning a tour? Check our touring checklist.
Chat Icon
Thinking of living here? We can help you speak to a current resident