Friends Homes
Nursing Home, Assisted Living, Independent Living & Memory Care · Greensboro, NC
CMS overall rating Info CMS (the Centers for Medicare & Medicaid Services) is the federal agency that rates nursing home quality. Its Overall Rating runs from 1 to 5 stars, combining health inspections, staffing, and quality measures, with inspections weighted most heavily.

Friends Homes

Nursing Home, Assisted Living, Independent Living & Memory Care · Greensboro, NC
CMS overall rating Info CMS (the Centers for Medicare & Medicaid Services) is the federal agency that rates nursing home quality. Its Overall Rating runs from 1 to 5 stars, combining health inspections, staffing, and quality measures, with inspections weighted most heavily.
Calculator: See prices in your area
Friends Homes accepts Medicare, Medicaid, and private pay.

Overview of Friends Homes

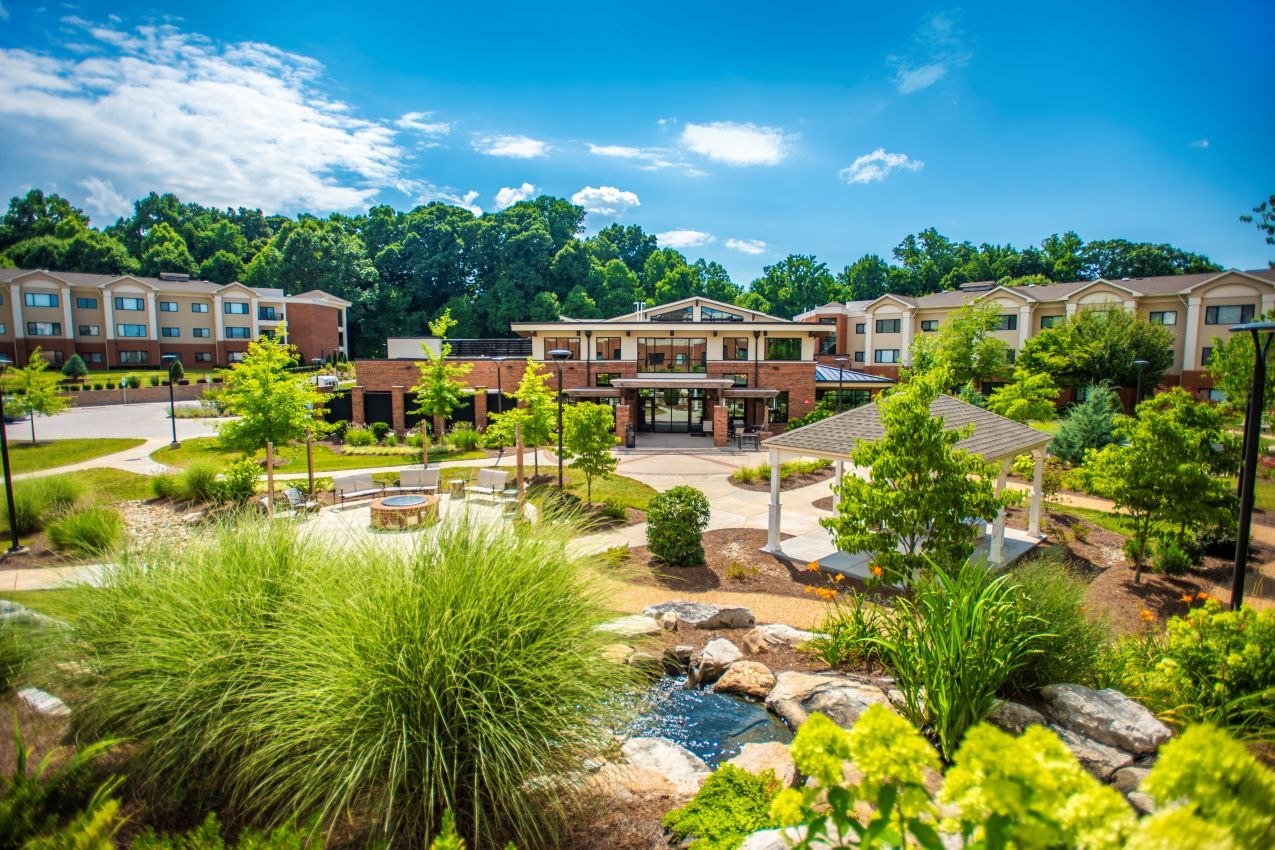
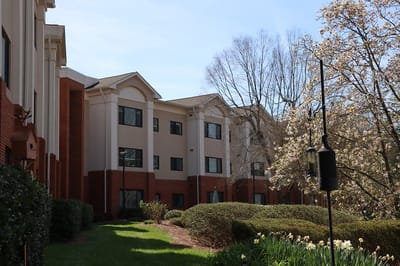
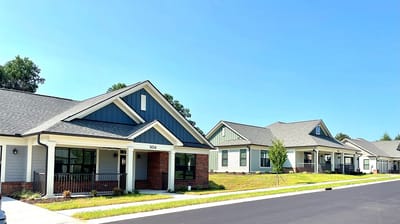
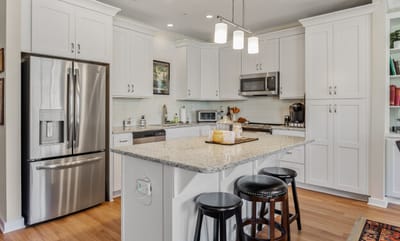
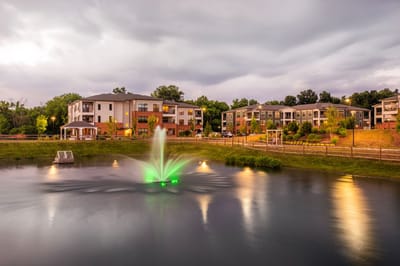
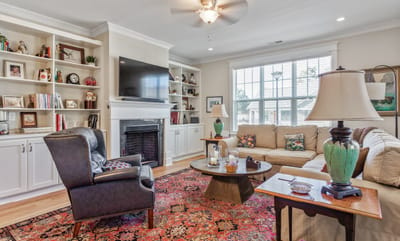
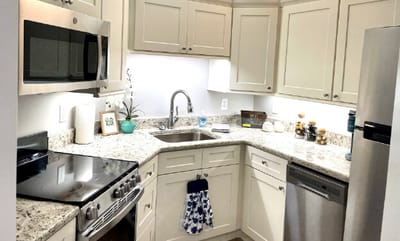
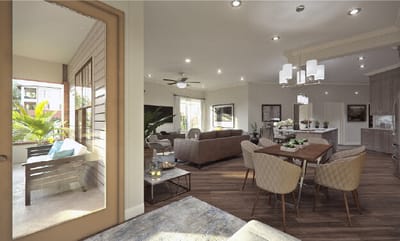
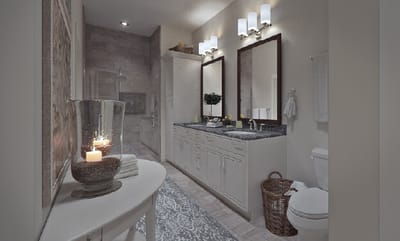
Located in Guilford County, Greensboro, NC, Friends Homes is an inviting senior living community that offers a safe haven far from the hustle and bustle of city life. The community features an array of living options, including independent living, assisted living, skilled nursing care, and memory care, ensuring a smooth transition should residents’ needs change. Residents can choose from a variety of thoughtfully designed floor plans for enjoying life without having to worry about everyday maintenance and upkeep, guaranteeing a worry-free lifestyle.

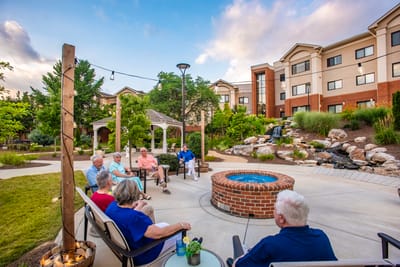
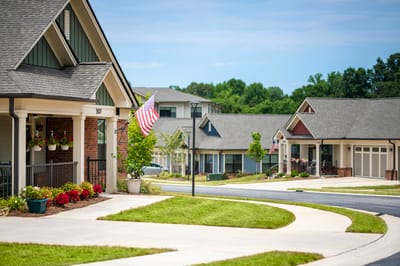
Dedicated to creating an enriching and vibrant environment, the community conducts a wide array of activities and offers plenty of relaxing spaces for peaceful personal times and vibrant interactions with friends and fellow residents. The community’s ideal location also provides easy access to a variety of shops, grocery stores, and restaurants whenever residents want to go out and explore. Residents also enjoy access to a wellness center with a state-of-the-art fitness center, indoor heated pool, and a sports court to foster fitness and well-being.

Quality ratings

Measured by Centers for Medicare & Medicaid Services (CMS)

Overall rating Info The Overall CMS Rating combines results from health inspections, staffing levels and quality measures. Health inspections carry the most weight. Staffing and quality scores can increase or decrease the final rating based on performance compared to state and national standards.
▲ 78.8% Above NC avg. ▲ 78.8% Above NC avg.NC average: 2.8Click the badge to see the full State ranking.Click here to see the full State ranking.
Health Inspection Info Based on the results of the facility's three most recent standard inspections and any complaint investigations. CMS reviews the number, scope, and severity of deficiencies, with more recent findings weighted more heavily.
▲ 77.0% Above NC avg. ▲ 77.0% Above NC avg.NC average: 2.8Click the badge to see the full State ranking.Click here to see the full State ranking.
Staffing Info Measures average nursing staff hours per resident per day, including Registered Nurses (RNs) and total nursing staff. Ratings are adjusted based on the level of care residents require and are compared to state and national benchmarks.
▲ 88.0% Above NC avg. ▲ 88.0% Above NC avg.NC average: 2.7Click the badge to see the full State ranking.Click here to see the full State ranking.
Quality Measures Info Based on clinical and physical health indicators reported to CMS, such as hospital readmissions, falls, pressure ulcers, and improvements in mobility. These measures reflect how well residents' health needs are being managed.
▲ 57.5% Above NC avg. ▲ 57.5% Above NC avg.NC average: 3.2Click the badge to see the full State ranking.Click here to see the full State ranking.

Staffing hours breakdown

Info Daily nursing hours per resident by staff type, reported to CMS. Higher is generally better — compare this facility to state and national averages to see where staffing stands.

Hours per resident per day — compared to North Carolina state averages

Staff type Hours / Day / Resident vs state avg
Registered Nurse (RN) Info RNs hold the highest nursing license and can assess residents, interpret test results, and direct care plans. More RN hours per day often signals stronger clinical oversight and faster response to health changes. 53m per day ▲ 44% State avg: 37m per day · National avg: 41m per day
LPN / LVN Info Licensed Practical Nurses (LPNs) or Licensed Vocational Nurses (LVNs) deliver routine hands-on care — medication administration, wound dressing, and monitoring vital signs. They work under RN supervision and make up a large share of daily bedside care. 26m per day ▼ 51% State avg: 53m per day · National avg: 52m per day
Nurse Aide Info Certified Nurse Aides (CNAs) provide the most direct day-to-day assistance: bathing, dressing, feeding, and mobility. Nurse aide hours are typically the largest staffing category and directly affect residents' quality of life. 2h 27m per day ▲ 6% State avg: 2h 19m per day · National avg: 2h 20m per day
Weekend Total Nursing Info Combined nursing hours (RN + LPN + Nurse Aide) per resident per day on weekends. Staffing often drops on weekends — this figure reveals whether the facility maintains adequate coverage outside of weekday hours. 3h 3m per day ▼ 11% State avg: 3h 26m per day · National avg: 3h 27m per day
Physical Therapist Info Hours per resident per day provided by licensed Physical Therapists (PTs) or PT Assistants. PT services help residents recover mobility after injury or illness and are especially important for post-acute (short-stay) rehabilitation. 5m per day ▼ 6% State avg: 5m per day · National avg: 4m per day
Weekend RN Info Registered nurse hours specifically on weekends. Facilities sometimes reduce RN presence on Saturdays and Sundays — a low weekend RN figure compared to weekday hours can indicate reduced clinical oversight when most administrative staff are absent. 21m per day ▼ 12% State avg: 24m per day · National avg: 29m per day

Capacity and availability

This home usually has availability

Higher occupancy than the North Carolina average: 76.4%
Occupancy rate
84.8% Rank #79 / 271Occupancy rate — State benchmarkedThis home is ranked 79th out of 271 homes in North Carolina. Shows this facility's occupancy rate versus the North Carolina average, with its Statewide rank out of 271. Higher occupancy signals strong local demand and financial stability.Rankings are based only on facilities in North Carolina that report data for that category. Facilities without available data are excluded from the ranking.Click the rank badge to see the full State ranking.Click here to see the full State ranking.
Avg. Length of Stay
352 days
Bed community size
69-bed community Rank #195 / 390Bed count — State benchmarkedThis home is ranked 195th out of 390 homes in North Carolina. Shows this facility's certified or reported bed count compared to other North Carolina facilities. Larger communities may offer more amenities, programs, and on-site services for residents and families.Rankings are based only on facilities in North Carolina that report data for that category. Facilities without available data are excluded from the ranking.Click the rank badge to see the full State ranking.Click here to see the full State ranking.
A moderately sized community that may balance personal attention with shared amenities and social activities.
Walk Score
Walk Score: 35 / 100 Rank #260 / 572Walk Score — State benchmarkedThis home is ranked 260th out of 572 homes in North Carolina. Shows how walkable this facility's neighborhood is compared to the average Walk Score across North Carolina facilities. Higher scores benefit residents, families, and staff.Rankings are based only on facilities in North Carolina that report data for that category. Facilities without available data are excluded from the ranking.Click the rank badge to see the full State ranking.Click here to see the full State ranking.
Somewhat walkable. A few nearby services may be reachable on foot, but most trips require transportation.

Therapy & Rehabilitation

2 services
Rehabilitation Services
Respite Care

Staffing & Medical

1 service
24-Hour Staffing

Additional Policies & Features

Minimum Age62

Contact Friends Homes

Staffing Data

Reporting period: October 1 – December 31, 2025 (Q4 2025). Source: CMS Payroll-Based Journal report.

Total staff 156
Employees 132
Contractors 24
Staff to resident ratio 2.44 : 1
36% more staff per resident than North Carolina average
North Carolina average ratio: 1.80 : 1 North Carolina average ratio: 1.80 : 1See full North Carolina ranking
Avg staff/day 45
Average shift 6 hours
25% worse than North Carolina average
North Carolina average: 8 hours North Carolina average shift: 8 hoursSee full North Carolina ranking
Total staff hours (quarter) 24,729

Nursing staff breakdown

Q4 2025 · Oct 1 – Dec 31 More info This data comes from the CMS Payroll-Based Journal report covering October 1 – December 31, 2025.
Registered Nurse

Manages medical care and health needs.

RN Staff Info 5 total: 3 full-time employees and 2 contractors. 5
Average shift length Info Average shift length. Calculated as total hours divided by days worked and average staff per day. 8.3 hours
Licensed Practical Nurse

Assists with medical care and medications.

LPN Staff Info All 19 LPN Staff are full-time employees. No contractors work on this role. 19
Average shift length Info Average shift length. Calculated as total hours divided by days worked and average staff per day. 7.4 hours
Certified Nursing Assistant

Helps with daily care and mobility.

CNA Staff Info 77 total: 76 full-time employees and 1 contractor. 77
Average shift length Info Average shift length. Calculated as total hours divided by days worked and average staff per day. 5.5 hours

Contractor staffing

Q4 2025 · Oct 1 – Dec 31 More info This data comes from the CMS Payroll-Based Journal report covering October 1 – December 31, 2025.

Total hours from contractors

9.1%

2,247 contractor hours this quarter

Physical Therapy Assistant: 15 Respiratory Therapy Technician: 3 Registered Nurse: 2 Certified Nursing Assistant: 1 Occupational Therapy Aide: 1 Medical Director: 1 Occupational Therapy Assistant: 1

Staff by category

Q4 2025 · Oct 1 – Dec 31 More info This data comes from the CMS Payroll-Based Journal report covering October 1 – December 31, 2025.
Certified Nursing Assistant 76 1 77 11,140 92 100% 5.5
Clinical Nurse Specialist 16 0 16 4,218 91 99% 7.9
Medication Aide/Technician 13 0 13 2,482 92 100% 6.2
Licensed Practical Nurse 19 0 19 2,419 92 100% 7.4
Physical Therapy Assistant 1 15 16 1,359 73 79% 3.8
Other Social Services Staff 1 0 1 512 64 70% 8
Nurse Practitioner 1 0 1 496 62 67% 8
Administrator 1 0 1 472 59 64% 8
Respiratory Therapy Technician 0 3 3 462 66 72% 4.1
Mental Health Service Worker 1 0 1 457 58 63% 7.9
Occupational Therapy Aide 0 1 1 448 56 61% 8
Registered Nurse 3 2 5 183 18 20% 8.3
Medical Director 0 1 1 57 20 22% 2.9
Occupational Therapy Assistant 0 1 1 25 2 2% 12.4
77 Certified Nursing Assistant
% of Days 100%
16 Clinical Nurse Specialist
% of Days 99%
13 Medication Aide/Technician
% of Days 100%
19 Licensed Practical Nurse
% of Days 100%
16 Physical Therapy Assistant
% of Days 79%
1 Other Social Services Staff
% of Days 70%
1 Nurse Practitioner
% of Days 67%
1 Administrator
% of Days 64%
3 Respiratory Therapy Technician
% of Days 72%
1 Mental Health Service Worker
% of Days 63%
1 Occupational Therapy Aide
% of Days 61%
5 Registered Nurse
% of Days 20%
1 Medical Director
% of Days 22%
1 Occupational Therapy Assistant
% of Days 2%

Penalties and fines

Federal penalties imposed by CMS for regulatory violations, including civil money penalties (fines) and denials of payment for new Medicare/Medicaid admissions.

Source: CMS Penalties Database

No penalties in the past 3 years

No civil money penalties or payment denials were reported in the last 3 years.

Quality of care over time

These measures show how residents usually do over time at this home, based on health outcomes and preventive care.

High-risk clinical events score Info A composite score based on pressure ulcers, falls with injury, weight loss, walking ability decline, and activities of daily living decline. 14.5
27% worse than North Carolina average

North Carolina average: 11.5

Functional decline score Info A composite score based on activities of daily living decline, walking ability decline, and incontinence. 31.6
53% worse than North Carolina average

North Carolina average: 20.6

Long-stay resident measures
Need for Help with Daily Activities Increased Info Percent of long-stay residents whose need for help with daily activities has increased 38.6%
120% worse than North Carolina average

North Carolina average: 17.5%

Walking Ability Worsened Info Percent of long-stay residents whose ability to move independently worsened 24.6%
6% worse than North Carolina average

North Carolina average: 23.3%

Low Risk Residents with Bowel/Bladder Incontinence Info Percent of low risk long-stay residents who lose control of their bowels or bladder 31.5%
47% worse than North Carolina average

North Carolina average: 21.4%

Falls with Major Injury Info Percent of long-stay residents experiencing one or more falls with major injury 2.6%
29% better than North Carolina average

North Carolina average: 3.6%

High Risk Residents with Pressure Ulcers Info Percent of long-stay high risk residents with pressure ulcers 2.5%
61% better than North Carolina average

North Carolina average: 6.3%

Urinary Tract Infection Info Percent of long-stay residents with a urinary tract infection 6.0%
130% worse than North Carolina average

North Carolina average: 2.6%

Lost Too Much Weight Info Percent of long-stay residents who lose too much weight 4.4%
40% better than North Carolina average

North Carolina average: 7.4%

Depressive Symptoms Info Percent of long-stay residents who have depressive symptoms 3.6%
18% better than North Carolina average

North Carolina average: 4.4%

Antipsychotic Use Info Percent of long-stay residents who received an antipsychotic medication 15.5%
15% worse than North Carolina average

North Carolina average: 13.4%

Pneumococcal Vaccine Info Percent of long-stay residents assessed and appropriately given the pneumococcal vaccine 97.0%
6% better than North Carolina average

North Carolina average: 91.6%

Influenza Vaccine Info Percent of long-stay residents assessed and appropriately given the seasonal influenza vaccine 100.0%
6% better than North Carolina average

North Carolina average: 94.1%

Short-stay resident measures
Pneumococcal Vaccine Info Percent of short-stay residents assessed and appropriately given the pneumococcal vaccine 92.0%
15% better than North Carolina average

North Carolina average: 79.9%

Antipsychotic medication increase Info Percent of short-stay residents who newly received an antipsychotic medication 1.1%
27% better than North Carolina average

North Carolina average: 1.5%

Influenza Vaccine Info Percent of short-stay residents assessed and appropriately given the seasonal influenza vaccine 91.2%
17% better than North Carolina average

North Carolina average: 78.1%

Breakdown by payment type

Medicare

28% of new residents, usually for short-term rehab.

Typical stay 15 days

Private pay

70% of new residents, often for short stays.

Typical stay 1 - 2 years

Medicaid

1% of new residents, often for long-term daily care.

Typical stay 4 - 5 years

Facility Characteristics

Source: CMS Long-Term Care Facility Characteristics (Data as of Jan 2026)

Total residents 64
Medicare
2
3.1% of residents
Medicaid
9
14.1% of residents
Private pay or other
53
82.8% of residents
Programs & Services
Residents Group

Residents meet regularly to discuss policies, care quality, and activities

CCRC

Part of a Continuing Care Retirement Community offering multiple care levels

Active Resident Council

Organized group of residents that meets regularly to discuss facility policies, quality of life, and activities.

Finances and operations

Based on CMS SNF Cost Report for fiscal year ending in 09/2023.

Nonprofit
Nonprofit Corporation
Net patient revenue Info Net patient revenue — what the home actually collects for resident care, after contractual allowances, bad debt and discounts are subtracted from its gross charges (CMS cost report, Worksheet G-3). It covers resident care only; money the home earns from other sources is shown separately as "Other income."
$18.9M
Net patient income Info Net patient income: net patient revenue minus the home's total operating expenses. A positive figure means it earns more from resident care than it spends to deliver it; a negative figure means the opposite. It excludes non-operating "other income."
-$8.0M
Nonprofit Nonprofit Corporation
Net patient revenue Info Net patient revenue — what the home actually collects for resident care, after contractual allowances, bad debt and discounts are subtracted from its gross charges (CMS cost report, Worksheet G-3). It covers resident care only; money the home earns from other sources is shown separately as "Other income."
$18.9M Rank #25 / 104Revenue — State benchmarkedThis home is ranked 25th out of 104 homes in North Carolina. Shows this facility's annual revenue compared to the North Carolina average. Higher revenue generally means more resources for staffing and capital — read alongside Payroll %.Rankings are based only on facilities in North Carolina that report data for that category. Facilities without available data are excluded from the ranking.Click the rank badge to see the full State ranking.Click here to see the full State ranking.
Net patient income Info Net patient income: net patient revenue minus the home's total operating expenses. A positive figure means it earns more from resident care than it spends to deliver it; a negative figure means the opposite. It excludes non-operating "other income."
-$8.0M
Other income Info Money the home earns outside of resident care — such as investments, grants, rentals and other non-operating sources (CMS cost report, Worksheet G-3). It is tracked separately from net patient revenue: it is not part of that figure, and it is not included in net patient income.
$4.7M
Payroll costs Info Staff salaries plus wage-related costs — benefits such as payroll taxes, health insurance and retirement — from the home's own accounting records (CMS cost report, Worksheet A). Contract or agency labor is counted separately, under other operating costs. Rank #24 / 104Payroll — State benchmarkedThis home is ranked 24th out of 104 homes in North Carolina. Shows total annual staff payroll benchmarked to the North Carolina average. Higher payroll investment relative to peers often signals better staffing and less reliance on cheaper contract labor.Rankings are based only on facilities in North Carolina that report data for that category. Facilities without available data are excluded from the ranking.Click the rank badge to see the full State ranking.Click here to see the full State ranking.
$10.8M 57.4% of net patient revenue Info Payroll as a share of revenue: staff salaries and wage-related benefits divided by net patient revenue. A higher figure means more of each revenue dollar goes to staff pay. Rank #35 / 104Payroll % — State benchmarkedThis home is ranked 35th out of 104 homes in North Carolina. Shows payroll as a percentage of revenue versus the North Carolina average. Well-run North Carolina facilities typically land around 49–62% — the top third Statewide. Below 25% may signal understaffing or heavy agency use — read with Staffing ratings.Rankings are based only on facilities in North Carolina that report data for that category. Facilities without available data are excluded from the ranking.Click the rank badge to see the full State ranking.Click here to see the full State ranking.
Other operating costs Info Everything it costs to run the home apart from payroll — food, utilities, supplies, maintenance, contract labor and administration. Calculated as total operating expense minus payroll (staff salaries and wage-related benefits).
$16.1M
Total costs Info The home's total operating expense for the year — all the costs of running it, salaries included (CMS cost report, Worksheet G-3).
$27.0M

What does this home offer?

Room sizes icon
Room sizes icon

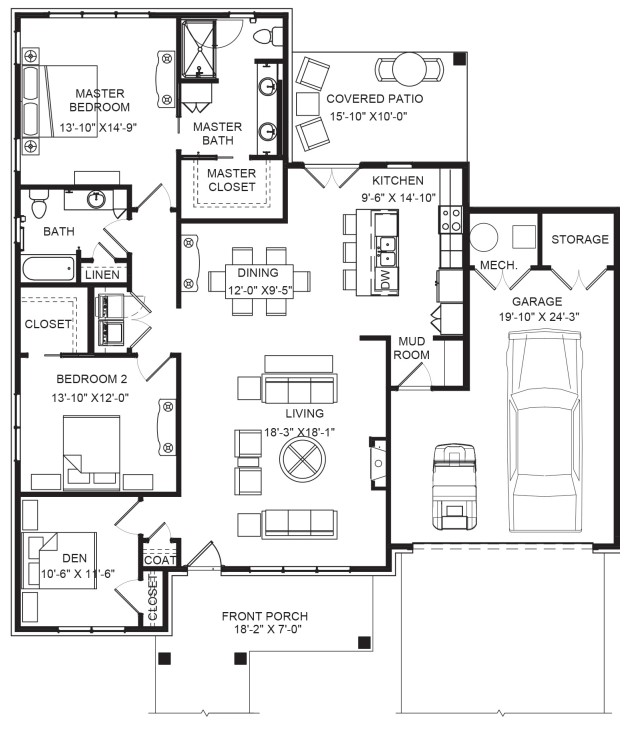
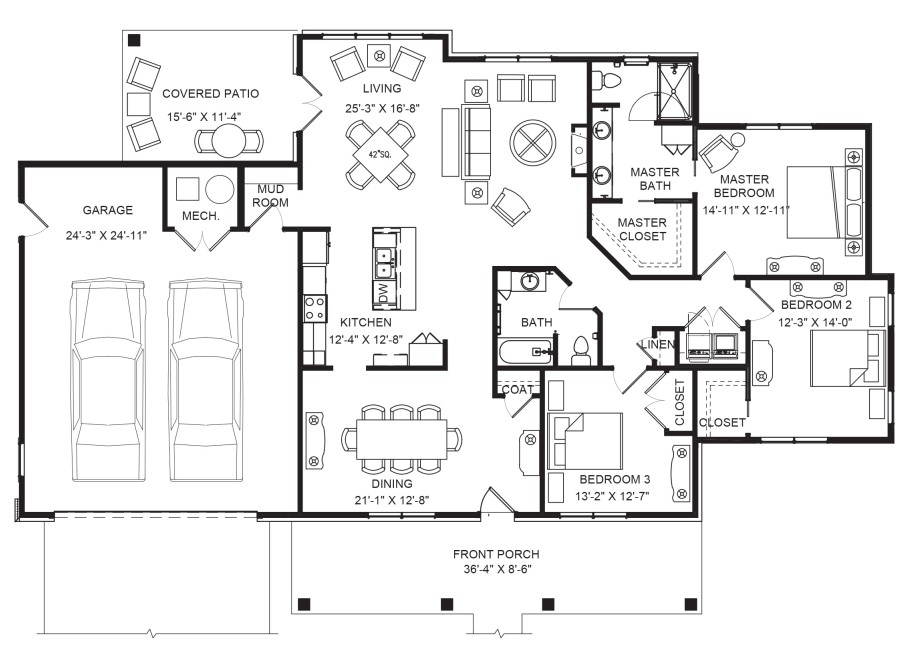
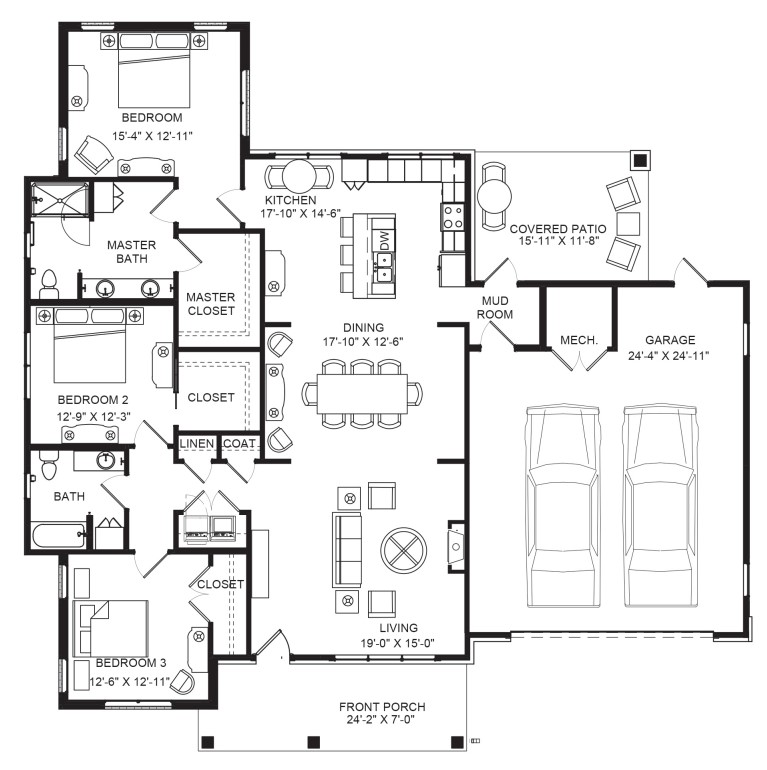
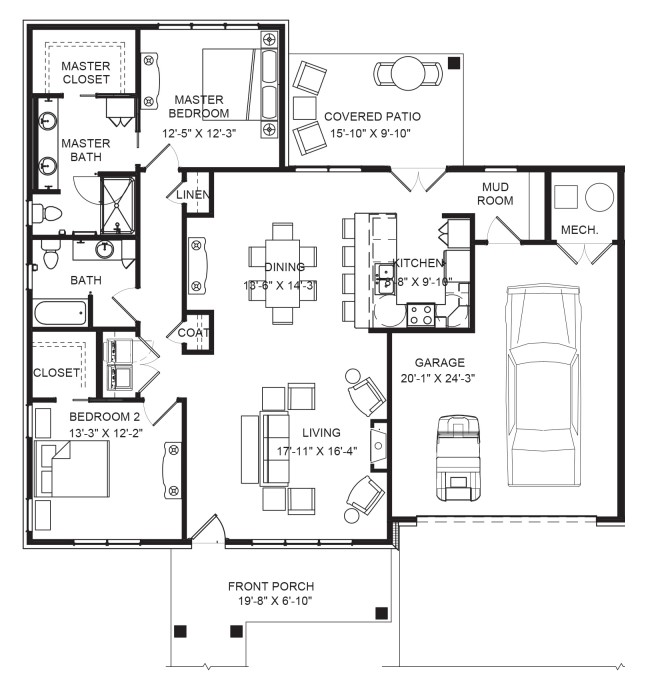
Room Sizes: 334-1352 / 1419-1659 / 1492-1872 / 910-1919 sq. ft

Housing options icon

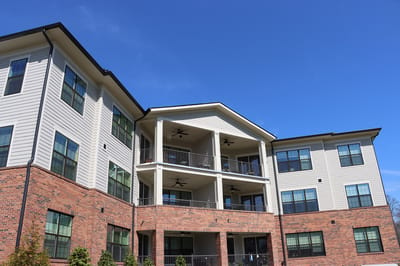
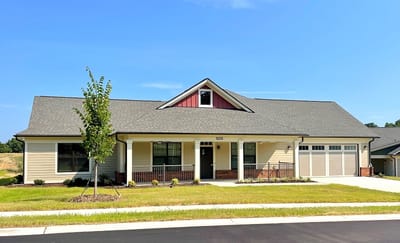
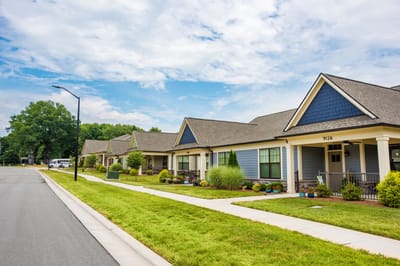
Housing Options: Villa Apartments / Townhomes / Apartments / Cottages

Building type icon
Building type icon

Building Type: 3-story

Transportation services icon

Transportation Services

Fitness and recreation icon

Fitness and Recreation

Who this home usually serves

TYPE OF STAY

Primarily short stays

Residents typically stay for brief periods, with frequent admissions and discharges throughout the year.

Most new residents arrive under private pay (70% of admissions), and a typical private pay stay runs around 1 - 2 years.

Admissions
88 total

Coverage residents most often arrive under.

Medicare 28%
Private pay 70%
Medicaid 1%
Discharges
113 total

Coverage residents most often leave under.

Medicare 8%
Private pay 84%
Medicaid 8%

Living Spaces & Floor Plans for Friends Homes

Places of interest near Friends Homes

Address 6.3 miles from city center Info Estimated distance in miles from Greensboro's city center to Friends Homes's address, calculated via Google Maps.

Calculate Travel Distance to Friends Homes

Add your location

Address

Financial Assistance for
Assisted Living in North Carolina

Friends Homes is located in Greensboro, North Carolina.
Here are the financial assistance programs available to residents in North Carolina.

Get Financial aid guidance

Community Alternatives Program for Disabled Adults

NC Medicaid CAP/DA

Age 65+ or disabled
General North Carolina resident, Medicaid- eligible, nursing home-level care need.
Income Limits (2025) ~$2,829/month 300% FBR, individual
Asset Limits $2,000 (individual), $3,000 (couple).
NC

High demand; waitlists common in urban areas.

Benefits
Personal care (5-7 hours/day) Respite (240 hours/year) Adult day care ($60/day) Home modifications ($1,500 avg.)

North Carolina Senior Care Options

NC SCO (via NFCSP)

Age Caregiver of someone 60+ (or with dementia)
General North Carolina resident.
Income Limits No strict limit; prioritizes low-income.
Asset Limits Not applicable.
NC

Limited slots; rural/urban balance.

Benefits
In-home respite (4-6 hours/day) Adult day care (~$60/day) Short-term facility care (up to 5 days)

Program of All-Inclusive Care for the Elderly (PACE)

North Carolina PACE (e.g., PACE of the Triad)

Age 55+
General NC resident (specific counties), NFLOC, safe with PACE support.
Income Limits (2025) ~$2,829/month (Medicaid-eligible); private pay option available.
Asset Limits $2,000 (individual), $3,000 (couple) for Medicaid enrollees.
NC

Available in 10+ counties (e.g., Guilford, Wake); multiple providers (e.g., PACE of the Southern Piedmont).

Benefits
Personal care (5-7 hours/day) Medical care Meals Transportation Respite Therapies

In-Home Aide Services

North Carolina In-Home Aide Services

Age 60+
General NC resident, unable to perform 1+ ADL, at risk of nursing home placement.
Income Limits (2025) No strict cap; prioritizes low-income ~$24,980/year
Asset Limits Not assessed; need-based.
NC

Family can be aides; varies by county funding.

Benefits
Personal care (5-20 hours/week) Meal prep Respite (~5 days/year) Errands

Medicare Savings Program (MSP)

North Carolina Medicare Savings Program

Age 65+ or disabled
General NC resident, Medicare Part A/B.
Income Limits (2025) ~$2,510/month (QMB), ~$3,380/month (SLMB), ~$3,598/month (QI)—individual.
Asset Limits $9,430 (individual), $14,130 (couple).
NC

Three tiers; no waitlist; includes Extra Help for Part D.

Benefits
Covers Part B premiums ($174.70/month) Deductibles ($240/year) Copays (~20%)

VA Aid and Attendance (A&A) and Housebound Benefits

North Carolina VA Aid and Attendance/Housebound

Age 65+ or disabled veteran/spouse
General NC resident, wartime service, need for ADL help (A&A) or homebound.
Income Limits (2025) Net income < ~$1,984/month (veteran with dependent, A&A); pension offsets income.
Asset Limits ~$155,356 net worth limit
NC

High veteran demand in rural/urban areas.

Benefits
Cash (~$1,433-$2,642/month veteran, ~$951-$1,318 spouse) for care costs (e.g., in-home, assisted living)

Urgent Repair Program (URP)

North Carolina Urgent Repair Program

Age 60+ prioritized
General NC resident, homeowner, low-income.
Income Limits (2025) ~$30,258/year 50% AMI, varies by county
Asset Limits Not strictly assessed; home value considered.
NC

Forgivable at $2,000/year; statewide via local partners.

Benefits
Repairs (~$8,000-$12,000 avg.) for safety (e.g., roofs, heating, accessibility)

State/County Special Assistance (SA)

North Carolina Special Assistance

Age 65+ (or disabled)
General NC resident, in licensed adult care home, low-income.
Income Limits (2025) ~$1,255/month (individual, 100% FPL); varies by facility rate.
Asset Limits $2,000 individual
NC

Covers assisted living; counties supplement state funds.

Benefits
Cash (~$1,200-$1,500/month) for room/board; Medicaid covers care services

Frequently Asked Questions about Friends Homes

What neighborhood is Friends Homes in?

Friends Homes is in the Guilford College neighborhood.

Is Friends Homes in a walkable area?

Friends Homes has a walk score of 35. Somewhat walkable. A few nearby services may be reachable on foot, but most trips require transportation.

What is the occupancy rate at Friends Homes?

Friends Homes's occupancy is 84.8%.

Does Friends Homes operate as a for-profit or non-profit?

Friends Homes is registered as a non-profit.

Are there photos of Friends Homes?

Yes — there are 15 photos of Friends Homes in the photo gallery on this page.

What is the address of Friends Homes?

Friends Homes is located at 925 New Garden Rd, Greensboro, NC 27410.

What is the phone number of Friends Homes?

(336) 369-2559 will put you in contact with the team at Friends Homes.

Guides for Better Senior Living

Care Cost Calculator: See Prices in Your Area

Nursing Home Data Explorer

Don’t Wait Too Long: 7 Red Flag Signs Your Parent Needs Assisted Living Now

The True Cost of Assisted Living in 2025 – And How Families Are Paying For It

Understanding Senior Living Costs: Pricing Models, Discounts & Financial Assistance