Givens Highland Farms
Nursing Home, Home Care, Independent Living, Nursing Care & Respite Care · North Carolina, NC
CMS overall rating Info CMS (the Centers for Medicare & Medicaid Services) is the federal agency that rates nursing home quality. Its Overall Rating runs from 1 to 5 stars, combining health inspections, staffing, and quality measures, with inspections weighted most heavily.

Givens Highland Farms

Nursing Home, Home Care, Independent Living, Nursing Care & Respite Care · North Carolina, NC
CMS overall rating Info CMS (the Centers for Medicare & Medicaid Services) is the federal agency that rates nursing home quality. Its Overall Rating runs from 1 to 5 stars, combining health inspections, staffing, and quality measures, with inspections weighted most heavily.
Calculator: See prices in your area
Givens Highland Farms accepts Medicare, Medicaid, and private pay.

Overview of Givens Highland Farms

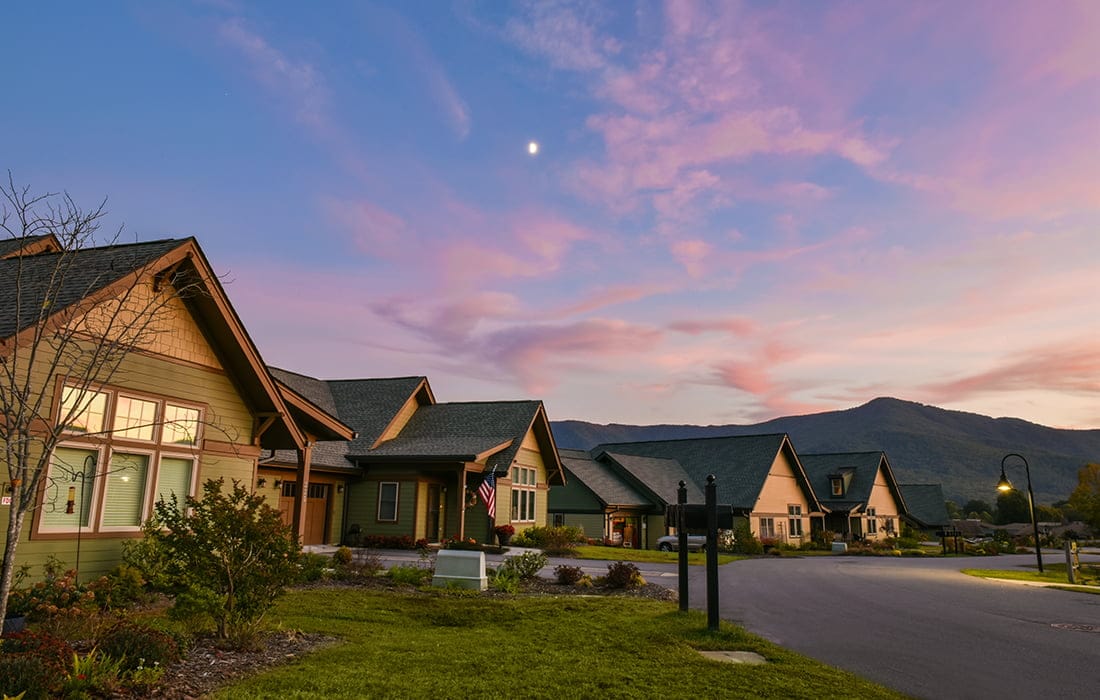
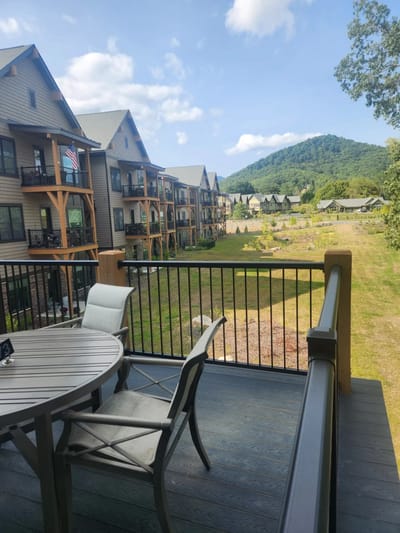
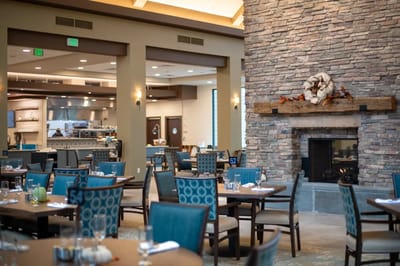
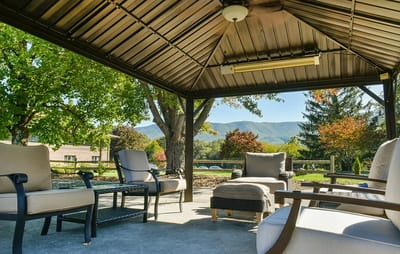
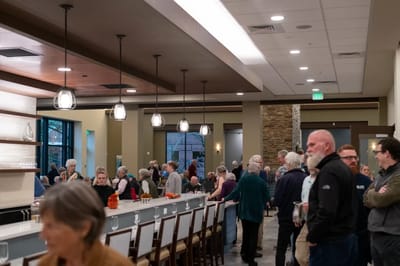
At Givens Highland Farms, the vision is to empower seniors to lead fulfilling lives, fostering independence, community, and security. Offering home care and enhanced independent living, residents can explore their interests through numerous resident-led groups and enjoy the beauty of Black Mountain’s nature. With quality health services available on-site, seniors experience peace of mind knowing their needs will be met.

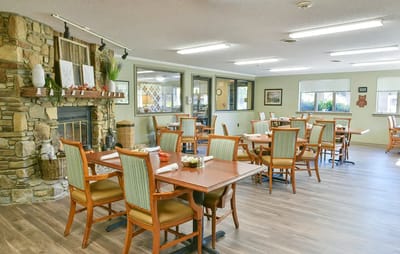
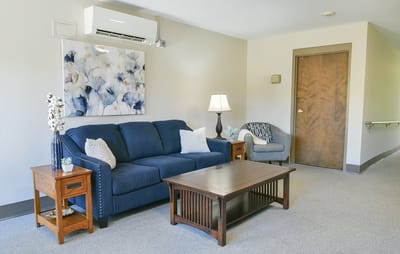
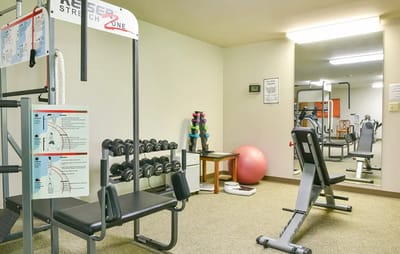
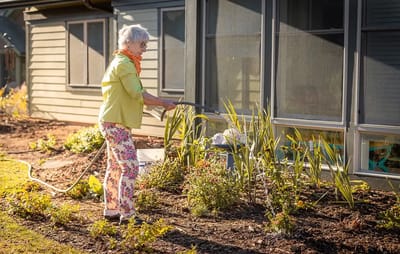
The community offers an array of amenities, including a winter greenhouse, dog park, and woodworking shop. Residents can engage in indoor activities like arts and crafts or utilize the fitness programs and medical services. Givens Highland Farms prioritizes active senior living and well-being from spacious residences to transportation services. Givens Highland Farms is the top choice for independent living and home services in Black Mountain, North Carolina.

(828) 357-3611

Quality ratings

Measured by Centers for Medicare & Medicaid Services (CMS)

Overall rating Info The Overall CMS Rating combines results from health inspections, staffing levels and quality measures. Health inspections carry the most weight. Staffing and quality scores can increase or decrease the final rating based on performance compared to state and national standards.
▲ 78.8% Above NC avg. ▲ 78.8% Above NC avg.NC average: 2.8Click the badge to see the full State ranking.Click here to see the full State ranking.
Health Inspection Info Based on the results of the facility's three most recent standard inspections and any complaint investigations. CMS reviews the number, scope, and severity of deficiencies, with more recent findings weighted more heavily.
▲ 41.6% Above NC avg. ▲ 41.6% Above NC avg.NC average: 2.8Click the badge to see the full State ranking.Click here to see the full State ranking.
Staffing Info Measures average nursing staff hours per resident per day, including Registered Nurses (RNs) and total nursing staff. Ratings are adjusted based on the level of care residents require and are compared to state and national benchmarks.
▲ 88.0% Above NC avg. ▲ 88.0% Above NC avg.NC average: 2.7Click the badge to see the full State ranking.Click here to see the full State ranking.
Quality Measures Info Based on clinical and physical health indicators reported to CMS, such as hospital readmissions, falls, pressure ulcers, and improvements in mobility. These measures reflect how well residents' health needs are being managed.
▲ 26.0% Above NC avg. ▲ 26.0% Above NC avg.NC average: 3.2Click the badge to see the full State ranking.Click here to see the full State ranking.

Staffing hours breakdown

Info Daily nursing hours per resident by staff type, reported to CMS. Higher is generally better — compare this facility to state and national averages to see where staffing stands.

Hours per resident per day — compared to North Carolina state averages

Total nursing care / resident Info This home is ranked 16th out of 97 homes in North Carolina for nurse hours. Total adjusted nursing hours per resident per day, combining RN, LPN, and aide time. CMS adjusts this for case-mix so facilities can be fairly compared.
5h 34m per day
Rank #16 / 97Nurse hours — State benchmarkedThis home is ranked 16th out of 97 homes in North Carolina. Shows adjusted nurse hours per resident per day benchmarked to the North Carolina average, with a ranking across 97 North Carolina facilities. More hours mean more direct care. The national average is about 3.5 hrs; below 3.0 is a red flag.Ranking totals vary by category as each rank only includes facilities that report data for that metric. Homes missing that data point aren't included in the ranking.Click the rank badge to see the full State ranking.Click here to see the full State ranking.
This facility North Carolina avg (3h 59m per day)
vs North Carolina avg
+40%

2 of 6 metrics below state avg

Standout metric Registered Nurse (RN) is +88% above state avg
Staff typeHours / Day / Residentvs state avg
Registered Nurse (RN) Info RNs hold the highest nursing license and can assess residents, interpret test results, and direct care plans. More RN hours per day often signals stronger clinical oversight and faster response to health changes. 1h 9m per day ▲ 88% State avg: 37m per day · National avg: 41m per day
LPN / LVN Info Licensed Practical Nurses (LPNs) or Licensed Vocational Nurses (LVNs) deliver routine hands-on care — medication administration, wound dressing, and monitoring vital signs. They work under RN supervision and make up a large share of daily bedside care. 41m per day ▼ 23% State avg: 53m per day · National avg: 52m per day
Nurse Aide Info Certified Nurse Aides (CNAs) provide the most direct day-to-day assistance: bathing, dressing, feeding, and mobility. Nurse aide hours are typically the largest staffing category and directly affect residents' quality of life. 3h 2m per day ▲ 30% State avg: 2h 19m per day · National avg: 2h 20m per day
Weekend Total Nursing Info Combined nursing hours (RN + LPN + Nurse Aide) per resident per day on weekends. Staffing often drops on weekends — this figure reveals whether the facility maintains adequate coverage outside of weekday hours. 4h 11m per day ▲ 22% State avg: 3h 26m per day · National avg: 3h 27m per day
Physical Therapist Info Hours per resident per day provided by licensed Physical Therapists (PTs) or PT Assistants. PT services help residents recover mobility after injury or illness and are especially important for post-acute (short-stay) rehabilitation. 5m per day ▼ 15% State avg: 5m per day · National avg: 4m per day
Weekend RN Info Registered nurse hours specifically on weekends. Facilities sometimes reduce RN presence on Saturdays and Sundays — a low weekend RN figure compared to weekday hours can indicate reduced clinical oversight when most administrative staff are absent. 44m per day ▲ 82% State avg: 24m per day · National avg: 29m per day

Capacity and availability

This home usually has availability

Higher occupancy than the North Carolina average: 76.4%
Occupancy rate
82.2% Rank #92 / 271Occupancy rate — State benchmarkedThis home is ranked 92nd out of 271 homes in North Carolina. Shows this facility's occupancy rate versus the North Carolina average, with its Statewide rank out of 271. Higher occupancy signals strong local demand and financial stability.Ranking totals vary by category as each rank only includes facilities that report data for that metric. Homes missing that data point aren't included in the ranking.Click the rank badge to see the full State ranking.Click here to see the full State ranking.
Avg. Length of Stay
112 days
Bed community size
60-bed community Rank #233 / 390Bed count — State benchmarkedThis home is ranked 233rd out of 390 homes in North Carolina. Shows this facility's certified or reported bed count compared to other North Carolina facilities. Larger communities may offer more amenities, programs, and on-site services for residents and families.Ranking totals vary by category as each rank only includes facilities that report data for that metric. Homes missing that data point aren't included in the ranking.Click the rank badge to see the full State ranking.Click here to see the full State ranking.
A moderately sized community that may balance personal attention with shared amenities and social activities.
Years in operation
55 years in operation
A longer operating history, which may indicate experience navigating regulations and delivering ongoing care.
Walk Score
Walk Score: 12 / 100 Rank #440 / 572Walk Score — State benchmarkedThis home is ranked 440th out of 572 homes in North Carolina. Shows how walkable this facility's neighborhood is compared to the average Walk Score across North Carolina facilities. Higher scores benefit residents, families, and staff.Ranking totals vary by category as each rank only includes facilities that report data for that metric. Homes missing that data point aren't included in the ranking.Click the rank badge to see the full State ranking.Click here to see the full State ranking.
Car-dependent. Most errands require a car, with limited nearby walkable options.

About this community

License Details

CMS Certification Number345078

Safety & Compliance

Emergency SystemsEmergency call system responded to by 24/7 Safety and Security Team Member.

Staffing

Key information about the people who lead and staff this community.

Leadership

ContactMr. Ken Kramer, Executive Director

Payment & Insurance

1 service
Accept Medicare

Therapy & Rehabilitation

2 services
Rehabilitation Services
Respite Care

Staffing & Medical

1 service
24-Hour Staffing

Additional Services

1 service
Home Care

Amenities & Lifestyle

Winter Greenhouse
Expansive Community Garden
Two Dog Parks
Extensive Library
Well-Equipped Woodworking Shop
Arts And Crafts Studio
Beauty Salon And Barbershop
Exercise Equipment Room
Exercise Studio
Walk-In Medical Clinic
Multiple Walking Trails
Specific ProgramsOutdoor Life, Community Services

Dining & Nutrition

Food DescriptionGivens Highland Farms offers chef-created menus that combine home-cooked favorites with restaurant-style entrees, available in the dining room or as grab-and-go options.

Contact Givens Highland Farms

Health Inspection History

Inspections since 2023
Total health inspections 3

North Carolina average 4


Last Health inspection on Aug 2025

Total health citations
14 Rank #50 / 101Health citations — State benchmarkedThis home is ranked 50th out of 101 homes in North Carolina. Shows this facility's total health deficiency citations benchmarked to the North Carolina State average, with a ranking across all 101 NC facilities. Lower citation counts earn a better rank.Ranking totals vary by category as each rank only includes facilities that report data for that metric. Homes missing that data point aren't included in the ranking.Click the rank badge to see the full State ranking.Click here to see the full State ranking.

North Carolina average 20.9

Citations per inspection
4.67 Rank #58 / 101Citations per inspection — State benchmarkedThis home is ranked 58th out of 101 homes in North Carolina. Shows average deficiency citations per CMS inspection for this facility versus the North Carolina mean across 101 facilities with citation data. Lower is better.Ranking totals vary by category as each rank only includes facilities that report data for that metric. Homes missing that data point aren't included in the ranking.Click the rank badge to see the full State ranking.Click here to see the full State ranking.

North Carolina average 4.99


Health citations are formal notices following inspections when they fail to comply with safety and care standards.

7 of 14 citations resulted from standard inspections; and 7 of 14 came from combined inspections (standard and complaint).

Breakdown of citation severity (last 3 years)
Critical health citations
0
100% better than North Carolina average

North Carolina average: 1.3


Serious health citations
0
100% better than North Carolina average

North Carolina average: 0.9

0 critical citations North Carolina average: 1.3

0 serious citations North Carolina average: 0.9

13 moderate citations North Carolina average: 17.1

1 minor citation North Carolina average: 1.6
Citations history (last 3 years)
Nutrition moderate citation Aug 15, 2025
Corrected

Quality of Care moderate citation Aug 15, 2025
Corrected

Resident Rights moderate citation Aug 15, 2025
Corrected

Infection Control moderate citation Aug 22, 2024
Corrected

Staffing Data

Reporting period: October 1 – December 31, 2025 (Q4 2025). Source: CMS Payroll-Based Journal report.

Total staff 108
Employees 67
Contractors 41
Staff to resident ratio 2.20 : 1
23% more staff per resident than North Carolina average
North Carolina average ratio: 1.80 : 1 North Carolina average ratio: 1.80 : 1See full North Carolina ranking
Avg staff/day 32
Average shift 8.6 hours
8% better than North Carolina average
North Carolina average: 8 hours North Carolina average shift: 8 hoursSee full North Carolina ranking
Total staff hours (quarter) 25,192

Nursing staff breakdown

Q4 2025 · Oct 1 – Dec 31 More info This data comes from the CMS Payroll-Based Journal report covering October 1 – December 31, 2025.
Registered Nurse

Manages medical care and health needs.

RN Staff Info All 11 RN Staff are full-time employees. No contractors work on this role. 11
Average shift length Info Average shift length. Calculated as total hours divided by days worked and average staff per day. 8.9 hours
Licensed Practical Nurse

Assists with medical care and medications.

LPN Staff Info 10 total: 6 full-time employees and 4 contractors. 10
Average shift length Info Average shift length. Calculated as total hours divided by days worked and average staff per day. 10.1 hours
Certified Nursing Assistant

Helps with daily care and mobility.

CNA Staff Info 62 total: 43 full-time employees and 19 contractors. 62
Average shift length Info Average shift length. Calculated as total hours divided by days worked and average staff per day. 9.4 hours

Contractor staffing

Q4 2025 · Oct 1 – Dec 31 More info This data comes from the CMS Payroll-Based Journal report covering October 1 – December 31, 2025.

Total hours from contractors

11.6%

2,917 contractor hours this quarter

Certified Nursing Assistant: 19 Licensed Practical Nurse: 4 Speech Language Pathologist: 4 Respiratory Therapy Technician: 3 Physical Therapy Aide: 3 Qualified Social Worker: 3 Physical Therapy Assistant: 2 Occupational Therapy Assistant: 1 Occupational Therapy Aide: 1 Medical Director: 1

Staff by category

Q4 2025 · Oct 1 – Dec 31 More info This data comes from the CMS Payroll-Based Journal report covering October 1 – December 31, 2025.
Certified Nursing Assistant43196214,14892100%9.4
Licensed Practical Nurse64103,18692100%10.1
Registered Nurse110113,18092100%8.9
Clinical Nurse Specialist5051,6829098%9
Speech Language Pathologist0446666975%4.5
Nurse Practitioner1015036368%8
Qualified Social Worker0334756267%5.9
Physical Therapy Aide0334116368%5.9
Physical Therapy Assistant0224006874%5.3
Respiratory Therapy Technician0333526672%3.5
Occupational Therapy Aide0118667%14.3
Occupational Therapy Assistant0116667%10.9
Medical Director0113033%10
RN Director of Nursing101922%4.3
62 Certified Nursing Assistant
% of Days 100%
10 Licensed Practical Nurse
% of Days 100%
11 Registered Nurse
% of Days 100%
5 Clinical Nurse Specialist
% of Days 98%
4 Speech Language Pathologist
% of Days 75%
1 Nurse Practitioner
% of Days 68%
3 Qualified Social Worker
% of Days 67%
3 Physical Therapy Aide
% of Days 68%
2 Physical Therapy Assistant
% of Days 74%
3 Respiratory Therapy Technician
% of Days 72%
1 Occupational Therapy Aide
% of Days 7%
1 Occupational Therapy Assistant
% of Days 7%
1 Medical Director
% of Days 3%
1 RN Director of Nursing
% of Days 2%

Penalties and fines

Includes penalties issued in 2024

Federal penalties imposed by CMS for regulatory violations, including civil money penalties (fines) and denials of payment for new Medicare/Medicaid admissions.

Source: CMS Penalties Database (Data as of Jan 2026)

Total fines amount $4K Rank #49 / 105Federal fines — State benchmarkedThis home is ranked 49th out of 105 homes in North Carolina. Shows this facility's cumulative CMS federal fine dollars versus the North Carolina average among facilities with fines, and where it ranks among 105 facilities in the pool. Lower total dollars mean a better rank.Ranking totals vary by category as each rank only includes facilities that report data for that metric. Homes missing that data point aren't included in the ranking.Click the rank badge to see the full State ranking.Click here to see the full State ranking.
94% lower than North Carolina average

North Carolina average: $76K

Number of fines 1
57% fewer fines than North Carolina average

North Carolina average: 2.3

Payment Denials Info Serious action where Medicare and/or Medicaid temporarily stops payments for new residents until issues are fixed. 0
100% fewer payment denials than North Carolina average

North Carolina average: 0.4

Fines amount comparison
This facility $4K
North Carolina average $76K
Penalty History

Penalties are imposed by CMS for violations of federal nursing home regulations.

1 penalty in the past 3 years

Aug 22, 2024 · $4K

Civil Money Penalty Info Fines imposed for noncompliance, which can be assessed per day or per instance of violation. Aug 22, 2024
$4K

Last updated: Jan 2026

Quality of care over time

These measures show how residents usually do over time at this home, based on health outcomes and preventive care.

High-risk clinical events score Info A composite score based on pressure ulcers, falls with injury, weight loss, walking ability decline, and activities of daily living decline. 12.4
8% worse than North Carolina average

North Carolina average: 11.5

Functional decline score Info A composite score based on activities of daily living decline, walking ability decline, and incontinence. 22.9
11% worse than North Carolina average

North Carolina average: 20.6

Long-stay resident measures
Need for Help with Daily Activities Increased Info Percent of long-stay residents whose need for help with daily activities has increased 26.7%
52% worse than North Carolina average

North Carolina average: 17.5%

Walking Ability Worsened Info Percent of long-stay residents whose ability to move independently worsened 11.7%
50% better than North Carolina average

North Carolina average: 23.3%

Low Risk Residents with Bowel/Bladder Incontinence Info Percent of low risk long-stay residents who lose control of their bowels or bladder 30.3%
42% worse than North Carolina average

North Carolina average: 21.4%

Falls with Major Injury Info Percent of long-stay residents experiencing one or more falls with major injury 15.7%
330% worse than North Carolina average

North Carolina average: 3.6%

High Risk Residents with Pressure Ulcers Info Percent of long-stay high risk residents with pressure ulcers 4.8%
24% better than North Carolina average

North Carolina average: 6.3%

Urinary Tract Infection Info Percent of long-stay residents with a urinary tract infection 0.6%
76% better than North Carolina average

North Carolina average: 2.6%

Lost Too Much Weight Info Percent of long-stay residents who lose too much weight 3.1%
58% better than North Carolina average

North Carolina average: 7.4%

Depressive Symptoms Info Percent of long-stay residents who have depressive symptoms 3.1%
29% better than North Carolina average

North Carolina average: 4.4%

Antipsychotic Use Info Percent of long-stay residents who received an antipsychotic medication 6.0%
55% better than North Carolina average

North Carolina average: 13.4%

Pneumococcal Vaccine Info Percent of long-stay residents assessed and appropriately given the pneumococcal vaccine 95.8%
5% better than North Carolina average

North Carolina average: 91.6%

Influenza Vaccine Info Percent of long-stay residents assessed and appropriately given the seasonal influenza vaccine 100.0%
6% better than North Carolina average

North Carolina average: 94.1%

Short-stay resident measures
Pneumococcal Vaccine Info Percent of short-stay residents assessed and appropriately given the pneumococcal vaccine 85.0%
6% better than North Carolina average

North Carolina average: 79.9%

Antipsychotic medication increase Info Percent of short-stay residents who newly received an antipsychotic medication 0.0%
100% better than North Carolina average

North Carolina average: 1.5%

Influenza Vaccine Info Percent of short-stay residents assessed and appropriately given the seasonal influenza vaccine 96.3%
23% better than North Carolina average

North Carolina average: 78.1%

Breakdown by payment type

Medicare

62% of new residents, usually for short-term rehab.

Typical stay 26 days

Private pay

38% of new residents, often for short stays.

Typical stay 6 - 7 months

Medicaid

1% of new residents, often for long-term daily care.

Typical stay 6 years

Facility Characteristics

Source: CMS Long-Term Care Facility Characteristics (Data as of Jan 2026)

Total residents 49
Medicare
6
12.2% of residents
Medicaid
8
16.3% of residents
Private pay or other
35
71.4% of residents
Programs & Services
Residents Group

Residents meet regularly to discuss policies, care quality, and activities

Family Member Group

Family members meet regularly to discuss policies, care quality, and activities

Nurse Aide Training

State-approved Nurse Aide Training and Competency Evaluation Program on-site

CCRC

Part of a Continuing Care Retirement Community offering multiple care levels

Active Family Council

Organized group of family members that meets regularly to discuss facility policies, resident care, and activities.

Active Resident Council

Organized group of residents that meets regularly to discuss facility policies, quality of life, and activities.

Finances and operations

Based on CMS SNF Cost Report for fiscal year ending in 12/2023.

Governmental community
Operated by a subsidized facility district.
Net patient revenue Info Net patient revenue — what the home actually collects for resident care, after contractual allowances, bad debt and discounts are subtracted from its gross charges (CMS cost report, Worksheet G-3). It covers resident care only; money the home earns from other sources is shown separately as "Other income."
$21.1M
Net patient income Info Net patient income: net patient revenue minus the home's total operating expenses. A positive figure means it earns more from resident care than it spends to deliver it; a negative figure means the opposite. It excludes non-operating "other income."
-$658.5K
Governmental community Operated by a subsidized facility district.
Net patient revenue Info Net patient revenue — what the home actually collects for resident care, after contractual allowances, bad debt and discounts are subtracted from its gross charges (CMS cost report, Worksheet G-3). It covers resident care only; money the home earns from other sources is shown separately as "Other income."
$21.1M Rank #31 / 104Revenue — State benchmarkedThis home is ranked 31st out of 104 homes in North Carolina. Shows this facility's annual revenue compared to the North Carolina average. Higher revenue generally means more resources for staffing and capital — read alongside Payroll %.Ranking totals vary by category as each rank only includes facilities that report data for that metric. Homes missing that data point aren't included in the ranking.Click the rank badge to see the full State ranking.Click here to see the full State ranking.
Net patient income Info Net patient income: net patient revenue minus the home's total operating expenses. A positive figure means it earns more from resident care than it spends to deliver it; a negative figure means the opposite. It excludes non-operating "other income."
-$658.5K
Other income Info Money the home earns outside of resident care — such as investments, grants, rentals and other non-operating sources (CMS cost report, Worksheet G-3). It is tracked separately from net patient revenue: it is not part of that figure, and it is not included in net patient income.
-$13
Payroll costs Info Staff salaries plus wage-related costs — benefits such as payroll taxes, health insurance and retirement — from the home's own accounting records (CMS cost report, Worksheet A). Contract or agency labor is counted separately, under other operating costs. Rank #30 / 104Payroll — State benchmarkedThis home is ranked 30th out of 104 homes in North Carolina. Shows total annual staff payroll benchmarked to the North Carolina average. Higher payroll investment relative to peers often signals better staffing and less reliance on cheaper contract labor.Ranking totals vary by category as each rank only includes facilities that report data for that metric. Homes missing that data point aren't included in the ranking.Click the rank badge to see the full State ranking.Click here to see the full State ranking.
$8.2M 38.9% of net patient revenue Info Payroll as a share of revenue: staff salaries and wage-related benefits divided by net patient revenue. A higher figure means more of each revenue dollar goes to staff pay. Rank #51 / 104Payroll % — State benchmarkedThis home is ranked 51st out of 104 homes in North Carolina. Shows payroll as a percentage of revenue versus the North Carolina average. Well-run North Carolina facilities typically land around 49–62% — the top third Statewide. Below 25% may signal understaffing or heavy agency use — read with Staffing ratings.Ranking totals vary by category as each rank only includes facilities that report data for that metric. Homes missing that data point aren't included in the ranking.Click the rank badge to see the full State ranking.Click here to see the full State ranking.
Other operating costs Info Everything it costs to run the home apart from payroll — food, utilities, supplies, maintenance, contract labor and administration. Calculated as total operating expense minus payroll (staff salaries and wage-related benefits).
$13.6M
Total costs Info The home's total operating expense for the year — all the costs of running it, salaries included (CMS cost report, Worksheet G-3).
$21.8M

Who this home usually serves

TYPE OF STAY

Mostly short-term rehab stays

Most residents typically stay for a few weeks or months before returning home or moving on.

Most new residents arrive under Medicare (62% of admissions), and a typical Medicare stay runs around 26 days.

Admissions
165 total

Coverage residents most often arrive under.

Medicare 62%
Private pay 38%
Medicaid 1%
Discharges
161 total

Coverage residents most often leave under.

Medicare 46%
Private pay 50%
Medicaid 4%

Managed by Matt Sharpe

Executive Director

Matt Sharpe serves as the Executive Director at Givens Highland Farms, leading the community with a focus on professionalism, compassion, and expert care. Under his leadership, the staff demonstrates loyalty and stability, with many members recognized for long-term service. Matt is the driving force behind the team’s outstanding service and strong guidance.

Living Spaces & Floor Plans for Givens Highland Farms

Givens Highland Farms F 10
Givens Highland Farms F 9
Givens Highland Farms F 8
Givens Highland Farms F 7
Givens Highland Farms F 6
Givens Highland Farms F 5
Givens Highland Farms F 4
Givens Highland Farms F 3
Givens Highland Farms F 2
Givens Highland Farms F 1

Places of interest near Givens Highland Farms

Address 1.7 miles from city center Info Estimated distance in miles from Black Mountain's city center to Givens Highland Farms's address, calculated via Google Maps. — 7.76 miles to nearest hospital (Asheville VA Medical Center)

Calculate Travel Distance to Givens Highland Farms

Add your location

Address

Compare Nursing Home around North Carolina

The information below is reported by the North Carolina Department of Health and Human Services, Division of Health Service Regulation.

5 facilities compared · CMS & NC Dept. of Health data

Givens Highland Farms
NH
HC
IL
NC
RC
Black Mountain
60
Facility 60
NC AVG 72
Rank #233 / 390
82.2%
Facility 82.2%
NC AVG 76.4%
Rank #92 / 271
+8%
5.57
Facility 5.57
NC AVG 3.98
Rank #16 / 97
+11%+40%
$4.3k
Facility $4.3k
NC AVG $74.6k
Rank #49 / 105
14
Facility 14
NC AVG 20.9
Rank #50 / 101
4.7
Facility 4.7
NC AVG 5.0
Rank #58 / 101
-51-
12
Facility 12
NC AVG 33
Rank #440 / 572
Givens Estates, Inc.
$21.1M
Facility $21.1M
NC AVG $13.2M
Rank #31 / 104
$8.2M
Facility $8.2M
NC AVG $4.9M
Rank #30 / 104
38.9%
Facility 38.9%
NC AVG 39.8%
Rank #51 / 104
345078
Brookdale Carriage Club Providence
NH
AL
IL
MC
Charlotte (Olde Providence North)
77
Facility 77
NC AVG 72
Rank #168 / 390
71.5%
Facility 71.5%
NC AVG 76.4%
Rank #145 / 271
-6%
8.12
Facility 8.12
NC AVG 3.98
Rank #4 / 97
+78%+104%
$0
Facility $0
NC AVG $74.6k
Rank #1 / 105
11
Facility 11
NC AVG 20.9
Rank #39 / 101
3.7
Facility 3.7
NC AVG 5.0
Rank #43 / 101
-7A+
12
Facility 12
NC AVG 33
Rank #440 / 572
Bkd Fm Holding Company LLC
$19.6M
Facility $19.6M
NC AVG $13.2M
Rank #99 / 104
$8.1M
Facility $8.1M
NC AVG $4.9M
Rank #39 / 104
41.6%
Facility 41.6%
NC AVG 39.8%
Rank #1 / 104
345482
Wesley Pines
NH
AL
IL
MC
Lumberton
62
Facility 62
NC AVG 72
Rank #225 / 390
86.1%
Facility 86.1%
NC AVG 76.4%
Rank #74 / 271
+13%
4.60
Facility 4.60
NC AVG 3.98
Rank #28 / 97
-29%+16%
$0
Facility $0
NC AVG $74.6k
Rank #1 / 105
4
Facility 4
NC AVG 20.9
Rank #12 / 101
2.0
Facility 2.0
NC AVG 5.0
Rank #13 / 101
-58A+
9
Facility 9
NC AVG 33
Rank #462 / 572
The United Methodist Retirement Homes, Incorporated
$10.2M
Facility $10.2M
NC AVG $13.2M
Rank #79 / 104
$5.8M
Facility $5.8M
NC AVG $4.9M
Rank #64 / 104
56.7%
Facility 56.7%
NC AVG 39.8%
Rank #17 / 104
345180
Walnut Ridge
NH
AL
IL
MC
Walnut Cove (Windmill Street)
63
Facility 63
NC AVG 72
Rank #224 / 390
100.0%
Facility 100.0%
NC AVG 76.4%
Rank #1 / 271
+31%
3.12
Facility 3.12
NC AVG 3.98
Rank #94 / 97
-50%-22%
$40.1k
Facility $40.1k
NC AVG $74.6k
Rank #76 / 105
23
Facility 23
NC AVG 20.9
Rank #72 / 101
4.6
Facility 4.6
NC AVG 5.0
Rank #57 / 101
363A+
50
Facility 50
NC AVG 33
Rank #149 / 572
Nita Davis
$10.4M
Facility $10.4M
NC AVG $13.2M
Rank #68 / 104
$3.9M
Facility $3.9M
NC AVG $4.9M
Rank #97 / 104
37%
Facility 37%
NC AVG 39.8%
Rank #100 / 104
345089
The Cypress of Charlotte
NH
AL
HC
IL
MC
Charlotte (Beverly Woods)
65
Facility 65
NC AVG 72
Rank #210 / 390
78.2%
Facility 78.2%
NC AVG 76.4%
Rank #121 / 271
+2%- +26%-
$58.0k
Facility $58.0k
NC AVG $74.6k
Rank #83 / 105
14
Facility 14
NC AVG 20.9
Rank #50 / 101
4.7
Facility 4.7
NC AVG 5.0
Rank #58 / 101
258-
15
Facility 15
NC AVG 33
Rank #414 / 572
The Cypress Of Charlotte LLC
$7.3M
Facility $7.3M
NC AVG $13.2M
Rank #14 / 104
$14.1M
Facility $14.1M
NC AVG $4.9M
Rank #20 / 104
194.2%
Facility 194.2%
NC AVG 39.8%
Rank #79 / 104
345495

Financial Assistance for
Nursing Home in North Carolina

Givens Highland Farms is located in Black Mountain, North Carolina.
Here are the financial assistance programs available to residents in North Carolina.

Get Financial aid guidance

Community Alternatives Program for Disabled Adults

NC Medicaid CAP/DA

Age 65+ or disabled
General North Carolina resident, Medicaid- eligible, nursing home-level care need.
Income Limits (2025) ~$2,829/month 300% FBR, individual
Asset Limits $2,000 (individual), $3,000 (couple).
NC

High demand; waitlists common in urban areas.

Benefits
Personal care (5-7 hours/day) Respite (240 hours/year) Adult day care ($60/day) Home modifications ($1,500 avg.)

North Carolina Senior Care Options

NC SCO (via NFCSP)

Age Caregiver of someone 60+ (or with dementia)
General North Carolina resident.
Income Limits No strict limit; prioritizes low-income.
Asset Limits Not applicable.
NC

Limited slots; rural/urban balance.

Benefits
In-home respite (4-6 hours/day) Adult day care (~$60/day) Short-term facility care (up to 5 days)

Program of All-Inclusive Care for the Elderly (PACE)

North Carolina PACE (e.g., PACE of the Triad)

Age 55+
General NC resident (specific counties), NFLOC, safe with PACE support.
Income Limits (2025) ~$2,829/month (Medicaid-eligible); private pay option available.
Asset Limits $2,000 (individual), $3,000 (couple) for Medicaid enrollees.
NC

Available in 10+ counties (e.g., Guilford, Wake); multiple providers (e.g., PACE of the Southern Piedmont).

Benefits
Personal care (5-7 hours/day) Medical care Meals Transportation Respite Therapies

In-Home Aide Services

North Carolina In-Home Aide Services

Age 60+
General NC resident, unable to perform 1+ ADL, at risk of nursing home placement.
Income Limits (2025) No strict cap; prioritizes low-income ~$24,980/year
Asset Limits Not assessed; need-based.
NC

Family can be aides; varies by county funding.

Benefits
Personal care (5-20 hours/week) Meal prep Respite (~5 days/year) Errands

Medicare Savings Program (MSP)

North Carolina Medicare Savings Program

Age 65+ or disabled
General NC resident, Medicare Part A/B.
Income Limits (2025) ~$2,510/month (QMB), ~$3,380/month (SLMB), ~$3,598/month (QI)—individual.
Asset Limits $9,430 (individual), $14,130 (couple).
NC

Three tiers; no waitlist; includes Extra Help for Part D.

Benefits
Covers Part B premiums ($174.70/month) Deductibles ($240/year) Copays (~20%)

VA Aid and Attendance (A&A) and Housebound Benefits

North Carolina VA Aid and Attendance/Housebound

Age 65+ or disabled veteran/spouse
General NC resident, wartime service, need for ADL help (A&A) or homebound.
Income Limits (2025) Net income < ~$1,984/month (veteran with dependent, A&A); pension offsets income.
Asset Limits ~$155,356 net worth limit
NC

High veteran demand in rural/urban areas.

Benefits
Cash (~$1,433-$2,642/month veteran, ~$951-$1,318 spouse) for care costs (e.g., in-home, assisted living)

Urgent Repair Program (URP)

North Carolina Urgent Repair Program

Age 60+ prioritized
General NC resident, homeowner, low-income.
Income Limits (2025) ~$30,258/year 50% AMI, varies by county
Asset Limits Not strictly assessed; home value considered.
NC

Forgivable at $2,000/year; statewide via local partners.

Benefits
Repairs (~$8,000-$12,000 avg.) for safety (e.g., roofs, heating, accessibility)

State/County Special Assistance (SA)

North Carolina Special Assistance

Age 65+ (or disabled)
General NC resident, in licensed adult care home, low-income.
Income Limits (2025) ~$1,255/month (individual, 100% FPL); varies by facility rate.
Asset Limits $2,000 individual
NC

Covers assisted living; counties supplement state funds.

Benefits
Cash (~$1,200-$1,500/month) for room/board; Medicaid covers care services

Frequently Asked Questions about Givens Highland Farms

What neighborhood is Givens Highland Farms in?

Givens Highland Farms is in the Black Mountain neighborhood of Black Mountain.

Is Givens Highland Farms in a walkable area?

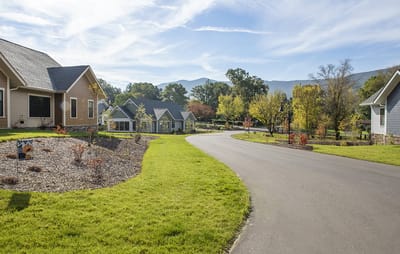
Givens Highland Farms has a walk score of 12. Car-dependent. Most errands require a car, with limited nearby walkable options.

What is the occupancy rate at Givens Highland Farms?

Givens Highland Farms's occupancy is 82.2%.

Are there photos of Givens Highland Farms?

Yes — there are 19 photos of Givens Highland Farms in the photo gallery on this page.

What is the phone number of Givens Highland Farms?

(828) 357-3611 will put you in contact with the team at Givens Highland Farms.

Is Givens Highland Farms Medicare or Medicaid certified?

Yes — Givens Highland Farms is a CMS-certified provider of Medicare and Medicaid.

Guides for Better Senior Living

Care Cost Calculator: See Prices in Your Area

Nursing Home Data Explorer

Don’t Wait Too Long: 7 Red Flag Signs Your Parent Needs Assisted Living Now

The True Cost of Assisted Living in 2025 – And How Families Are Paying For It

Understanding Senior Living Costs: Pricing Models, Discounts & Financial Assistance