Autumn Lake Healthcare at Baltimore Washington
CMS overall rating Info CMS (the Centers for Medicare & Medicaid Services) is the federal agency that rates nursing home quality. Its Overall Rating runs from 1 to 5 stars, combining health inspections, staffing, and quality measures, with inspections weighted most heavily.

Autumn Lake Healthcare at Baltimore Washington

CMS overall rating Info CMS (the Centers for Medicare & Medicaid Services) is the federal agency that rates nursing home quality. Its Overall Rating runs from 1 to 5 stars, combining health inspections, staffing, and quality measures, with inspections weighted most heavily.
Calculator: See prices in your area
Autumn Lake Healthcare at Baltimore Washington accepts Medicare, Medicaid, and private pay.

Overview of Autumn Lake Healthcare at Baltimore Washington

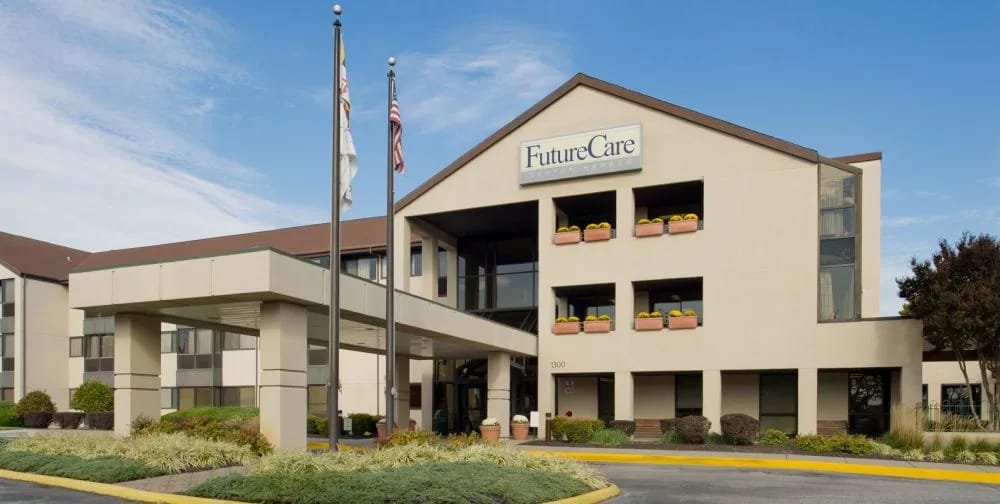
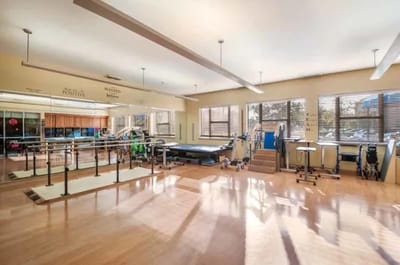
Located in Baltimore, Washington, Autumn Lake Healthcare at Baltimore Washington is a modern nursing center. This assisted living community is renowned for both sub-acute rehabilitation and long-term care, offering around-the-clock nursing services for various complex medical conditions. With its bright and inviting atmosphere, it provides a comforting space for residents to relax and receive care from a dedicated staff. Autumn Lake offers advanced care programs for complex medical conditions, with a dedicated staff ready to assist senior residents every step of the way.

Autumn Lake Healthcare at Baltimore Washington is an independently owned and operated healthcare center that is licensed to use the Autumn Lake Healthcare name and receive non-healthcare related services. All healthcare-related services are provided solely by Autumn Lake Healthcare at Baltimore Washington.

(410) 761-1222

Quality ratings

Measured by Centers for Medicare & Medicaid Services (CMS)

Overall rating Info The Overall CMS Rating combines results from health inspections, staffing levels and quality measures. Health inspections carry the most weight. Staffing and quality scores can increase or decrease the final rating based on performance compared to state and national standards.
▼ 34.2% Below MD avg. ▼ 34.2% Below MD avg.MD average: 3.0Click the badge to see the full State ranking.Click here to see the full State ranking.
Health Inspection Info Based on the results of the facility's three most recent standard inspections and any complaint investigations. CMS reviews the number, scope, and severity of deficiencies, with more recent findings weighted more heavily.
▼ 29.0% Below MD avg. ▼ 29.0% Below MD avg.MD average: 2.8Click the badge to see the full State ranking.Click here to see the full State ranking.
Staffing Info Measures average nursing staff hours per resident per day, including Registered Nurses (RNs) and total nursing staff. Ratings are adjusted based on the level of care residents require and are compared to state and national benchmarks.
At MD avg. At MD avg.MD average: 3.0Click the badge to see the full State ranking.Click here to see the full State ranking.
Quality Measures Info Based on clinical and physical health indicators reported to CMS, such as hospital readmissions, falls, pressure ulcers, and improvements in mobility. These measures reflect how well residents' health needs are being managed.
▼ 18.8% Below MD avg. ▼ 18.8% Below MD avg.MD average: 3.7Click the badge to see the full State ranking.Click here to see the full State ranking.

Staffing hours breakdown

Info Daily nursing hours per resident by staff type, reported to CMS. Higher is generally better — compare this facility to state and national averages to see where staffing stands.

Hours per resident per day — compared to Maryland state averages

Total nursing care / resident Info Total adjusted nursing hours per resident per day, combining RN, LPN, and aide time. CMS adjusts this for case-mix so facilities can be fairly compared.
2h 56m per day
This facility Maryland avg (3h 46m per day)
vs Maryland avg
-22%

5 of 6 metrics below state avg

Standout metric Weekend RN is +21% above state avg
Staff typeHours / Day / Residentvs state avg
Registered Nurse (RN) Info RNs hold the highest nursing license and can assess residents, interpret test results, and direct care plans. More RN hours per day often signals stronger clinical oversight and faster response to health changes. 47m per day ▼ 5% State avg: 50m per day · National avg: 41m per day
LPN / LVN Info Licensed Practical Nurses (LPNs) or Licensed Vocational Nurses (LVNs) deliver routine hands-on care — medication administration, wound dressing, and monitoring vital signs. They work under RN supervision and make up a large share of daily bedside care. 41m per day ▼ 24% State avg: 54m per day · National avg: 52m per day
Nurse Aide Info Certified Nurse Aides (CNAs) provide the most direct day-to-day assistance: bathing, dressing, feeding, and mobility. Nurse aide hours are typically the largest staffing category and directly affect residents' quality of life. 1h 55m per day ▼ 11% State avg: 2h 10m per day · National avg: 2h 21m per day
Weekend Total Nursing Info Combined nursing hours (RN + LPN + Nurse Aide) per resident per day on weekends. Staffing often drops on weekends — this figure reveals whether the facility maintains adequate coverage outside of weekday hours. 3h 10m per day ▼ 9% State avg: 3h 29m per day · National avg: 3h 26m per day
Physical Therapist Info Hours per resident per day provided by licensed Physical Therapists (PTs) or PT Assistants. PT services help residents recover mobility after injury or illness and are especially important for post-acute (short-stay) rehabilitation. 3m per day ▼ 34% State avg: 5m per day · National avg: 4m per day
Weekend RN Info Registered nurse hours specifically on weekends. Facilities sometimes reduce RN presence on Saturdays and Sundays — a low weekend RN figure compared to weekday hours can indicate reduced clinical oversight when most administrative staff are absent. 45m per day ▲ 21% State avg: 37m per day · National avg: 29m per day

Capacity and availability

This home usually has availability

Similar occupancy to the Maryland average: 82.4%
Occupancy rate
81.8%
Avg. Length of Stay
58 days
Bed community size
129-bed community Rank #71 / 697Bed count — State benchmarkedThis home is ranked 71st out of 697 homes in Maryland. Shows this facility's certified or reported bed count compared to other Maryland facilities. Larger communities may offer more amenities, programs, and on-site services for residents and families.Rankings are based only on facilities in Maryland that report data for that category. Facilities without available data are excluded from the ranking.Click the rank badge to see the full State ranking.Click here to see the full State ranking.
A larger shared setting that may offer more common spaces and organized community services.
Walk Score
Walk Score: 59 / 100 Rank #327 / 985Walk Score — State benchmarkedThis home is ranked 327th out of 985 homes in Maryland. Shows how walkable this facility's neighborhood is compared to the average Walk Score across Maryland facilities. Higher scores benefit residents, families, and staff.Rankings are based only on facilities in Maryland that report data for that category. Facilities without available data are excluded from the ranking.Click the rank badge to see the full State ranking.Click here to see the full State ranking.
Moderately walkable. Some errands can be accomplished on foot, with a mix of nearby amenities.

Payment & Insurance

2 services
Accept Medicaid
Accept Medicare

Therapy & Rehabilitation

2 services
Rehabilitation Services
Short-Term Rehab

Additional Services

1 service
Long-Term Living

Amenities & Lifestyle

Specific ProgramsGood Times, Preparing your stay, Info For Families

Dining & Nutrition

Food DescriptionDining services are provided.

Contact Autumn Lake Healthcare at Baltimore Washington

Staffing Data

Reporting period: October 1 – December 31, 2025 (Q4 2025). Source: CMS Payroll-Based Journal report.

Total staff 249
Employees 87
Contractors 162
Staff to resident ratio 2.33 : 1
28% more staff per resident than Maryland average
Maryland average ratio: 1.81 : 1 Maryland average ratio: 1.81 : 1See full Maryland ranking
Avg staff/day 47
Average shift 8.4 hours
5% better than Maryland average
Maryland average: 8 hours Maryland average shift: 8 hoursSee full Maryland ranking
Total staff hours (quarter) 36,200

Nursing staff breakdown

Q4 2025 · Oct 1 – Dec 31 More info This data comes from the CMS Payroll-Based Journal report covering October 1 – December 31, 2025.
Registered Nurse

Manages medical care and health needs.

RN Staff Info 52 total: 15 full-time employees and 37 contractors. 52
Average shift length Info Average shift length. Calculated as total hours divided by days worked and average staff per day. 8.2 hours
Licensed Practical Nurse

Assists with medical care and medications.

LPN Staff Info 31 total: 15 full-time employees and 16 contractors. 31
Average shift length Info Average shift length. Calculated as total hours divided by days worked and average staff per day. 8.3 hours
Certified Nursing Assistant

Helps with daily care and mobility.

CNA Staff Info 127 total: 38 full-time employees and 89 contractors. 127
Average shift length Info Average shift length. Calculated as total hours divided by days worked and average staff per day. 8.5 hours

Contractor staffing

Q4 2025 · Oct 1 – Dec 31 More info This data comes from the CMS Payroll-Based Journal report covering October 1 – December 31, 2025.

Total hours from contractors

23.5%

8,512 contractor hours this quarter

Certified Nursing Assistant: 89 Registered Nurse: 37 Licensed Practical Nurse: 16 Qualified Social Worker: 8 Speech Language Pathologist: 4 Physical Therapy Aide: 3 Physical Therapy Assistant: 3 Respiratory Therapy Technician: 2

Staff by category

Q4 2025 · Oct 1 – Dec 31 More info This data comes from the CMS Payroll-Based Journal report covering October 1 – December 31, 2025.
Certified Nursing Assistant388912714,81192100%8.5
Registered Nurse1537524,59292100%8.2
Licensed Practical Nurse1516314,12492100%8.3
Clinical Nurse Specialist4041,9808087%7.8
RN Director of Nursing4041,9168592%9.4
Speech Language Pathologist0441,4176773%7.7
Nurse Aide in Training2021,2498592%9.7
Physical Therapy Aide0331,0477379%7.7
Medication Aide/Technician2029718693%9.6
Other Dietary Services Staff2028599199%7.3
Dental Services Staff2027746065%7.7
Respiratory Therapy Technician0224906368%7.8
Administrator1014886470%7.6
Physical Therapy Assistant0334846773%6.9
Dietitian1014525762%7.9
Nurse Practitioner1014475661%8
Qualified Social Worker0881013134%3.2
127 Certified Nursing Assistant
% of Days 100%
52 Registered Nurse
% of Days 100%
31 Licensed Practical Nurse
% of Days 100%
4 Clinical Nurse Specialist
% of Days 87%
4 RN Director of Nursing
% of Days 92%
4 Speech Language Pathologist
% of Days 73%
2 Nurse Aide in Training
% of Days 92%
3 Physical Therapy Aide
% of Days 79%
2 Medication Aide/Technician
% of Days 93%
2 Other Dietary Services Staff
% of Days 99%
2 Dental Services Staff
% of Days 65%
2 Respiratory Therapy Technician
% of Days 68%
1 Administrator
% of Days 70%
3 Physical Therapy Assistant
% of Days 73%
1 Dietitian
% of Days 62%
1 Nurse Practitioner
% of Days 61%
8 Qualified Social Worker
% of Days 34%

Penalties and fines

Federal penalties imposed by CMS for regulatory violations, including civil money penalties (fines) and denials of payment for new Medicare/Medicaid admissions.

Source: CMS Penalties Database

No penalties in the past 3 years

No civil money penalties or payment denials were reported in the last 3 years.

Quality of care over time

These measures show how residents usually do over time at this home, based on health outcomes and preventive care.

High-risk clinical events score Info A composite score based on pressure ulcers, falls with injury, weight loss, walking ability decline, and activities of daily living decline. 19.4
50% worse than Maryland average

Maryland average: 12.9

Functional decline score Info A composite score based on activities of daily living decline, walking ability decline, and incontinence. 35.4
38% worse than Maryland average

Maryland average: 25.7

Long-stay resident measures
Average Maryland avg: 3.7 Info CMS star rating based on long-stay quality measure performance. 5 stars = significantly above average, 1 star = significantly below average.
Need for Help with Daily Activities Increased Info Percent of long-stay residents whose need for help with daily activities has increased 32.0%
35% worse than Maryland average

Maryland average: 23.7%

Walking Ability Worsened Info Percent of long-stay residents whose ability to move independently worsened 46.2%
67% worse than Maryland average

Maryland average: 27.7%

Low Risk Residents with Bowel/Bladder Incontinence Info Percent of low risk long-stay residents who lose control of their bowels or bladder 27.9%
8% worse than Maryland average

Maryland average: 25.9%

Falls with Major Injury Info Percent of long-stay residents experiencing one or more falls with major injury 1.6%
29% better than Maryland average

Maryland average: 2.3%

High Risk Residents with Pressure Ulcers Info Percent of long-stay high risk residents with pressure ulcers 10.4%
60% worse than Maryland average

Maryland average: 6.5%

Urinary Tract Infection Info Percent of long-stay residents with a urinary tract infection 0.0%
100% better than Maryland average

Maryland average: 1.6%

Lost Too Much Weight Info Percent of long-stay residents who lose too much weight 6.6%
13% worse than Maryland average

Maryland average: 5.8%

Depressive Symptoms Info Percent of long-stay residents who have depressive symptoms 43.3%
114% worse than Maryland average

Maryland average: 20.2%

Antipsychotic Use Info Percent of long-stay residents who received an antipsychotic medication 4.8%
63% better than Maryland average

Maryland average: 12.9%

Pneumococcal Vaccine Info Percent of long-stay residents assessed and appropriately given the pneumococcal vaccine 94.2%
In line with Maryland average

Maryland average: 92.0%

Influenza Vaccine Info Percent of long-stay residents assessed and appropriately given the seasonal influenza vaccine 90.5%
6% worse than Maryland average

Maryland average: 96.6%

Hospitalizations per 1,000 days Info Number of hospitalizations per 1,000 long-stay resident days. 1.78
35% worse than Maryland average

Maryland average: 1.32

ED visits per 1,000 days Info Number of outpatient emergency department visits per 1,000 long-stay resident days. 0.93
23% better than Maryland average

Maryland average: 1.21

Short-stay resident measures
Average Maryland avg: 3.7 Info CMS star rating based on short-stay quality measure performance. 5 stars = much above average, 1 star = much below average.
Pneumococcal Vaccine Info Percent of short-stay residents assessed and appropriately given the pneumococcal vaccine 58.5%
25% worse than Maryland average

Maryland average: 78.4%

Antipsychotic medication increase Info Percent of short-stay residents who newly received an antipsychotic medication 1.1%
19% better than Maryland average

Maryland average: 1.4%

Influenza Vaccine Info Percent of short-stay residents assessed and appropriately given the seasonal influenza vaccine 60.9%
25% worse than Maryland average

Maryland average: 80.6%

Re-hospitalized after SNF stay Info Percentage of short-stay residents who were re-hospitalized after their nursing home admission. 28.0%
32% worse than Maryland average

Maryland average: 21.2%

Emergency department visits Info Percentage of short-stay residents who had an outpatient emergency department visit. 8.3%
16% better than Maryland average

Maryland average: 9.9%

Falls with major injury Info Percentage of SNF residents who experience falls with major injury during their stay. 0.0%
100% better than Maryland average

Maryland average: 0.8%

Ability to care for self at discharge Info Percentage of residents at or above expected ability to care for themselves at discharge. 33.1%
38% worse than Maryland average

Maryland average: 53.7%

Successful return to home or community Info Rate of successful return to home or community from a skilled nursing facility. 58.1%
15% better than Maryland average

Maryland average: 50.6%

Breakdown by payment type

Medicare

43% of new residents, usually for short-term rehab.

Typical stay 26 days

Private pay

42% of new residents, often for short stays.

Typical stay 17 days

Medicaid

16% of new residents, often for long-term daily care.

Typical stay 8 - 9 months

Facility Characteristics

Source: CMS Long-Term Care Facility Characteristics (Data as of Jan 2026)

Total residents 107
Medicare
27
25.2% of residents
Medicaid
78
72.9% of residents
Private pay or other
2
1.9% of residents
Programs & Services
Residents Group

Residents meet regularly to discuss policies, care quality, and activities

Active Resident Council

Organized group of residents that meets regularly to discuss facility policies, quality of life, and activities.

Finances and operations

Based on CMS SNF Cost Report for fiscal year ending in 12/2023.

Voluntary non-profit community
Operated by a church.
Net patient revenue Info Net patient revenue — what the home actually collects for resident care, after contractual allowances, bad debt and discounts are subtracted from its gross charges (CMS cost report, Worksheet G-3). It covers resident care only; money the home earns from other sources is shown separately as "Other income."
$15.0M
Net patient income Info Net patient income: net patient revenue minus the home's total operating expenses. A positive figure means it earns more from resident care than it spends to deliver it; a negative figure means the opposite. It excludes non-operating "other income."
$168.2K
Voluntary non-profit community Operated by a church.
Net patient revenue Info Net patient revenue — what the home actually collects for resident care, after contractual allowances, bad debt and discounts are subtracted from its gross charges (CMS cost report, Worksheet G-3). It covers resident care only; money the home earns from other sources is shown separately as "Other income."
$15.0M
Net patient income Info Net patient income: net patient revenue minus the home's total operating expenses. A positive figure means it earns more from resident care than it spends to deliver it; a negative figure means the opposite. It excludes non-operating "other income."
$168.2K
Other income Info Money the home earns outside of resident care — such as investments, grants, rentals and other non-operating sources (CMS cost report, Worksheet G-3). It is tracked separately from net patient revenue: it is not part of that figure, and it is not included in net patient income.
$109.1K
Payroll costs Info Staff salaries plus wage-related costs — benefits such as payroll taxes, health insurance and retirement — from the home's own accounting records (CMS cost report, Worksheet A). Contract or agency labor is counted separately, under other operating costs.
$1.3M 8.8% of net patient revenue Info Payroll as a share of revenue: staff salaries and wage-related benefits divided by net patient revenue. A higher figure means more of each revenue dollar goes to staff pay.
Other operating costs Info Everything it costs to run the home apart from payroll — food, utilities, supplies, maintenance, contract labor and administration. Calculated as total operating expense minus payroll (staff salaries and wage-related benefits).
$13.5M
Total costs Info The home's total operating expense for the year — all the costs of running it, salaries included (CMS cost report, Worksheet G-3).
$14.9M

Who this home usually serves

TYPE OF STAY

Mostly short-term rehab stays

Most residents typically stay for a few weeks or months before returning home or moving on.

New residents most often arrive under Medicare (43% of admissions), and a typical Medicare stay runs around 26 days.

Admissions
607 total

Coverage residents most often arrive under.

Medicare 43%
Private pay 42%
Medicaid 16%
Discharges
599 total

Coverage residents most often leave under.

Medicare 36%
Private pay 40%
Medicaid 24%

Places of interest near Autumn Lake Healthcare at Baltimore Washington

Address 1.8 miles from city center Info Estimated distance in miles from Glen Burnie's city center to Autumn Lake Healthcare at Baltimore Washington's address, calculated via Google Maps. — 9.5 miles to nearest hospital (Ascension Saint Agnes Hospital)

Calculate Travel Distance to Autumn Lake Healthcare at Baltimore Washington

Add your location

Address

Compare Nursing Homes around Annapolis

The information below is reported by the Maryland Department of Health, Office of Health Care Quality.

5 facilities compared · CMS & MD Dept. of Health data

Complete Care at Annapolis
NH
HC
PC
RC
Annapolis
97
Facility 97
MD AVG 43
Rank #139 / 697
79.4% -4%3.26 -3%-14%$03210.7-75-
62
Facility 62
MD AVG 43
Rank #286 / 985
Pc Md5 Opco Holdco LLC$12.0M$4.8M39.7%215005
Ginger Cove
NH
AL
HC
IL
MC
Annapolis (River Crescent Drive)
96
Facility 96
MD AVG 43
Rank #140 / 697
66.1% -20%5.57 +25%+47%$0196.3-35A+
51
Facility 51
MD AVG 43
Rank #413 / 985
Phyllis Boulden$5.0M$13.3M265.4%215174
Autumn Lake Healthcare at Crofton
NH
RC
Crofton (Charing Cross)
180
Facility 180
MD AVG 43
Rank #19 / 697
88.0% +7%3.37 +35%-11%$0
27
Facility 27
MD AVG 49.9
Rank #28 / 149
6.8-160-
41
Facility 41
MD AVG 43
Rank #508 / 985
A&R Stern Family Cc Holdings LLC$27.2M$3.0M11.1%215120
Autumn Lake Healthcare at Spa Creek
NH
RC
Annapolis (Milkshake Lane)
130
Facility 130
MD AVG 43
Rank #66 / 697
88.3% +7%3.32 -41%-12%$0
65
Facility 65
MD AVG 49.9
Rank #118 / 149
13.01114-
48
Facility 48
MD AVG 43
Rank #448 / 985
35 Milkshake Holdco LLC$20.1M$1.5M7.2%215258
Autumn Lake Healthcare at Baltimore Washington
NH
Glen Burnie (South Gate)
129
Facility 129
MD AVG 43
Rank #71 / 697
81.8% -1%2.94 +52%-22%$0
72
Facility 72
MD AVG 49.9
Rank #124 / 149
14.4-96-
59
Facility 59
MD AVG 43
Rank #327 / 985
313 Hospital Drive Opco LLC$15.0M$1.3M8.8%215316

Financial Assistance for
Nursing Home in Maryland

Autumn Lake Healthcare at Baltimore Washington is located in Glen Burnie, Maryland.
Here are the financial assistance programs available to residents in Maryland.

Get Financial aid guidance

Community Options Waiver

Maryland Medicaid Community Options Waiver

Age 65+ or disabled
General Maryland resident, Medicaid- eligible, nursing home-level care need.
Income Limits (2025) ~$2,829/month 300% FBR, individual
Asset Limits $2,000 (individual), $3,000 (couple) (excludes home, car).
MD

High urban demand; rural outreach efforts.

Benefits
Personal care (5-7 hours/day, e.g., bathing, dressing) Respite care (up to 240 hours/year) Adult day care ($70/day) Home modifications ($1,500 avg.)

Senior Care Program

Maryland Senior Care

Age 65+
General Maryland resident, at risk of nursing home placement.
Income Limits ~$2,000/month individual, varies by county
Asset Limits $11,000 individual
MD

Limited funding; waitlists common in high-demand areas.

Benefits
In-home care (3-5 hours/week) Respite care (up to 10 days/year) Meals (~$6/meal) Transportation (~5 trips/month) Case management

Maryland Nursing Home Medicaid

Maryland Medical Assistance (Medicaid) Nursing Home Program

Age 65+
General Maryland resident, Medicaid-eligible, requires nursing home-level care.
Income Limits (2025) $943/month (individual); most income applied to care costs.
Asset Limits $2,500 (individual), $3,000 (couple); spousal protections up to $155,356.
MD

Home equity limit $636,000; estate recovery applies post-55.

Benefits
24/7 nursing care Meals Therapy Medications (unlimited per medical need)

Senior Assisted Living Subsidy Program

Maryland Senior Assisted Living Group Home Subsidy

Age 62+
General Maryland resident, in or moving to approved assisted living, low/moderate income.
Income Limits (2025) ~$34,000/year individual, varies by county
Asset Limits Not strict; prioritizes low-income.
MD

Not available statewide; facility must be licensed by MDH.

Benefits
Personal care Meals 24-hour supervision (up to $1,500/month subsidy typical)

Veterans Aid and Attendance (A&A) Benefit

Maryland VA Aid and Attendance

Age
General Wartime veteran/spouse, age 65+ or disabled, needs ADL help, Maryland resident.
Income Limits (2025) Net income minus medical expenses < $1,984/month individual with A&A
Asset Limits $155,356 net worth limit
MD

High veteran population in suburban/rural areas.

Benefits
Cash benefit ($1,478-$2,471/month, varies by status) for care costs

Senior Prescription Drug Assistance Program (SPDAP)

Maryland Senior Prescription Drug Assistance Program

Age 65+
General Maryland resident (6+ months), Medicare Part D enrolled.
Income Limits (2025) $48,560/year individual, 300% FPL
Asset Limits None specified.
MD

Supplements Medicare Part D; annual enrollment required.

Benefits
Up to $40/month premium subsidy Reducing drug costs

Medicare Savings Programs (MSP)

Maryland Medicare Savings Programs

Age 65+
General Maryland resident, Medicare Part A/B enrollee.
Income Limits (2025) $2,014/month (QMB), $2,706/month (SLMB/QI, individual).
Asset Limits $9,090 (individual), $13,630 (couple).
MD

Includes QMB, SLMB, QI categories.

Benefits
Covers premiums (up to $174.70/month Part B) Co-pays Deductibles

Community Personal Assistance Services (CPAS)

Maryland Medicaid Community Personal Assistance Services

Age 65+
General Maryland resident, Medicaid-eligible, needs ADL assistance.
Income Limits (2025) $943/month (individual); spend-down available.
Asset Limits $2,500 (individual), $3,000 (couple).
MD

Consumer-directed option allows hiring family caregivers.

Benefits
Personal care (hours vary, typically 20-30/week) Chores Nurse supervision

Frequently Asked Questions about Autumn Lake Healthcare at Baltimore Washington

What neighborhood is Autumn Lake Healthcare at Baltimore Washington in?

Autumn Lake Healthcare at Baltimore Washington is in the South Gate neighborhood of Glen Burnie.

Is Autumn Lake Healthcare at Baltimore Washington in a walkable area?

Autumn Lake Healthcare at Baltimore Washington has a walk score of 59. Moderately walkable. Some errands can be accomplished on foot, with a mix of nearby amenities.

What is the occupancy rate at Autumn Lake Healthcare at Baltimore Washington?

Autumn Lake Healthcare at Baltimore Washington's occupancy is 81.8%.

Are there photos of Autumn Lake Healthcare at Baltimore Washington?

Yes — there are 2 photos of Autumn Lake Healthcare at Baltimore Washington in the photo gallery on this page.

What is the address of Autumn Lake Healthcare at Baltimore Washington?

Autumn Lake Healthcare at Baltimore Washington is located at 313 Hospital Drive, Glen Burnie, MD 21061.

What is the phone number of Autumn Lake Healthcare at Baltimore Washington?

(410) 761-1222 will put you in contact with the team at Autumn Lake Healthcare at Baltimore Washington.

Is Autumn Lake Healthcare at Baltimore Washington Medicare or Medicaid certified?

Yes — Autumn Lake Healthcare at Baltimore Washington is a CMS-certified provider of Medicare and Medicaid.

Guides for Better Senior Living

Care Cost Calculator: See Prices in Your Area

Nursing Home Data Explorer

Don’t Wait Too Long: 7 Red Flag Signs Your Parent Needs Assisted Living Now

The True Cost of Assisted Living in 2025 – And How Families Are Paying For It

Understanding Senior Living Costs: Pricing Models, Discounts & Financial Assistance