


Hospitalizations per 1,000 days
 Number of hospitalizations per 1,000 long-stay resident days.
2.06
Number of hospitalizations per 1,000 long-stay resident days.
2.06
Illinois average: 2.05
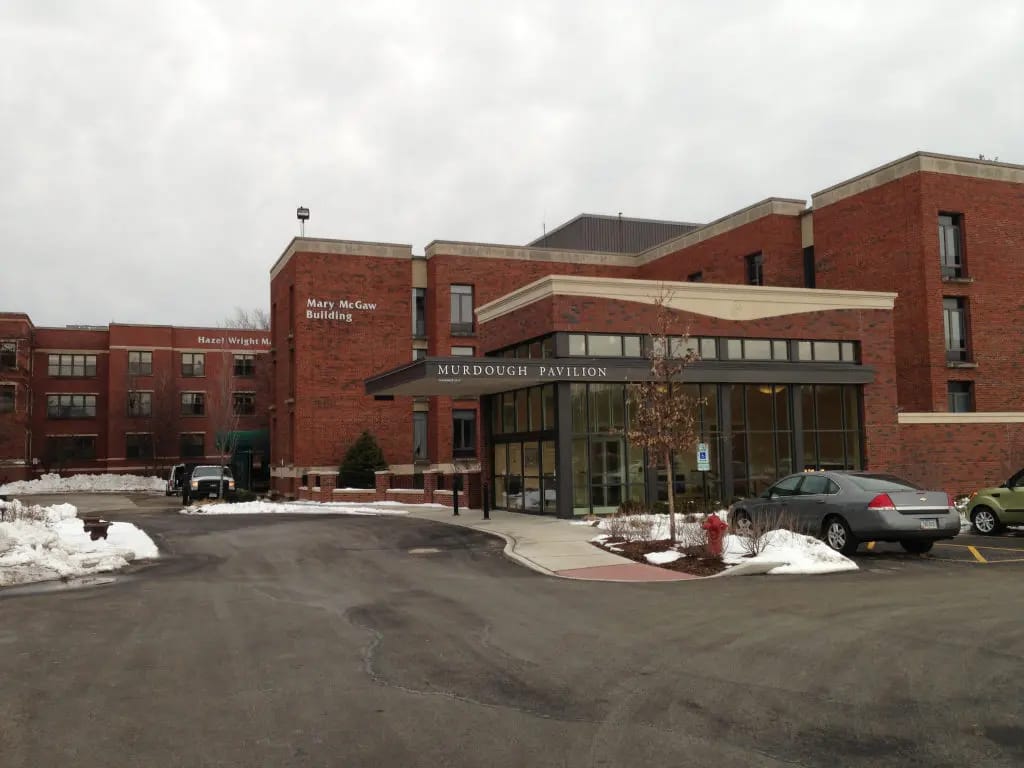


Located in the Grant Street neighborhood of Evanston, Illinois, McGaw Care Center & Frank Foster Pavilion offers skilled nursing, respite care, and long-term nursing care. It is a member of Presbyterian Homes. The community is also a short drive from Resurrection Medical Center’s Emergency Fast Track. This may matter to families who want nearby emergency care.
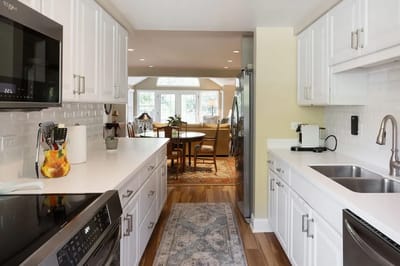
McGaw Care Center & Frank Foster Pavilion also focuses on memory care. Its special program supports residents living with Alzheimer’s or dementia. Daily support includes help with personal care, medication management, and 24-hour care. Residents also receive chef-prepared meals and planned activities.
Staffing is listed by role. Registered nurses average 2 hours and 14 minutes per resident each day. Nurse aides average 3 hours and 21 minutes. Licensed practical or vocational nurses average 16 minutes per resident each day. Weekend nursing coverage totals about 5 hours and 22 minutes per resident.
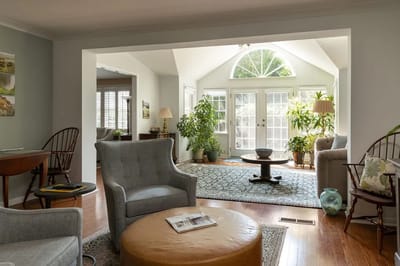
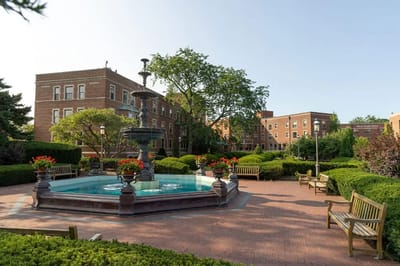
Residents live in private rooms inside a mid-rise building. The area has a Walk Score of 64, so it is moderately walkable. Some nearby places can be reached on foot, and the home also offers transportation, fitness programs, and recreation activities.
| Staff type | Hours / Day / Resident | vs state avg |
|---|---|---|
|
Registered Nurse (RN)
| 2h 14m per day | ▲ 205% State avg: 44m per day · National avg: 41m per day |
|
LPN / LVN
| 16m per day | ▼ 58% State avg: 38m per day · National avg: 52m per day |
|
Nurse Aide
| 3h 21m per day | ▲ 57% State avg: 2h 8m per day · National avg: 2h 21m per day |
|
Weekend Total Nursing
| 5h 22m per day | ▲ 74% State avg: 3h 5m per day · National avg: 3h 26m per day |
|
Physical Therapist
| 11m per day | ▲ 267% State avg: 3m per day · National avg: 4m per day |
|
Weekend RN
| 1h 43m per day | ▲ 203% State avg: 34m per day · National avg: 29m per day |
These measures show how residents usually do over time at this home, based on health outcomes and preventive care.
Illinois average: 2.05
Illinois average: 2.25
Illinois average: 26.2%
Illinois average: 14.0%
Illinois average: 0.8%
Illinois average: 53.7%
Illinois average: 50.6%
Quality measures are calculated from Minimum Data Set (MDS) assessments. For most measures, lower percentages indicate better care quality.
No pets allowed
Housing Options: Private Rooms
Building Type: Mid-rise
Transportation Services
Fitness and Recreation
![]() 2.7 miles from city center
2.7 miles from city center
![]() Estimated distance in miles from Evanston's city center to McGaw Care Center & Frank Foster Pavilion's address, calculated via Google Maps.
— 6.68 miles to nearest hospital (Resurrection Medical Center - Emergency Fast Track)
Estimated distance in miles from Evanston's city center to McGaw Care Center & Frank Foster Pavilion's address, calculated via Google Maps.
— 6.68 miles to nearest hospital (Resurrection Medical Center - Emergency Fast Track)
Add your location
Info below is compiled from CMS reports & the IL Dept. of Public Health (IDPH), senior community websites & trusted data sources such as Walk Score & BBB.
Communities are listed from highest to lowest based on our ranking methodology.
| The Mather | NH AL IL MC SNF | Evanston (Davis Street) | 22
Facility
22
IL AVG
85
Rank
#394 / 419 | - | - | 5.88
Facility
5.88
IL AVG
3.10
Rank
#5 / 155 | +102% | +90% | $0
Facility
$0
IL AVG
$151.3k
Rank
#1 / 155 | 7
Facility
7
IL AVG
36.8
Rank
#5 / 155 | 3.5
Facility
3.5
IL AVG
3.7
Rank
#72 / 155 | - | 30 | - |
95
Facility
95
IL AVG
51
Rank
#18 / 648 | Mather Senior Living Communities LLC | $24.7MFiscal year ending 12/2023
Facility
$24.7MFiscal year ending 12/2023
IL AVG
$12.2M
Rank
#38 / 154 | $10.8MFiscal year ending 12/2023
Facility
$10.8MFiscal year ending 12/2023
IL AVG
$4.8M
Rank
#28 / 154 | 43.6%Fiscal year ending 12/2023
Facility
43.6%Fiscal year ending 12/2023
IL AVG
44.3%
Rank
#79 / 154 | 146145 | ||||
| Westminster Place | NH AL IL MC RC SNF | Evanston (Grant Street) | 105
Facility
105
IL AVG
85
Rank
#112 / 419 |
57.0%
Facility
57.0%
IL AVG
73
Rank
#134 / 157 | -22% | 5.50
Facility
5.50
IL AVG
3.10
Rank
#9 / 155 | +47% | +77% | $0
Facility
$0
IL AVG
$151.3k
Rank
#1 / 155 | 7
Facility
7
IL AVG
36.8
Rank
#5 / 155 | 2.3
Facility
2.3
IL AVG
3.7
Rank
#14 / 155 | - | 60 | - |
44
Facility
44
IL AVG
51
Rank
#392 / 648 | Presbyterian Homes | $26.3MFiscal year ending 03/2024
Facility
$26.3MFiscal year ending 03/2024
IL AVG
$12.2M
Rank
#2 / 154 | $15.3MFiscal year ending 03/2024
Facility
$15.3MFiscal year ending 03/2024
IL AVG
$4.8M
Rank
#8 / 154 | 58.2%Fiscal year ending 03/2024
Facility
58.2%Fiscal year ending 03/2024
IL AVG
44.3%
Rank
#150 / 154 | 145026 | ||||
| Alden Estates of Evanston Rehabilitation and Post Acute Health Care | NH SNF | Evanston | 99
Facility
99
IL AVG
85
Rank
#121 / 419 |
64.8%
Facility
64.8%
IL AVG
73
Rank
#116 / 157 | -11% | 2.99
Facility
2.99
IL AVG
3.10
Rank
#71 / 155 | +11% | -4% | $0
Facility
$0
IL AVG
$151.3k
Rank
#1 / 155 | 9
Facility
9
IL AVG
36.8
Rank
#11 / 155 | 3.0
Facility
3.0
IL AVG
3.7
Rank
#40 / 155 | - | 64 | - |
70
Facility
70
IL AVG
51
Rank
#153 / 648 | Joshua Molitor | $11.6MFiscal year ending 12/2023
Facility
$11.6MFiscal year ending 12/2023
IL AVG
$12.2M
Rank
#107 / 154 | $5.6MFiscal year ending 12/2023
Facility
$5.6MFiscal year ending 12/2023
IL AVG
$4.8M
Rank
#115 / 154 | 48.3%Fiscal year ending 12/2023
Facility
48.3%Fiscal year ending 12/2023
IL AVG
44.3%
Rank
#77 / 154 | 145907 | ||||
| Dobson Plaza Rehabilitation and Healthcare | NH PC RC SNF | Evanston (Dodge Avenue) | 97
Facility
97
IL AVG
85
Rank
#128 / 419 |
86.5%
Facility
86.5%
IL AVG
73
Rank
#44 / 157 | +18% | 2.39
Facility
2.39
IL AVG
3.10
Rank
#128 / 155 | +45% | -23% | $0
Facility
$0
IL AVG
$151.3k
Rank
#1 / 155 | 16
Facility
16
IL AVG
36.8
Rank
#24 / 155 | 5.3
Facility
5.3
IL AVG
3.7
Rank
#138 / 155 | 1 | 84 | A+ |
74
Facility
74
IL AVG
51
Rank
#135 / 648 | Charlotte Kohn | $8.3M*Fiscal year ending 12/2021These figures are from this home's most recent complete cost report — an older period than most facilities report. Compare with that in mind.
Facility
$8.3M*Fiscal year ending 12/2021These figures are from this home's most recent complete cost report — an older period than most facilities report. Compare with that in mind.
IL AVG
$12.2M
Rank
#154 / 154 | $3.7M*Fiscal year ending 12/2021These figures are from this home's most recent complete cost report — an older period than most facilities report. Compare with that in mind.
Facility
$3.7M*Fiscal year ending 12/2021These figures are from this home's most recent complete cost report — an older period than most facilities report. Compare with that in mind.
IL AVG
$4.8M
Rank
#135 / 154 | 45.1%*Fiscal year ending 12/2021These figures are from this home's most recent complete cost report — an older period than most facilities report. Compare with that in mind.
Facility
45.1%*Fiscal year ending 12/2021These figures are from this home's most recent complete cost report — an older period than most facilities report. Compare with that in mind.
IL AVG
44.3%
Rank
#1 / 154 | 145122 |
McGaw Care Center & Frank Foster Pavilion is located in Evanston, Illinois.
Here are the financial assistance programs available to residents in Illinois.
McGaw Care Center & Frank Foster Pavilion is in the Grant Street neighborhood.
McGaw Care Center & Frank Foster Pavilion has a walk score of 64. Moderately walkable. Some errands can be accomplished on foot, with a mix of nearby amenities.
No, McGaw Care Center & Frank Foster Pavilion has a no-pet policy.
Yes — there are 7 photos of McGaw Care Center & Frank Foster Pavilion in the photo gallery on this page.
McGaw Care Center & Frank Foster Pavilion is located at 3200 Grant St, Evanston, IL 60201.
(847) 492-4840 will put you in contact with the team at McGaw Care Center & Frank Foster Pavilion.
McGaw Care Center & Frank Foster Pavilion is not currently listed as a CMS-certified provider of Medicare or Medicaid.
Care Cost Calculator: See Prices in Your Area
Nursing Home Data Explorer
Don’t Wait Too Long: 7 Red Flag Signs Your Parent Needs Assisted Living Now
The True Cost of Assisted Living in 2025 – And How Families Are Paying For It
Understanding Senior Living Costs: Pricing Models, Discounts & Financial Assistance


