Trinity Hill Care Center LLC
Nursing Home, Hospice Care, Nursing Care & Respite Care · Hartford, CT
CMS overall rating Info CMS (the Centers for Medicare & Medicaid Services) is the federal agency that rates nursing home quality. Its Overall Rating runs from 1 to 5 stars, combining health inspections, staffing, and quality measures, with inspections weighted most heavily.

Trinity Hill Care Center LLC

Nursing Home, Hospice Care, Nursing Care & Respite Care · Hartford, CT
CMS overall rating Info CMS (the Centers for Medicare & Medicaid Services) is the federal agency that rates nursing home quality. Its Overall Rating runs from 1 to 5 stars, combining health inspections, staffing, and quality measures, with inspections weighted most heavily.
Calculator: See prices in your area
Trinity Hill Care Center LLC accepts Medicare, Medicaid, and private pay.

Overview of Trinity Hill Care Center LLC

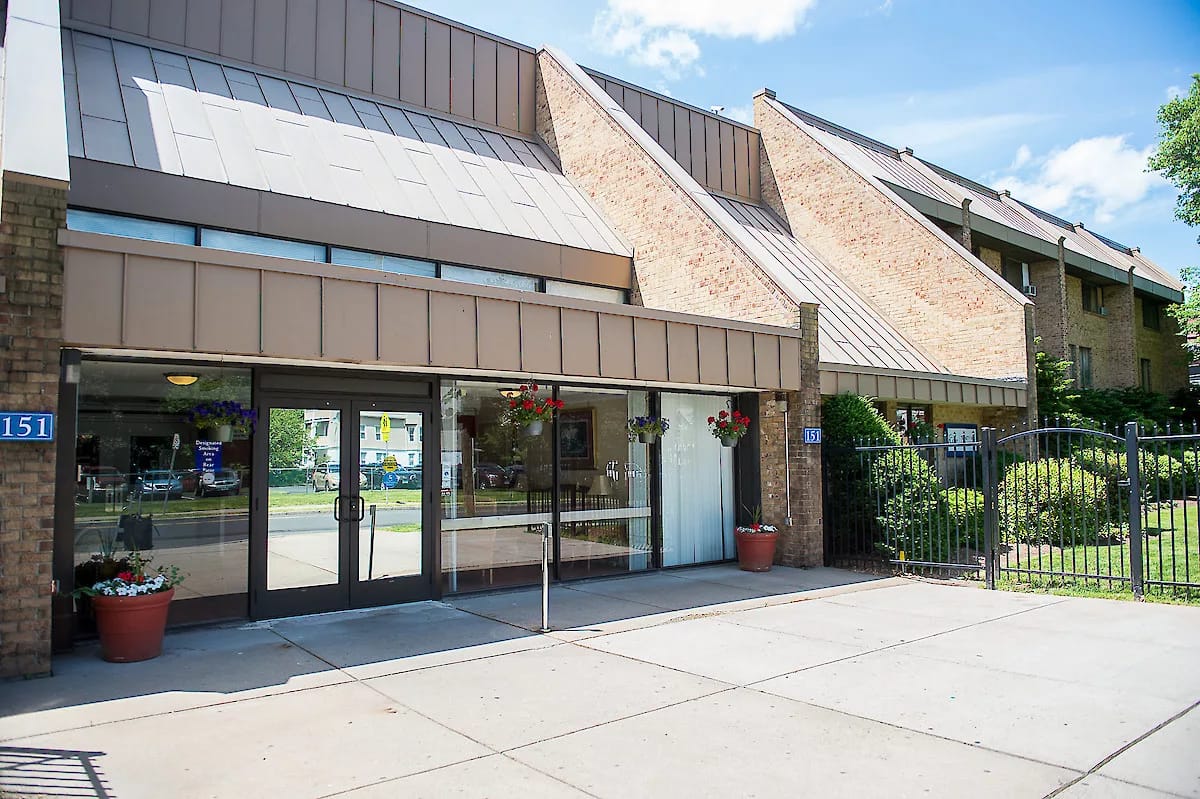
Sister community of the Parkville Care Center, expect Trinity Hill Care Center to maintain elegance and professionalism for its residents, promoting mutual respect and trust. Specializing in skilled nursing and rehabilitation services, residents maintain an active, supportive, and stimulating lifestyle. The team of dedicated professionals aims to fulfill each resident’s holistic wellness through the continuum of care services. Trinity Hill Care Center helps seniors have a speedy recovery.

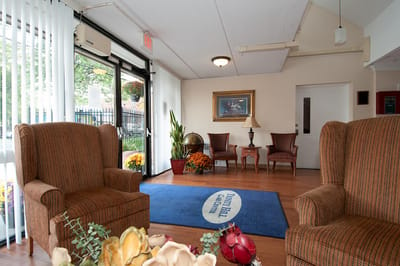
Trinity Hill’s center of excellence includes 24-hour nursing care, stimulating activities, engaging social activities and programs, therapy services that include speech, occupational, and physical, wound care, HIV care unit, and diabetes management, cardiac recovery– among many others.

(860) 951-1060

Quality ratings

Measured by Centers for Medicare & Medicaid Services (CMS)

Overall rating Info The Overall CMS Rating combines results from health inspections, staffing levels and quality measures. Health inspections carry the most weight. Staffing and quality scores can increase or decrease the final rating based on performance compared to state and national standards.
▼ 34.2% Below CT avg. ▼ 34.2% Below CT avg.CT average: 3.0Click the badge to see the full State ranking.Click here to see the full State ranking.
Health Inspection Info Based on the results of the facility's three most recent standard inspections and any complaint investigations. CMS reviews the number, scope, and severity of deficiencies, with more recent findings weighted more heavily.
▼ 64.2% Below CT avg. ▼ 64.2% Below CT avg.CT average: 2.8Click the badge to see the full State ranking.Click here to see the full State ranking.
Staffing Info Measures average nursing staff hours per resident per day, including Registered Nurses (RNs) and total nursing staff. Ratings are adjusted based on the level of care residents require and are compared to state and national benchmarks.
▼ 7.5% Below CT avg. ▼ 7.5% Below CT avg.CT average: 3.2Click the badge to see the full State ranking.Click here to see the full State ranking.
Quality Measures Info Based on clinical and physical health indicators reported to CMS, such as hospital readmissions, falls, pressure ulcers, and improvements in mobility. These measures reflect how well residents' health needs are being managed.
▲ 42.1% Above CT avg. ▲ 42.1% Above CT avg.CT average: 3.5Click the badge to see the full State ranking.Click here to see the full State ranking.

Staffing hours breakdown

Info Daily nursing hours per resident by staff type, reported to CMS. Higher is generally better — compare this facility to state and national averages to see where staffing stands.

Hours per resident per day — compared to Connecticut state averages

Total nursing care / resident Info This home is ranked 36th out of 67 homes in Connecticut for nurse hours. Total adjusted nursing hours per resident per day, combining RN, LPN, and aide time. CMS adjusts this for case-mix so facilities can be fairly compared.
3h 40m per day
Rank #36 / 67Nurse hours — State benchmarkedThis home is ranked 36th out of 67 homes in Connecticut. Shows adjusted nurse hours per resident per day benchmarked to the Connecticut average, with a ranking across 67 Connecticut facilities. More hours mean more direct care. The national average is about 3.5 hrs; below 3.0 is a red flag.Rankings are based only on facilities in Connecticut that report data for that category. Facilities without available data are excluded from the ranking.Click the rank badge to see the full State ranking.Click here to see the full State ranking.
This facility Connecticut avg (3h 58m per day)
vs Connecticut avg
-8%

5 of 6 metrics below state avg

Staff typeHours / Day / Residentvs state avg
Registered Nurse (RN) Info RNs hold the highest nursing license and can assess residents, interpret test results, and direct care plans. More RN hours per day often signals stronger clinical oversight and faster response to health changes. 21m per day ▼ 50% State avg: 42m per day · National avg: 41m per day
LPN / LVN Info Licensed Practical Nurses (LPNs) or Licensed Vocational Nurses (LVNs) deliver routine hands-on care — medication administration, wound dressing, and monitoring vital signs. They work under RN supervision and make up a large share of daily bedside care. 50m per day ■ Avg State avg: 50m per day · National avg: 52m per day
Nurse Aide Info Certified Nurse Aides (CNAs) provide the most direct day-to-day assistance: bathing, dressing, feeding, and mobility. Nurse aide hours are typically the largest staffing category and directly affect residents' quality of life. 1h 40m per day ▼ 27% State avg: 2h 17m per day · National avg: 2h 21m per day
Weekend Total Nursing Info Combined nursing hours (RN + LPN + Nurse Aide) per resident per day on weekends. Staffing often drops on weekends — this figure reveals whether the facility maintains adequate coverage outside of weekday hours. 2h 36m per day ▼ 24% State avg: 3h 25m per day · National avg: 3h 26m per day
Physical Therapist Info Hours per resident per day provided by licensed Physical Therapists (PTs) or PT Assistants. PT services help residents recover mobility after injury or illness and are especially important for post-acute (short-stay) rehabilitation. 1m per day ▼ 85% State avg: 5m per day · National avg: 4m per day
Weekend RN Info Registered nurse hours specifically on weekends. Facilities sometimes reduce RN presence on Saturdays and Sundays — a low weekend RN figure compared to weekday hours can indicate reduced clinical oversight when most administrative staff are absent. 14m per day ▼ 51% State avg: 28m per day · National avg: 29m per day

Capacity and availability

This home usually has availability

Higher occupancy than the Connecticut average: 84%
Occupancy rate
84.7% Rank #46 / 72Occupancy rate — State benchmarkedThis home is ranked 46th out of 72 homes in Connecticut. Shows this facility's occupancy rate versus the Connecticut average, with its Statewide rank out of 72. Higher occupancy signals strong local demand and financial stability.Rankings are based only on facilities in Connecticut that report data for that category. Facilities without available data are excluded from the ranking.Click the rank badge to see the full State ranking.Click here to see the full State ranking.
Avg. Length of Stay
309 days
Bed community size
144-bed community Rank #31 / 123Bed count — State benchmarkedThis home is ranked 31st out of 123 homes in Connecticut. Shows this facility's certified or reported bed count compared to other Connecticut facilities. Larger communities may offer more amenities, programs, and on-site services for residents and families.Rankings are based only on facilities in Connecticut that report data for that category. Facilities without available data are excluded from the ranking.Click the rank badge to see the full State ranking.Click here to see the full State ranking.
A larger shared setting that may offer more common spaces and organized community services.
Years in operation
17 years in operation Rank #45 / 132Years in operation — State benchmarkedThis home is ranked 45th out of 132 homes in Connecticut. Shows how long this facility has been in operation compared to other Connecticut facilities. Longer operating histories may benefit residents, families, and staff.Rankings are based only on facilities in Connecticut that report data for that category. Facilities without available data are excluded from the ranking.Click the rank badge to see the full State ranking.Click here to see the full State ranking.
A community with a solid operating history and experience delivering ongoing care.
Walk Score
Walk Score: 64 / 100 Rank #78 / 264Walk Score — State benchmarkedThis home is ranked 78th out of 264 homes in Connecticut. Shows how walkable this facility's neighborhood is compared to the average Walk Score across Connecticut facilities. Higher scores benefit residents, families, and staff.Rankings are based only on facilities in Connecticut that report data for that category. Facilities without available data are excluded from the ranking.Click the rank badge to see the full State ranking.Click here to see the full State ranking.
Moderately walkable. Some errands can be accomplished on foot, with a mix of nearby amenities.

About this community

License Details

Facility TypeChronic & Convalescent Nursing Home
StatusActive
IssuanceJanuary 4, 2009
ExpirationMarch 31, 2027
License Number2222C

Room costs

Private Room (12 rooms) $521 per day
Semi-Private Room (61 rooms) $488 per day

Staffing

Key information about the people who lead and staff this community.

Languages Spoken

Portuguese Spanish

Staff Composition (State Data)

Admin
4 FTE
Registered Nurse
6 FTE
Licensed Practical Nurse
17 FTE
Nursing Assistant
39 FTE
Recreation
4 FTE
Social Services
3 FTE
Food Service Supervisor
1 FTE
Dietary
10 FTE
Other Staff
12 FTE

Additional Policies & Features

Religious ServicesAll Denominations

Contact Trinity Hill Care Center LLC

Inspection History

In Connecticut, the Department of Public Health, Facility Licensing and Investigations Section conducts mandatory inspections and unannounced surveys to monitor the quality of care in long-term facilities.

Since 2017 · 9 years of data 164 deficiencies 15 inspections

Inspection Scorecard Info This scorecard compares key inspection, citation, and complaint metrics at this facility against the Connecticut state average. Metrics rated ≥15% worse than average are highlighted in red; those ≥15% better are highlighted in green.

Since 2017 vs. Connecticut state average
Overall vs. CT average 4 Worse Metrics worse than Connecticut average:
• Total deficiencies (763% above)
• Deficiencies per year (767% above)
• Deficiencies per inspection (627% above)
• Total inspections (15% above)
0 Better No metrics in this bucket.
Latest Inspection April 14, 2025

Deficiencies Info Deficiencies are formal regulatory issues recorded during state inspections.

This FacilityCT Averagevs. CT Avg
Total deficiencies Info Formal regulatory issues recorded by inspectors across all inspection types. 16419 This facility has 763% more total deficiencies than a typical Connecticut nursing home (164 vs. CT avg 19).↑ 763% worse
Deficiencies per year Info Average deficiencies per year since 2017. 18.22.1 This facility has 767% more deficiencies per year than a typical Connecticut nursing home (18.2 vs. CT avg 2.1).↑ 767% worse
Deficiencies per inspection Info Average deficiencies per inspection. 10.91.5 This facility has 627% more deficiencies per inspection than a typical Connecticut nursing home (10.9 vs. CT avg 1.5).↑ 627% worse

Inspections Info State inspections evaluate whether the facility meets health and safety standards.

This FacilityCT Averagevs. CT Avg
Total inspections Info Combined count of all routine and focused inspections. Excludes complaint investigations. 1513 This facility has 15% more total inspections than a typical Connecticut nursing home (15 vs. CT avg 13).↑ 15% worse

Inspection Reports Summary Info An editor-reviewed summary of the themes and findings across this facility's recent inspection reports.

  • May 20, 2025 complaint investigation found immediate jeopardy for failure to protect residents from abuse causing serious injury and inadequate supervision and care planning.
  • April 14, 2025 inspection substantiated multiple resident-to-resident physical abuse incidents and failure to meet required staffing levels on several days.
  • December 27, 2024 monitoring visit confirmed all previously identified violations were corrected as of November 27, 2024.

Health Inspection History

Inspections since 2019
Total health inspections 6

Connecticut average 5.7


Last Health inspection on May 2025

Total health citations
36 Rank #50 / 69Health citations — State benchmarkedThis home is ranked 50th out of 69 homes in Connecticut. Shows this facility's total health deficiency citations benchmarked to the Connecticut State average, with a ranking across all 69 CT facilities. Lower citation counts earn a better rank.Rankings are based only on facilities in Connecticut that report data for that category. Facilities without available data are excluded from the ranking.Click the rank badge to see the full State ranking.Click here to see the full State ranking.

Connecticut average 32

Citations per inspection
6 Rank #45 / 69Citations per inspection — State benchmarkedThis home is ranked 45th out of 69 homes in Connecticut. Shows average deficiency citations per CMS inspection for this facility versus the Connecticut mean across 69 facilities with citation data. Lower is better.Rankings are based only on facilities in Connecticut that report data for that category. Facilities without available data are excluded from the ranking.Click the rank badge to see the full State ranking.Click here to see the full State ranking.

Connecticut average 5.82


Health citations are formal notices following inspections when they fail to comply with safety and care standards.

24 of 36 citations resulted from standard inspections; 7 of 36 resulted from complaint investigations; and 5 of 36 came from combined inspections (standard and complaint).

Breakdown of citation severity (last 7 years)
Critical health citations
1
233% worse than Connecticut average

Connecticut average: 0.3


Serious health citations
0
100% better than Connecticut average

Connecticut average: 0.7

1 critical citation Connecticut average: 0.3

0 serious citations Connecticut average: 0.7

33 moderate citations Connecticut average: 28.8

2 minor citations Connecticut average: 2.3
Citations history (last 7 years)
Abuse/Neglect critical citation May 20, 2025
Corrected

Nursing Services moderate citation May 20, 2025
Corrected

Quality of Care moderate citation May 20, 2025
Corrected

Care Planning moderate citation May 20, 2025
Corrected

Staffing Data

Reporting period: October 1 – December 31, 2025 (Q4 2025). Source: CMS Payroll-Based Journal report.

Total staff 163
Employees 111
Contractors 52
Staff to resident ratio 1.42 : 1
24% fewer staff per resident than Connecticut average
Connecticut average ratio: 1.86 : 1 Connecticut average ratio: 1.86 : 1See full Connecticut ranking
Avg staff/day 55
Average shift 7.4 hours
0% compared with Connecticut average
Connecticut average: 7.5 hours Connecticut average shift: 7.5 hoursSee full Connecticut ranking
Total staff hours (quarter) 37,405

Nursing staff breakdown

Q4 2025 · Oct 1 – Dec 31 More info This data comes from the CMS Payroll-Based Journal report covering October 1 – December 31, 2025.
Registered Nurse

Manages medical care and health needs.

RN Staff Info 17 total: 6 full-time employees and 11 contractors. 17
Average shift length Info Average shift length. Calculated as total hours divided by days worked and average staff per day. 8 hours
Licensed Practical Nurse

Assists with medical care and medications.

LPN Staff Info 37 total: 23 full-time employees and 14 contractors. 37
Average shift length Info Average shift length. Calculated as total hours divided by days worked and average staff per day. 8 hours
Certified Nursing Assistant

Helps with daily care and mobility.

CNA Staff Info 66 total: 65 full-time employees and 1 contractor. 66
Average shift length Info Average shift length. Calculated as total hours divided by days worked and average staff per day. 7.4 hours

Contractor staffing

Q4 2025 · Oct 1 – Dec 31 More info This data comes from the CMS Payroll-Based Journal report covering October 1 – December 31, 2025.

Total hours from contractors

4.4%

1,640 contractor hours this quarter

Licensed Practical Nurse: 14 Registered Nurse: 11 Respiratory Therapy Technician: 5 Dietitian: 4 Physical Therapy Aide: 4 Clinical Nurse Specialist: 3 Qualified Social Worker: 2 Occupational Therapy Assistant: 2 Medical Director: 2 Certified Nursing Assistant: 1 Other Dietary Services Staff: 1 Physical Therapy Assistant: 1 Occupational Therapy Aide: 1 RN Director of Nursing: 1

Staff by category

Q4 2025 · Oct 1 – Dec 31 More info This data comes from the CMS Payroll-Based Journal report covering October 1 – December 31, 2025.
Certified Nursing Assistant6516619,60592100%7.4
Licensed Practical Nurse2314379,36892100%8
Registered Nurse611172,26092100%8
Clinical Nurse Specialist5381,4178592%6.9
Mental Health Service Worker3031,2236166%7.8
Dietitian2468527582%7.4
RN Director of Nursing2134715762%7.9
Other Dietary Services Staff2134576368%6.2
Nurse Practitioner1014485661%8
Physical Therapy Assistant0113715964%6.3
Administrator1013123942%8
Occupational Therapy Aide1121732426%7.2
Qualified Social Worker0221706368%2.6
Respiratory Therapy Technician0551514953%2.8
Occupational Therapy Assistant022573235%1.6
Medical Director022391718%2.2
Physical Therapy Aide044341011%3.4
66 Certified Nursing Assistant
% of Days 100%
37 Licensed Practical Nurse
% of Days 100%
17 Registered Nurse
% of Days 100%
8 Clinical Nurse Specialist
% of Days 92%
3 Mental Health Service Worker
% of Days 66%
6 Dietitian
% of Days 82%
3 RN Director of Nursing
% of Days 62%
3 Other Dietary Services Staff
% of Days 68%
1 Nurse Practitioner
% of Days 61%
1 Physical Therapy Assistant
% of Days 64%
1 Administrator
% of Days 42%
2 Occupational Therapy Aide
% of Days 26%
2 Qualified Social Worker
% of Days 68%
5 Respiratory Therapy Technician
% of Days 53%
2 Occupational Therapy Assistant
% of Days 35%
2 Medical Director
% of Days 18%
4 Physical Therapy Aide
% of Days 11%

Penalties and fines

Includes penalties issued in 2025

Federal penalties imposed by CMS for regulatory violations, including civil money penalties (fines) and denials of payment for new Medicare/Medicaid admissions.

Source: CMS Penalties Database (Data as of Jan 2026)

Total fines amount $59K Rank #61 / 69Federal fines — State benchmarkedThis home is ranked 61st out of 69 homes in Connecticut. Shows this facility's cumulative CMS federal fine dollars versus the Connecticut average among facilities with fines, and where it ranks among 69 facilities in the pool. Lower total dollars mean a better rank.Rankings are based only on facilities in Connecticut that report data for that category. Facilities without available data are excluded from the ranking.Click the rank badge to see the full State ranking.Click here to see the full State ranking.
35% higher than Connecticut average

Connecticut average: $44K

Number of fines 1
43% fewer fines than Connecticut average

Connecticut average: 1.7

Payment Denials Info Serious action where Medicare and/or Medicaid temporarily stops payments for new residents until issues are fixed. 0
100% fewer payment denials than Connecticut average

Connecticut average: 0.1

Fines amount comparison
This facility $59K
Connecticut average $44K
Penalty History

Penalties are imposed by CMS for violations of federal nursing home regulations.

1 penalty in the past 3 years

Apr 14, 2025 · $59K

Civil Money Penalty Info Fines imposed for noncompliance, which can be assessed per day or per instance of violation. Apr 14, 2025
$59K

Last updated: Jan 2026

Quality of care over time

These measures show how residents usually do over time at this home, based on health outcomes and preventive care.

High-risk clinical events score Info A composite score based on pressure ulcers, falls with injury, weight loss, walking ability decline, and activities of daily living decline. 4.8
54% better than Connecticut average

Connecticut average: 10.4

Functional decline score Info A composite score based on activities of daily living decline, walking ability decline, and incontinence. 10.4
51% better than Connecticut average

Connecticut average: 21.1

Long-stay resident measures
Above average Connecticut avg: 3.4 Info CMS star rating based on long-stay quality measure performance. 5 stars = significantly above average, 1 star = significantly below average.
Need for Help with Daily Activities Increased Info Percent of long-stay residents whose need for help with daily activities has increased 9.4%
50% better than Connecticut average

Connecticut average: 18.9%

Walking Ability Worsened Info Percent of long-stay residents whose ability to move independently worsened 7.2%
63% better than Connecticut average

Connecticut average: 19.2%

Low Risk Residents with Bowel/Bladder Incontinence Info Percent of low risk long-stay residents who lose control of their bowels or bladder 14.7%
41% better than Connecticut average

Connecticut average: 24.9%

Falls with Major Injury Info Percent of long-stay residents experiencing one or more falls with major injury 0.7%
81% better than Connecticut average

Connecticut average: 3.5%

High Risk Residents with Pressure Ulcers Info Percent of long-stay high risk residents with pressure ulcers 4.3%
7% better than Connecticut average

Connecticut average: 4.6%

Urinary Tract Infection Info Percent of long-stay residents with a urinary tract infection 0.7%
61% better than Connecticut average

Connecticut average: 1.7%

Lost Too Much Weight Info Percent of long-stay residents who lose too much weight 2.7%
58% better than Connecticut average

Connecticut average: 6.3%

Depressive Symptoms Info Percent of long-stay residents who have depressive symptoms 13.8%
9% better than Connecticut average

Connecticut average: 15.2%

Antipsychotic Use Info Percent of long-stay residents who received an antipsychotic medication 14.2%
17% better than Connecticut average

Connecticut average: 17.2%

Pneumococcal Vaccine Info Percent of long-stay residents assessed and appropriately given the pneumococcal vaccine 99.8%
14% better than Connecticut average

Connecticut average: 87.5%

Influenza Vaccine Info Percent of long-stay residents assessed and appropriately given the seasonal influenza vaccine 100.0%
7% better than Connecticut average

Connecticut average: 93.5%

Short-stay resident measures
Pneumococcal Vaccine Info Percent of short-stay residents assessed and appropriately given the pneumococcal vaccine 99.3%
42% better than Connecticut average

Connecticut average: 70.1%

Antipsychotic medication increase Info Percent of short-stay residents who newly received an antipsychotic medication 1.6%
6% worse than Connecticut average

Connecticut average: 1.5%

Influenza Vaccine Info Percent of short-stay residents assessed and appropriately given the seasonal influenza vaccine 100.0%
43% better than Connecticut average

Connecticut average: 69.8%

Breakdown by payment type

Medicare

8% of new residents, usually for short-term rehab.

Typical stay 1 - 2 months

Private pay

14% of new residents, often for short stays.

Typical stay 21 days

Medicaid

78% of new residents, often for long-term daily care.

Typical stay 11 months

Facility Characteristics

Source: CMS Long-Term Care Facility Characteristics (Data as of Jan 2026)

Total residents 115
Medicare
3
2.6% of residents
Medicaid
109
94.8% of residents
Private pay or other
3
2.6% of residents
Programs & Services
Residents Group

Residents meet regularly to discuss policies, care quality, and activities

Active Resident Council

Organized group of residents that meets regularly to discuss facility policies, quality of life, and activities.

Finances and operations

Based on CMS SNF Cost Report for fiscal year ending in 12/2023.

Privately-owned community
Operated by a single business entity.
Net patient revenue Info Net patient revenue — what the home actually collects for resident care, after contractual allowances, bad debt and discounts are subtracted from its gross charges (CMS cost report, Worksheet G-3). It covers resident care only; money the home earns from other sources is shown separately as "Other income."
$15.5M
Net patient income Info Net patient income: net patient revenue minus the home's total operating expenses. A positive figure means it earns more from resident care than it spends to deliver it; a negative figure means the opposite. It excludes non-operating "other income."
-$925.2K
Privately-owned community Operated by a single business entity.
Net patient revenue Info Net patient revenue — what the home actually collects for resident care, after contractual allowances, bad debt and discounts are subtracted from its gross charges (CMS cost report, Worksheet G-3). It covers resident care only; money the home earns from other sources is shown separately as "Other income."
$15.5M Rank #53 / 73Revenue — State benchmarkedThis home is ranked 53rd out of 73 homes in Connecticut. Shows this facility's annual revenue compared to the Connecticut average. Higher revenue generally means more resources for staffing and capital — read alongside Payroll %.Rankings are based only on facilities in Connecticut that report data for that category. Facilities without available data are excluded from the ranking.Click the rank badge to see the full State ranking.Click here to see the full State ranking.
Net patient income Info Net patient income: net patient revenue minus the home's total operating expenses. A positive figure means it earns more from resident care than it spends to deliver it; a negative figure means the opposite. It excludes non-operating "other income."
-$925.2K
Other income Info Money the home earns outside of resident care — such as investments, grants, rentals and other non-operating sources (CMS cost report, Worksheet G-3). It is tracked separately from net patient revenue: it is not part of that figure, and it is not included in net patient income.
$188.7K
Payroll costs Info Staff salaries plus wage-related costs — benefits such as payroll taxes, health insurance and retirement — from the home's own accounting records (CMS cost report, Worksheet A). Contract or agency labor is counted separately, under other operating costs. Rank #31 / 73Payroll — State benchmarkedThis home is ranked 31st out of 73 homes in Connecticut. Shows total annual staff payroll benchmarked to the Connecticut average. Higher payroll investment relative to peers often signals better staffing and less reliance on cheaper contract labor.Rankings are based only on facilities in Connecticut that report data for that category. Facilities without available data are excluded from the ranking.Click the rank badge to see the full State ranking.Click here to see the full State ranking.
$11.9M 76.6% of net patient revenue Info Payroll as a share of revenue: staff salaries and wage-related benefits divided by net patient revenue. A higher figure means more of each revenue dollar goes to staff pay. Rank #4 / 73Payroll % — State benchmarkedThis home is ranked 4th out of 73 homes in Connecticut. Shows payroll as a percentage of revenue versus the Connecticut average. Well-run Connecticut facilities typically land around 51–66% — the top third Statewide. Below 25% may signal understaffing or heavy agency use — read with Staffing ratings.Rankings are based only on facilities in Connecticut that report data for that category. Facilities without available data are excluded from the ranking.Click the rank badge to see the full State ranking.Click here to see the full State ranking.
Other operating costs Info Everything it costs to run the home apart from payroll — food, utilities, supplies, maintenance, contract labor and administration. Calculated as total operating expense minus payroll (staff salaries and wage-related benefits).
$4.6M
Total costs Info The home's total operating expense for the year — all the costs of running it, salaries included (CMS cost report, Worksheet G-3).
$16.5M

Who this home usually serves

TYPE OF STAY

Mostly long-term care residents

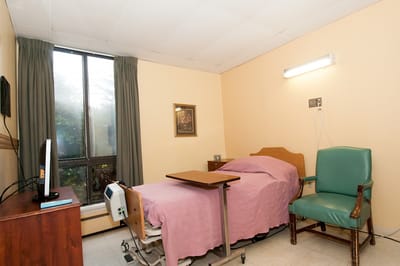
Most residents stay for extended periods and receive ongoing daily care.

Most new residents arrive under Medicaid (78% of admissions), and a typical Medicaid stay runs around 11 months.

Admissions
166 total

Coverage residents most often arrive under.

Medicare 8%
Private pay 14%
Medicaid 78%
Discharges
143 total

Coverage residents most often leave under.

Medicare 3%
Private pay 10%
Medicaid 87%

Places of interest near Trinity Hill Care Center LLC

Address 4.0 miles from city center Info Estimated distance in miles from Hartford's city center to Trinity Hill Care Center LLC's address, calculated via Google Maps.

Calculate Travel Distance to Trinity Hill Care Center LLC

Add your location

Address

Compare Nursing Homes around Hartford

The information below is reported by the Connecticut Department of Public Health, Facility Licensing and Investigations Section.

5 facilities compared · CMS & CT Dept. of Health data

West Hartford Health and Rehabilitation
NH
HC
MC
PC
RC
West Hartford (Fernridge Place)
160
Facility 160
CT AVG 111
Rank #21 / 123
81.3%
Facility 81.3%
CT AVG 84%
Rank #54 / 72
-3%- -28%-
$0
Facility $0
CT AVG $43.8k
Rank #1 / 69
25
Facility 25
CT AVG 32.0
Rank #28 / 69
8.3
Facility 8.3
CT AVG 5.8
Rank #66 / 69
-127-
67
Facility 67
CT AVG 47
Rank #69 / 264
Article Vi Marital Trust Under Leonard J. Schwartz Revocable Trust
$18.0M
Facility $18.0M
CT AVG $19.0M
Rank #30 / 73
$10.4M
Facility $10.4M
CT AVG $7.2M
Rank #36 / 73
57.7%
Facility 57.7%
CT AVG 42.4%
Rank #54 / 73
75278
Trinity Hill Care Center LLC
NH
HC
NC
RC
Hartford (Behind The Rocks)
144
Facility 144
CT AVG 111
Rank #31 / 123
84.7%
Facility 84.7%
CT AVG 84%
Rank #46 / 72
+1%
3.67
Facility 3.67
CT AVG 3.97
Rank #36 / 67
-3%-8%
$59.0k
Facility $59.0k
CT AVG $43.8k
Rank #61 / 69
36
Facility 36
CT AVG 32.0
Rank #50 / 69
6.0
Facility 6.0
CT AVG 5.8
Rank #45 / 69
1128-
64
Facility 64
CT AVG 47
Rank #78 / 264
-
$15.5M
Facility $15.5M
CT AVG $19.0M
Rank #53 / 73
$11.9M
Facility $11.9M
CT AVG $7.2M
Rank #31 / 73
76.6%
Facility 76.6%
CT AVG 42.4%
Rank #4 / 73
75268
Riverside Health and Rehabilitation Center
NH
HC
MC
PC
RC
East Hartford (Garvan–Carroll Historic District)
345
Facility 345
CT AVG 111
Rank #1 / 123
83.8%
Facility 83.8%
CT AVG 84%
Rank #49 / 72
0%
3.40
Facility 3.40
CT AVG 3.97
Rank #50 / 67
+23%-14%
$61.4k
Facility $61.4k
CT AVG $43.8k
Rank #62 / 69
33
Facility 33
CT AVG 32.0
Rank #47 / 69
4.1
Facility 4.1
CT AVG 5.8
Rank #16 / 69
5285-
63
Facility 63
CT AVG 47
Rank #81 / 264
David Smilovitz Trust
$39.0M
Facility $39.0M
CT AVG $19.0M
Rank #2 / 73
$26.5M
Facility $26.5M
CT AVG $7.2M
Rank #2 / 73
67.8%
Facility 67.8%
CT AVG 42.4%
Rank #37 / 73
75257
Chelsea Place Care Center LLC
NH
HC
MC
PC
Hartford (West End)
234
Facility 234
CT AVG 111
Rank #8 / 123
85.5%
Facility 85.5%
CT AVG 84%
Rank #45 / 72
+2%
3.69
Facility 3.69
CT AVG 3.97
Rank #36 / 67
--35%-7%
$39.5k
Facility $39.5k
CT AVG $43.8k
Rank #58 / 69
49
Facility 49
CT AVG 32.0
Rank #62 / 69
4.5
Facility 4.5
CT AVG 5.8
Rank #19 / 69
-199-
82
Facility 82
CT AVG 47
Rank #33 / 264
Solomon Melamed
$22.7M
Facility $22.7M
CT AVG $19.0M
Rank #37 / 73
$15.0M
Facility $15.0M
CT AVG $7.2M
Rank #14 / 73
66.3%
Facility 66.3%
CT AVG 42.4%
Rank #7 / 73
75299
Hughes Health and Rehabilitation -
NH
AL
West Hartford
170
Facility 170
CT AVG 111
Rank #18 / 123
--------------
68
Facility 68
CT AVG 47
Rank #66 / 264
$12.9M
Facility $12.9M
CT AVG $19.0M
Rank #49 / 73
$8.5M
Facility $8.5M
CT AVG $7.2M
Rank #47 / 73
65.6%
Facility 65.6%
CT AVG 42.4%
Rank #18 / 73
75082

Financial Assistance for
Nursing Home in Connecticut

Trinity Hill Care Center LLC is located in Hartford, Connecticut.
Here are the financial assistance programs available to residents in Connecticut.

Get Financial aid guidance

Connecticut Home Care Program for Elders

CHCPE

Age 65+
General Connecticut resident, at risk of nursing home placement.
Income Limits State-funded: ~$1,600/month; Medicaid: ~$2,829/month 300% FBR
Asset Limits $1,600 (state), $2,000 (Medicaid, individual).
CT

Two tiers (state and Medicaid); waitlists possible.

Benefits
In-home care (4-6 hours/day) Adult day care (~$70/day) Meals Respite (up to 14 days/year)

Statewide Respite Care Program

CT Respite Care

Age
General Caregiver of senior with dementia, Connecticut resident.
Income Limits ~$2,500/month individual, varies
Asset Limits $40,000 individual
CT

Limited to dementia caregivers; capped funding.

Benefits
In-home respite (up to 30 days/year) Adult day care (~$70/day)

Congregate Housing Services Program (CHSP)

Connecticut Congregate Housing Services Program

Age 62+
General Connecticut resident, frail but not needing 24/7 care, resides in CHSP-eligible housing.
Income Limits (2025) ~$41,000/year individual, adjusted annually
Asset Limits Not specified; focus is income-based.
CT

Limited to 14 state-subsidized sites; participants pay 10% of service costs.

Benefits
Personal care (3-5 hours/day) Meals ($5-$7/meal) Housekeeping Transportation (~5 trips/month)

Medicare Savings Program (MSP)

Connecticut Medicare Savings Program

Age 65+ or disabled
General Connecticut resident, enrolled in Medicare Part A/B.
Income Limits (2025) ~$2,510/month (individual, QMB); ~$3,380/month (SLMB); ~$3,598/month (ALMB)—adjusted annually.
Asset Limits None since 2023 policy change.
CT

Three tiers (Qualified Medicare Beneficiary, Specified Low-Income, Additional Low-Income); no asset test.

Benefits
Covers Medicare Part B premiums ($174.70/month) Deductibles ($240/year) Copays (~20% of services)

Frequently Asked Questions about Trinity Hill Care Center LLC

What neighborhood is Trinity Hill Care Center LLC in?

Trinity Hill Care Center LLC is in the Behind the Rocks neighborhood of Hartford.

What languages are spoken at Trinity Hill Care Center LLC?

The team at Trinity Hill Care Center LLC speaks Portuguese and Spanish.

Is Trinity Hill Care Center LLC in a walkable area?

Trinity Hill Care Center LLC has a walk score of 64. Moderately walkable. Some errands can be accomplished on foot, with a mix of nearby amenities.

What is the license number of Trinity Hill Care Center LLC?

According to CT state health department records, Trinity Hill Care Center LLC's license number is 2222C.

When does Trinity Hill Care Center LLC's license expire?

According to CT state health department records, Trinity Hill Care Center LLC's license expires on March 31, 2027.

What is the occupancy rate at Trinity Hill Care Center LLC?

Trinity Hill Care Center LLC's occupancy is 90.2%.

Are there photos of Trinity Hill Care Center LLC?

Yes — there are 5 photos of Trinity Hill Care Center LLC in the photo gallery on this page.

Guides for Better Senior Living

Care Cost Calculator: See Prices in Your Area

Nursing Home Data Explorer

Don’t Wait Too Long: 7 Red Flag Signs Your Parent Needs Assisted Living Now

The True Cost of Assisted Living in 2025 – And How Families Are Paying For It

Understanding Senior Living Costs: Pricing Models, Discounts & Financial Assistance