St. Edna Sub-Acute and Rehabilitation Center
Nursing Home & Skilled Nursing · Santa Ana, CA
CMS overall rating Info The Overall CMS Rating is scored from 1 to 5 stars and combines results from health inspections, staffing levels, and quality measures. Health inspections carry the most weight. Staffing and quality scores can increase or decrease the final rating based on performance compared to state and national standards.

St. Edna Sub-Acute and Rehabilitation Center

Nursing Home & Skilled Nursing · Santa Ana, CA
CMS overall rating Info The Overall CMS Rating is scored from 1 to 5 stars and combines results from health inspections, staffing levels, and quality measures. Health inspections carry the most weight. Staffing and quality scores can increase or decrease the final rating based on performance compared to state and national standards.
Calculator: See prices in your area
St. Edna Sub-Acute and Rehabilitation Center accepts Medicare, Medicaid, and private pay.

Overview of St. Edna Sub-acute and Rehabilitation Center

St. Edna Sub-acute and Rehabilitation Center, located in Santa Ana, California, is a 24-hour skilled nursing facility comprising 144 beds. Under the supervision of the Medical Director and the attending physician, St. Edna Sub-acute and Rehabilitation Center offers round-the-clock skilled nursing care, ensuring the provision of comprehensive, tailored treatment plans. These individualized care plans encompass progressive therapy strategies, all aimed at restoring patients to their previous levels of functioning, guided by a harmonized approach to clinical and rehabilitation care.

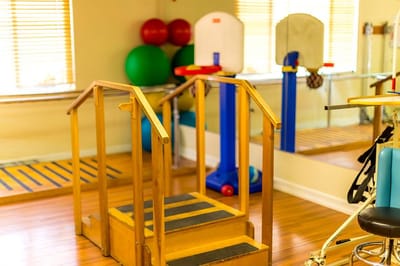
This dedicated healthcare establishment boasts a team of committed professionals whose primary mission is to aid patients in their recovery following surgery, injury, or severe illness. As an integrated team, their collective goal transcends mere expectations, aspiring to deliver exceptional rehabilitative therapy and nursing care standards. St. Edna Sub-acute and Rehabilitation Center is steadfast in empowering patients to attain their utmost functional potential, ultimately facilitating their transition to the least restrictive care setting possible.

(714) 554-9700

Quality ratings

Measured by Centers for Medicare & Medicaid Services (CMS)

Overall rating Info The Overall CMS Rating combines results from health inspections, staffing levels and quality measures. Health inspections carry the most weight. Staffing and quality scores can increase or decrease the final rating based on performance compared to state and national standards.
▼ 44.4% Below CA avg. ▼ 44.4% Below CA avg.Click the badge to see the full State ranking.Click here to see the full State ranking.
Health Inspection Info Based on the results of the facility's three most recent standard inspections and any complaint investigations. CMS reviews the number, scope, and severity of deficiencies, with more recent findings weighted more heavily.
▼ 36.5% Below CA avg. ▼ 36.5% Below CA avg.Click the badge to see the full State ranking.Click here to see the full State ranking.
Staffing Info Measures average nursing staff hours per resident per day, including Registered Nurses (RNs) and total nursing staff. Ratings are adjusted based on the level of care residents require and are compared to state and national benchmarks.
▼ 13.0% Below CA avg. ▼ 13.0% Below CA avg.Click the badge to see the full State ranking.Click here to see the full State ranking.
Quality Measures Info Based on clinical and physical health indicators reported to CMS, such as hospital readmissions, falls, pressure ulcers, and improvements in mobility. These measures reflect how well residents' health needs are being managed.
▼ 6.1% Below CA avg. ▼ 6.1% Below CA avg.Click the badge to see the full State ranking.Click here to see the full State ranking.

Staffing hours breakdown

Info Daily nursing hours per resident by staff type, reported to CMS. Higher is generally better — compare this facility to state and national averages to see where staffing stands.

Hours per resident per day — compared to California state averages

Total nursing care / resident Info This home is ranked 225th out of 346 homes in California. Total adjusted nursing hours per resident per day, combining RN, LPN, and aide time. CMS adjusts this for case-mix so facilities can be fairly compared.
3h 49m per day
Rank #225 / 346Nurse hours — State benchmarkedThis home is ranked 225th out of 346 homes in California. Shows adjusted nurse hours per resident per day benchmarked to the California average, with a ranking across 346 California SNFs. More hours mean more direct care. The national average is about 3.5 hrs; below 3.0 is a red flag.Click the rank badge to see the full State ranking.Click here to see the full State ranking.
This facility California avg (4h 23m per day)
vs California avg
-13%

6 of 6 metrics below state avg

Staff typeHours / Day / Residentvs state avg
Registered Nurse (RN) Info RNs hold the highest nursing license and can assess residents, interpret test results, and direct care plans. More RN hours per day often signals stronger clinical oversight and faster response to health changes. 17m per day ▼ 56% State avg: 39m per day · National avg: 41m per day
LPN / LVN Info Licensed Practical Nurses (LPNs) or Licensed Vocational Nurses (LVNs) deliver routine hands-on care — medication administration, wound dressing, and monitoring vital signs. They work under RN supervision and make up a large share of daily bedside care. 1h 9m per day ▼ 5% State avg: 1h 13m per day · National avg: 52m per day
Nurse Aide Info Certified Nurse Aides (CNAs) provide the most direct day-to-day assistance: bathing, dressing, feeding, and mobility. Nurse aide hours are typically the largest staffing category and directly affect residents' quality of life. 2h 27m per day ▼ 8% State avg: 2h 39m per day · National avg: 2h 21m per day
Total Nursing (Weekend) Info Combined nursing hours (RN + LPN + Nurse Aide) per resident per day on weekends. Staffing often drops on weekends — this figure reveals whether the facility maintains adequate coverage outside of weekday hours. 3h 35m per day ▼ 12% State avg: 4h 5m per day · National avg: 3h 26m per day
Physical Therapist Info Hours per resident per day provided by licensed Physical Therapists (PTs) or PT Assistants. PT services help residents recover mobility after injury or illness and are especially important for post-acute (short-stay) rehabilitation. 3m per day ▼ 40% State avg: 5m per day · National avg: 4m per day
RN (Weekend) Info Registered nurse hours specifically on weekends. Facilities sometimes reduce RN presence on Saturdays and Sundays — a low weekend RN figure compared to weekday hours can indicate reduced clinical oversight when most administrative staff are absent. 10m per day ▼ 67% State avg: 30m per day · National avg: 29m per day

Types of Care at St. Edna Sub-Acute and Rehabilitation Center

Skilled Nursing

Capacity and availability

This home usually has limited availability

Occupancy between 85% and 95% suggests balanced demand.

Higher occupancy than the California average: 84.7%
Occupancy rate 92.5% Rank #74 / 351Occupancy rate — State benchmarkedThis home is ranked 74th out of 351 homes in California. Shows this facility's occupancy rate versus the California average, with its Statewide rank out of 351. Higher occupancy signals strong local demand and financial stability.Click the rank badge to see the full State ranking.Click here to see the full State ranking.
Avg. Length of Stay 77 days
Occupancy rate
92.5% Rank #74 / 351Occupancy rate — State benchmarkedThis home is ranked 74th out of 351 homes in California. Shows this facility's occupancy rate versus the California average, with its Statewide rank out of 351. Higher occupancy signals strong local demand and financial stability.Click the rank badge to see the full State ranking.Click here to see the full State ranking.
Avg. Length of Stay
77 days
Walk Score
Walk Score: 71 / 100 Rank #132 / 359Walk Score — State benchmarkedThis home is ranked 132nd out of 359 homes in California. Shows how walkable this facility's neighborhood is compared to the average Walk Score across California SNFs. Higher scores benefit residents, families, and staff.Click the rank badge to see the full State ranking.Click here to see the full State ranking.
Very walkable. Most errands can be accomplished on foot, and many essentials are within a short walk.
BBB Rating
BBB Rating: A+ (Not Accredited)
An independent rating from the Better Business Bureau based on factors such as complaint history, transparency, and business practices.
How BBB ratings work

License Details

CMS Certification Number555093

Contact St. Edna Sub-Acute and Rehabilitation Center

Inspection History

In California, the Department of Social Services (for assisted living facilities) and the Department of Public Health (for nursing homes) conduct inspections to ensure resident safety and regulatory compliance.

Since 2022 · 4 years of data 105 citations 0 complaint visits

Inspection Scorecard Info This scorecard compares key inspection, citation, and complaint metrics at this facility against the California state average. Metrics rated ≥15% worse than average are highlighted in red; those ≥15% better are highlighted in green.

Since 2022 vs. California state average
Overall vs. CA average 2 Worse Metrics worse than California average:
• Total citations (950% above)
• Citations per year (952% above)
3 Better Metrics better than California average:
• Total visits (100% below)
• Complaint visits (100% below)
• Other visits (100% below)
Latest Inspection November 26, 2025 Other

Citations Info Citations are formal regulatory issues recorded during state inspections.

This FacilityCA Averagevs. CA Avg
Total citations Info Formal regulatory issues recorded by inspectors across all inspection types. 10510 This facility has 950% more total citations than a typical California nursing home (105 vs. CA avg 10).↑ 950% worse
Citations per year Info Average citations per year since 2022. 26.32.5 This facility has 952% more citations per year than a typical California nursing home (26.3 vs. CA avg 2.5).↑ 952% worse

Inspections & Visits Info State inspections evaluate whether the facility meets health and safety standards.

This FacilityCA Averagevs. CA Avg
Total visits Info Combined count of complaint visits, other regulatory visits, and official scheduled inspections. 016 This facility has 100% fewer total visits than a typical California nursing home (0 vs. CA avg 16).↓ 100% better
Complaint visits Info On-site visits triggered by formal complaints filed by residents, families, or staff. 013 This facility has 100% fewer complaint visits than a typical California nursing home (0 vs. CA avg 13).↓ 100% better
Other visits Info Regulatory visits that are neither routine inspections nor complaint investigations — administrative check-ins, follow-up reviews, licensing-related visits. 07 This facility has 100% fewer other visits than a typical California nursing home (0 vs. CA avg 7).↓ 100% better

Inspection Reports Summary Info An editor-reviewed summary of the themes and findings across this facility's recent inspection reports.

This facility’s inspection record is mixed, showing ongoing issues with care planning, medication management, infection control, and resident safety despite some recent improvements in background screening. The November 26, 2025 inspection found one deficiency for failing to exclude a Medi-Cal barred employee, while May 13, 2025 routine and complaint inspections documented many deficiencies including medication errors, infection control lapses, and failure to protect a resident from abuse. Earlier inspections revealed repeated failures in wound care, fall risk assessment, and food service, indicating persistent challenges across multiple care areas.

Read the full inspection reports for this facility, including detailed findings and corrective actions.

Show Inspection Reports

Health Inspection History

Inspections Since 2024
Total health inspections 15

California average 12.5


Last Health inspection on Jul 2025

Total health citations
94 Rank #326 / 354Health citations — State benchmarkedThis home is ranked 326th out of 354 homes in California. Shows this facility's total health deficiency citations benchmarked to the California State average, with a ranking across all 354 CA SNFs. Lower citation counts earn a better rank.Click the rank badge to see the full State ranking.Click here to see the full State ranking.

California average 50.2

Citations per inspection
6.27 Rank #304 / 354Citations per inspection — State benchmarkedThis home is ranked 304th out of 354 homes in California. Shows average deficiency citations per CMS inspection for this facility versus the California mean across 354 SNFs with citation data. Lower is better.Click the rank badge to see the full State ranking.Click here to see the full State ranking.

California average 4.65


Health citations are formal notices following inspections when they fail to comply with safety and care standards.

66 of 94 citations resulted from standard inspections; and 26 of 94 resulted from complaint investigations.

Breakdown of citation severity (last 2 years)
Critical Health citations
0
100% better than California average

California average: 0.4


Serious Health citations
0
100% better than California average

California average: 1

0 critical citations California average: 0.4

0 serious citations California average: 1

82 moderate citations California average: 47.2

12 minor citations California average: 1.5
Citations history (last 2 years)
Care Planning minor citation Jul 17, 2025

Abuse/Neglect moderate citation May 13, 2025
Corrected

Abuse/Neglect moderate citation May 13, 2025
Corrected

Administration minor citation May 13, 2025
Corrected

Staffing Data

Reporting period: October 1 – December 31, 2025 (Q4 2025). Source: CMS Payroll-Based Journal report.

Total staff 171
Employees 165
Contractors 6
Staff to resident ratio 1.28:1
1276019% better than California average
California average ratio: 0.00:1 California average ratio: 0.00:1See full California ranking
Avg staff/day 85
Average shift 7.4 hours
0% compared with California average
California average: 7.7 hours California average shift: 7.7 hoursSee full California ranking
Total staff hours (quarter) 58,189

Nursing staff breakdown

Q4 2025 · Oct 1 – Dec 31 More info This data comes from the CMS Payroll-Based Journal report covering October 1 – December 31, 2025.
Registered Nurse

Manages medical care and health needs.

Total count 12
Average shift length Info Average shift length. Calculated as total hours divided by days worked and average staff per day. 7.3 hours

No contractors work on this role.

Licensed Practical Nurse

Assists with medical care and medications.

Total count 27
Average shift length Info Average shift length. Calculated as total hours divided by days worked and average staff per day. 7.6 hours

No contractors work on this role.

Certified Nursing Assistant

Helps with daily care and mobility.

Total count 88
Average shift length Info Average shift length. Calculated as total hours divided by days worked and average staff per day. 7.2 hours

No contractors work on this role.

Contractor staffing

Q4 2025 · Oct 1 – Dec 31 More info This data comes from the CMS Payroll-Based Journal report covering October 1 – December 31, 2025.

Total hours from contractors

1.4%

840 contractor hours this quarter

Other Physician: 3 Occupational Therapy Assistant: 1 Medical Director: 1 Occupational Therapy Aide: 1

Staff by category

Q4 2025 · Oct 1 – Dec 31 More info This data comes from the CMS Payroll-Based Journal report covering October 1 – December 31, 2025.
Certified Nursing Assistant8808829,50592100%7.2
Licensed Practical Nurse2702711,55592100%7.6
RN Director of Nursing6062,9226571%7.8
Registered Nurse120122,23292100%7.3
Respiratory Therapy Technician4041,5057480%7.4
Other Dietary Services Staff4041,50292100%7.6
Physical Therapy Aide4041,4657278%7.6
Speech Language Pathologist5051,1217177%7.4
Dental Services Staff2021,0186571%8.1
Physical Therapy Assistant3039317885%7.6
Occupational Therapy Aide0116163942%15.8
Qualified Social Worker2025196571%7.6
Qualified Activities Professional3035135155%8.2
Administrator1015126470%8
Nurse Practitioner1015126470%8
Clinical Nurse Specialist1015126470%8
Dietitian1015126470%8
Mental Health Service Worker1015126470%8
Other Physician0331203336%3
Medical Director011801011%8
Occupational Therapy Assistant0112422%12
88 Certified Nursing Assistant
% of Days 100%
27 Licensed Practical Nurse
% of Days 100%
6 RN Director of Nursing
% of Days 71%
12 Registered Nurse
% of Days 100%
4 Respiratory Therapy Technician
% of Days 80%
4 Other Dietary Services Staff
% of Days 100%
4 Physical Therapy Aide
% of Days 78%
5 Speech Language Pathologist
% of Days 77%
2 Dental Services Staff
% of Days 71%
3 Physical Therapy Assistant
% of Days 85%
1 Occupational Therapy Aide
% of Days 42%
2 Qualified Social Worker
% of Days 71%
3 Qualified Activities Professional
% of Days 55%
1 Administrator
% of Days 70%
1 Nurse Practitioner
% of Days 70%
1 Clinical Nurse Specialist
% of Days 70%
1 Dietitian
% of Days 70%
1 Mental Health Service Worker
% of Days 70%
3 Other Physician
% of Days 36%
1 Medical Director
% of Days 11%
1 Occupational Therapy Assistant
% of Days 2%

Penalties and fines

Federal penalties imposed by CMS for regulatory violations, including civil money penalties (fines) and denials of payment for new Medicare/Medicaid admissions.

Source: CMS Penalties Database (Data as of Jan 2026)

Total fines amount $21K Rank #260 / 354Federal fines — State benchmarkedThis home is ranked 260th out of 354 homes in California. Shows this facility's cumulative CMS federal fine dollars versus the California average among facilities with fines, and where it ranks among 354 skilled nursing facilities in the pool. Lower total dollars mean a better rank.Click the rank badge to see the full State ranking.Click here to see the full State ranking.
62% lower than California average

California average: $55K

Number of fines 2
15% fewer fines than California average

California average: 2.4

Payment Denials Info Serious action where Medicare and/or Medicaid temporarily stops payments for new residents until issues are fixed. 0
100% fewer payment denials than California average

California average: 0.5

Fines amount comparison
This facility $21K
California average $55K

No penalties in the past 3 years

No civil money penalties or payment denials were reported in the last 3 years.

Quality of care over time

These measures show how residents usually do over time at this home, based on health outcomes and preventive care.

High-risk clinical events score Info A composite score based on pressure ulcers, falls with injury, weight loss, walking ability decline, and activities of daily living decline. 5.3
21% better than California average

California average: 6.6

Functional decline score Info A composite score based on activities of daily living decline, walking ability decline, and incontinence. 8.7
23% better than California average

California average: 11.3

Long-stay resident measures
Significantly above average California avg: 4.2 Info CMS star rating based on long-stay quality measure performance. 5 stars = significantly above average, 1 star = significantly below average.
Need for Help with Daily Activities Increased Info Percent of long-stay residents whose need for help with daily activities has increased 7.6%
31% better than California average

California average: 11.1%

Walking Ability Worsened Info Percent of long-stay residents whose ability to move independently worsened 10.8%
10% better than California average

California average: 12.0%

Low Risk Residents with Bowel/Bladder Incontinence Info Percent of low risk long-stay residents who lose control of their bowels or bladder 7.7%
32% better than California average

California average: 11.3%

Falls with Major Injury Info Percent of long-stay residents experiencing one or more falls with major injury 0.7%
58% better than California average

California average: 1.7%

High Risk Residents with Pressure Ulcers Info Percent of long-stay high risk residents with pressure ulcers 3.9%
21% better than California average

California average: 5.0%

Urinary Tract Infection Info Percent of long-stay residents with a urinary tract infection 0.7%
42% better than California average

California average: 1.2%

Lost Too Much Weight Info Percent of long-stay residents who lose too much weight 3.3%
22% better than California average

California average: 4.2%

Depressive Symptoms Info Percent of long-stay residents who have depressive symptoms 0.5%
92% better than California average

California average: 6.7%

Antipsychotic Use Info Percent of long-stay residents who received an antipsychotic medication 4.8%
53% better than California average

California average: 10.1%

Pneumococcal Vaccine Info Percent of long-stay residents assessed and appropriately given the pneumococcal vaccine 100.0%
In line with California average

California average: 98.5%

Influenza Vaccine Info Percent of long-stay residents assessed and appropriately given the seasonal influenza vaccine 100.0%
In line with California average

California average: 98.2%

Hospitalizations per 1,000 days Info Number of hospitalizations per 1,000 long-stay resident days. 3.64
62% worse than California average

California average: 2.25

ED visits per 1,000 days Info Number of outpatient emergency department visits per 1,000 long-stay resident days. 1.11
30% better than California average

California average: 1.59

Short-stay resident measures
Average California avg: 3.5 Info CMS star rating based on short-stay quality measure performance. 5 stars = much above average, 1 star = much below average.
Pneumococcal Vaccine Info Percent of short-stay residents assessed and appropriately given the pneumococcal vaccine 100.0%
6% better than California average

California average: 94.0%

Antipsychotic medication increase Info Percent of short-stay residents who newly received an antipsychotic medication 1.4%
In line with California average

California average: 1.5%

Influenza Vaccine Info Percent of short-stay residents assessed and appropriately given the seasonal influenza vaccine 100.0%
7% better than California average

California average: 93.2%

Re-hospitalized after SNF stay Info Percentage of short-stay residents who were re-hospitalized after their nursing home admission. 25.4%
9% worse than California average

California average: 23.2%

Emergency department visits Info Percentage of short-stay residents who had an outpatient emergency department visit. 6.6%
41% better than California average

California average: 11.2%

Falls with major injury Info Percentage of SNF residents who experience falls with major injury during their stay. 0.0%
100% better than California average

California average: 0.8%

Ability to care for self at discharge Info Percentage of residents at or above expected ability to care for themselves at discharge. 50.9%
5% worse than California average

California average: 53.7%

Successful return to home or community Info Rate of successful return to home or community from a skilled nursing facility. 38.5%
24% worse than California average

California average: 50.6%

Breakdown by payment type

Medicare

24% of new residents, usually for short-term rehab.

Typical stay 26 days

Private pay

62% of new residents, often for short stays.

Typical stay 4 - 5 months

Medicaid

14% of new residents, often for long-term daily care.

Typical stay 1 - 2 months

Facility Characteristics

Source: CMS Long-Term Care Facility Characteristics (Data as of Jan 2026)

Total residents 134
Medicare
10
7.5% of residents
Medicaid
88
65.7% of residents
Private pay or other
36
26.9% of residents
Programs & Services
Residents Group

Residents meet regularly to discuss policies, care quality, and activities

Nurse Aide Training

State-approved Nurse Aide Training and Competency Evaluation Program on-site

Active Resident Council

Organized group of residents that meets regularly to discuss facility policies, quality of life, and activities.

Finances and operations

Privately-owned community
Operated by a business corporation.
Home revenue
$16.8M
Operating loss
-$51.8K
Privately-owned community Operated by a business corporation.
Home revenue
$16.8M Rank #169 / 347Revenue — State benchmarkedThis home is ranked 169th out of 347 homes in California. Shows this facility's annual revenue compared to the California SNF average. Higher revenue generally means more resources for staffing and capital — read alongside Payroll %.Click the rank badge to see the full State ranking.Click here to see the full State ranking.
Operating loss
-$51.8K
Payroll costs Info The portion of the home's budget spent on staff, including nurses, caregivers, and other employees who support care and operations. Rank #75 / 347Payroll — State benchmarkedThis home is ranked 75th out of 347 homes in California. Shows total annual staff payroll benchmarked to the California average. Higher payroll investment relative to peers often signals better staffing and less reliance on cheaper contract labor.Click the rank badge to see the full State ranking.Click here to see the full State ranking.
$12.0M
71.3% of revenue Rank #24 / 347Payroll % — State benchmarkedThis home is ranked 24th out of 347 homes in California. Shows payroll as a percentage of revenue versus the California average. Well-run California SNFs typically land around 56–67% — the top third Statewide. Below 25% may signal understaffing or heavy agency use — read with Staffing ratings.Click the rank badge to see the full State ranking.Click here to see the full State ranking.
Other operating costs Info All remaining costs needed to run the home, such as food, utilities, building maintenance, supplies and administrative expenses.
$4.9M
Total costs $16.8M

Who this home usually serves

TYPE OF STAY

Primarily short stays

Residents typically stay for brief periods, with frequent admissions and discharges throughout the year.

Places of interest near St. Edna Sub-Acute and Rehabilitation Center

Address 3.4 miles from city center Info Estimated distance in miles from Santa Ana's city center to St. Edna Sub-Acute and Rehabilitation Center's address, calculated via Google Maps. — 7.87 miles to nearest hospital (Orange County Heart Institute and Research Center)

Calculate Travel Distance to St. Edna Sub-Acute and Rehabilitation Center

Add your location

Address

Financial Assistance for
Nursing Home in California

St. Edna Sub-Acute and Rehabilitation Center is located in Santa Ana, California.
Here are the financial assistance programs available to residents in California.

Get Financial aid guidance

Multipurpose Senior Services Program

MSSP (Medi-Cal Waiver)

Age 65+
General California resident, Medi-Cal eligible, nursing home risk.
Income Limits (2025) ~$2,829/month 300% FBR, individual
Asset Limits $2,000 (individual), $3,000 (couple).
CA

County-managed; waitlists possible.

Benefits
In-home support (4-6 hours/day) Respite care (14 days/year) Meals (~$6/meal) Transportation (8 trips/month) Care management

In-Home Supportive Services (IHSS)

California IHSS

Age 65+
General California resident, Medicaid-eligible or low-income.
Income Limits ~$1,732/month individual, Medi-Cal threshold
Asset Limits $2,000 individual
CA

Can hire family as caregivers.

Benefits
Personal care (up to 283 hours/month) Homemaker services Respite (varies)

Multipurpose Senior Services Program (MSSP)

CA MSSP

Age 65+
General California resident, Medi-Cal-eligible, nursing home-eligible but community-capable.
Income Limits ~$2,829/month 300% FBR, individual
Asset Limits $2,000 individual
CA

Available in 38 counties; waitlists common.

Benefits
Case management Respite care (up to 10 days/year) Minor home mods (avg. $500) Adult day care (~$50/day)

Property Tax Postponement Program (PTP)

CA PTP

Age 62+
General California resident, own and live in home, 40% equity.
Income Limits (2025) ~$51,500/year household, adjusted annually
Asset Limits Equity-based; no strict asset cap.
CA

Deferred taxes accrue interest (5% as of 2024); repaid upon sale/death.

Benefits
Property tax deferral (avg. $1,000-$3,000/year, varies by county)

Assisted Living Waiver (ALW)

CA ALW

Age 65+ or disabled
General California resident, Medi-Cal-eligible, nursing home-eligible.
Income Limits ~$2,829/month 300% FBR, individual
Asset Limits $2,000 individual
CA

Available in 15 counties (e.g., LA, Sacramento); waitlists common.

Benefits
Personal care in ALFs (5-7 hours/day) Medication management Social services

California CARES Program

CA CARES

Age
General Caregivers of California residents 60+ needing help with 3+ daily activities; no caregiver age limit.
Income Limits No strict limit; cost-sharing above ~$2,500/month threshold.
Asset Limits Not applicable; need-based.
CA

High demand in urban areas; complements IHSS respite.

Benefits
Respite care (up to 10 days/year) Counseling (4-6 sessions/year) Training (2-3 workshops/year) Supplies (~$200/year)

Compare Nursing Home around Santa Ana

The information below is reported by the California Department of Social Services and Department of Public Health.

4 facilities compared · CMS & CA Dept. of Health data

Filter by care type
Town & Country
NH

Nursing Home Licensed facility providing 24/7 skilled nursing care for residents with complex, ongoing medical needs. Staffed by RNs, LPNs, and CNAs. Inspected and star-rated annually by CMS. Accepts Medicare (short-term rehab) and Medicaid (long-term care).

AL

Assisted Living A licensed, long-term care setting for seniors or individuals with disabilities who need help with daily activities — like bathing, dressing, and medication management — but not 24-hour skilled nursing. Offers housing, meals, and around-the-clock support while aiming to maximize resident independence.

IL

Independent Living Lifestyle-focused communities for older adults offering dining, activities, and transportation with minimal personal care. Best for active, independent seniors who want community without medical support.

MC

Memory Care Secured, specialized care for people living with Alzheimer's or dementia. Staff trained in cognitive impairment, with higher staff-to-resident ratios and an environment designed to reduce confusion and wandering risk.

Santa Ana (East Memory Lane)328 33.8% -60%5.25 +24%+24%$0315.2-82A+ 67 Rod Bollins$44.3M$13.6M30.6%555141
The Hills Post Acute
NH

Nursing Home Licensed facility providing 24/7 skilled nursing care for residents with complex, ongoing medical needs. Staffed by RNs, LPNs, and CNAs. Inspected and star-rated annually by CMS. Accepts Medicare (short-term rehab) and Medicaid (long-term care).

Santa Ana (Meredith Parkwood)172 93.7% +11%4.14 +1%-2%$4.9k1185.1-162A+ 70 -$27.3M$12.7M46.6%555765
St. Edna Sub-Acute and Rehabilitation Center
NH

Nursing Home Licensed facility providing 24/7 skilled nursing care for residents with complex, ongoing medical needs. Staffed by RNs, LPNs, and CNAs. Inspected and star-rated annually by CMS. Accepts Medicare (short-term rehab) and Medicaid (long-term care).

Santa Ana (Edna Park)144 92.5% +9%3.82 -18%-10%$20.6k946.3-135A+ 71 -$16.8M$12.0M71.3%555093
French Park Care Center
NH

Nursing Home Licensed facility providing 24/7 skilled nursing care for residents with complex, ongoing medical needs. Staffed by RNs, LPNs, and CNAs. Inspected and star-rated annually by CMS. Accepts Medicare (short-term rehab) and Medicaid (long-term care).

Santa Ana (French Park)202 90.3% +7%3.53 +8%-16%$01174.7-185A+ 87 Smita Muir$46.1M$18.1M39.3%555103

Frequently Asked Questions about St. Edna Sub-Acute and Rehabilitation Center

What neighborhood is St. Edna Sub-Acute and Rehabilitation Center in?

St. Edna Sub-Acute and Rehabilitation Center is in the Edna Park neighborhood of Santa Ana.

Is St. Edna Sub-Acute and Rehabilitation Center in a walkable area?

St. Edna Sub-Acute and Rehabilitation Center has a walk score of 71. Very walkable. Most errands can be accomplished on foot, and many essentials are within a short walk.

What is the phone number of St. Edna Sub-Acute and Rehabilitation Center?

(714) 554-9700 will put you in contact with the team at St. Edna Sub-Acute and Rehabilitation Center.

Is St. Edna Sub-Acute and Rehabilitation Center Medicare or Medicaid certified?

Yes — St. Edna Sub-Acute and Rehabilitation Center is a CMS-certified provider of Medicare and Medicaid.

Guides for Better Senior Living

Care Cost Calculator: See Prices in Your Area

Nursing Home Data Explorer

Don’t Wait Too Long: 7 Red Flag Signs Your Parent Needs Assisted Living Now

The True Cost of Assisted Living in 2025 – And How Families Are Paying For It

Understanding Senior Living Costs: Pricing Models, Discounts & Financial Assistance

Explore Open Rooms
1 Contact details
2 What type of senior care service are you looking for?
3 What budget do you have in mind for senior care?
4 How soon do you need to find care?
5 Additional details

Thank you for your interest!

Our team will be in touch shortly to help with next steps.