White Oak Manor Charlotte
Nursing Home, Assisted Living, Independent Living, Memory Care & Nursing Care · Charlotte, NC
CMS overall rating Info CMS (the Centers for Medicare & Medicaid Services) is the federal agency that rates nursing home quality. Its Overall Rating runs from 1 to 5 stars, combining health inspections, staffing, and quality measures, with inspections weighted most heavily.

White Oak Manor Charlotte

Nursing Home, Assisted Living, Independent Living, Memory Care & Nursing Care · Charlotte, NC
CMS overall rating Info CMS (the Centers for Medicare & Medicaid Services) is the federal agency that rates nursing home quality. Its Overall Rating runs from 1 to 5 stars, combining health inspections, staffing, and quality measures, with inspections weighted most heavily.
Calculator: See prices in your area
White Oak Manor Charlotte accepts Medicare, Medicaid, and private pay.

Overview of White Oak Manor Charlotte

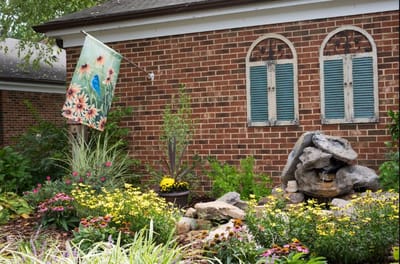
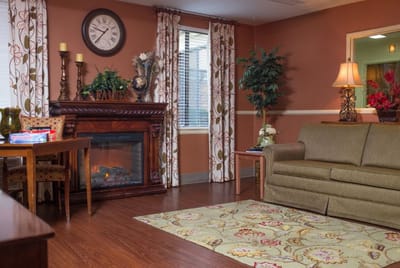
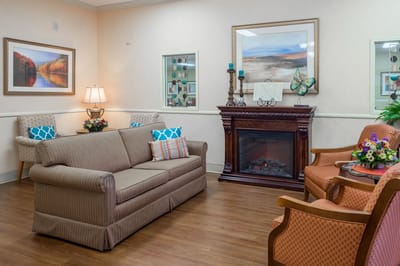
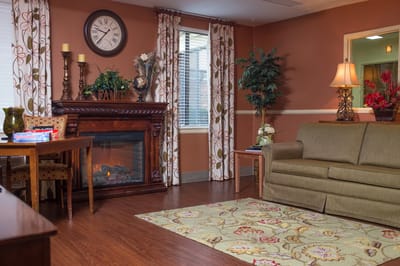
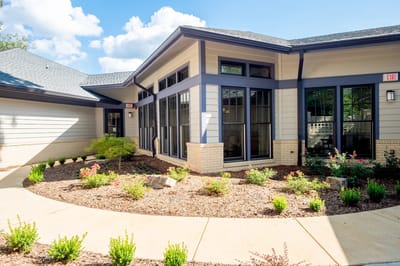
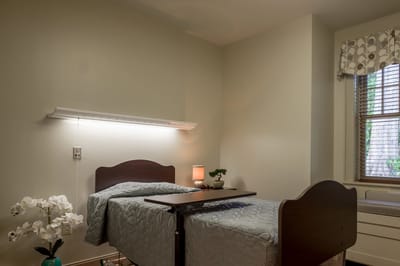
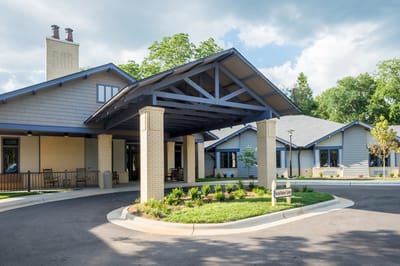
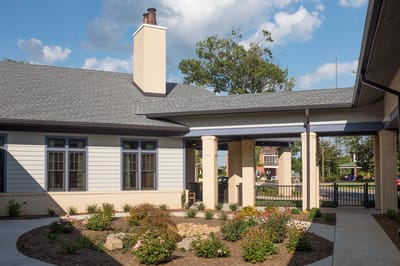
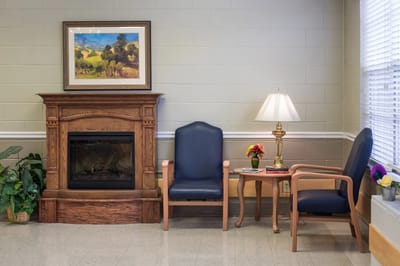
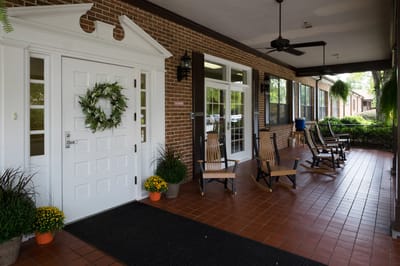
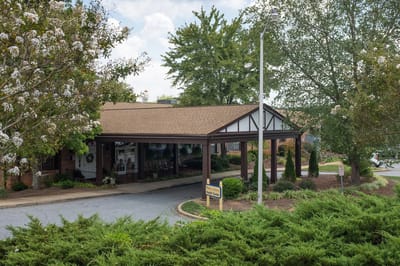
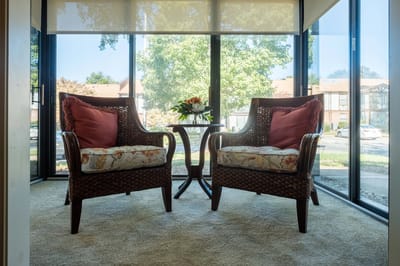
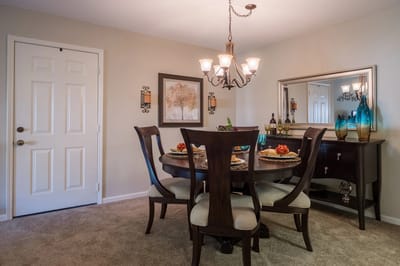
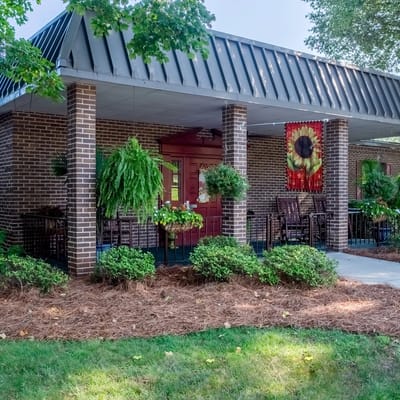
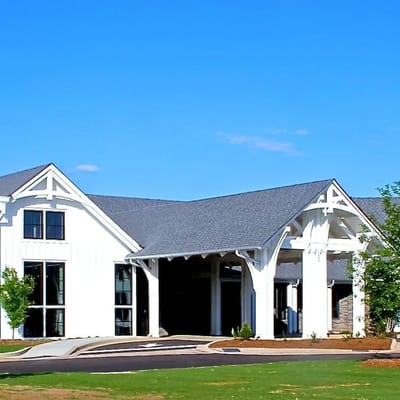
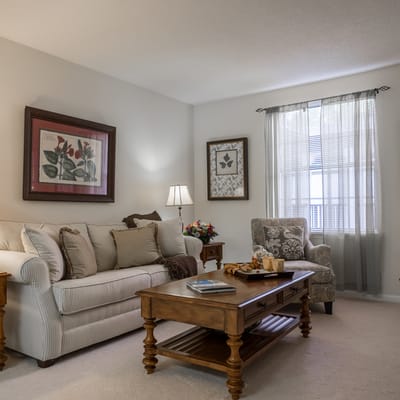
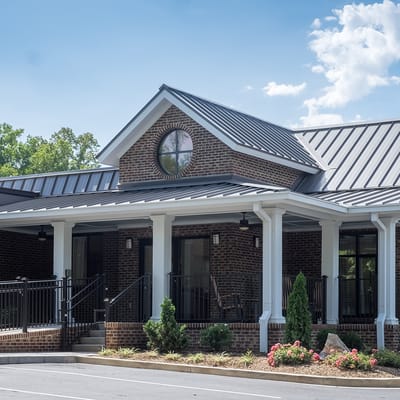
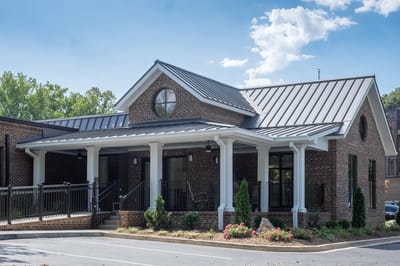
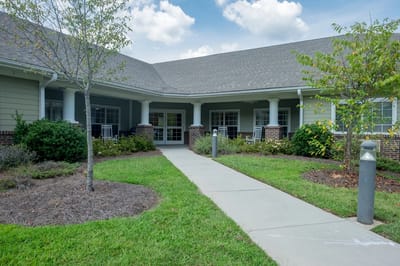
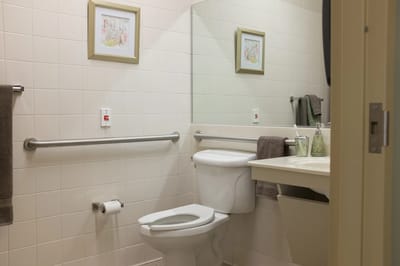
White Oak of Charlotte is a renowned skilled nursing center located in Charlotte, North Carolina. With 180 beds, the center offers comprehensive long-term nursing care and short-term rehabilitation services. Its prime location allows easy access to two major hospital systems in the area, ensuring convenient medical support. The dedicated team at White Oak of Charlotte comprises Registered Nurses, Licensed Practical Nurses, and Certified Nursing Assistants who provide round-the-clock care to residents. 

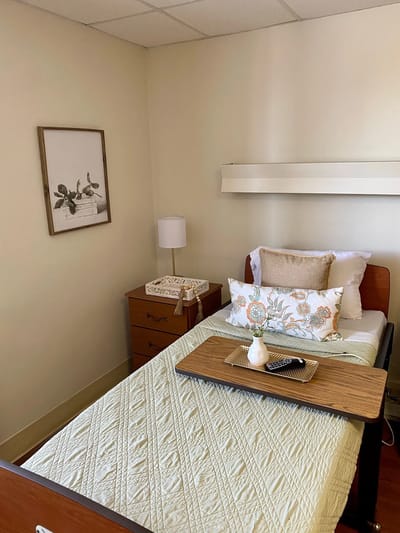
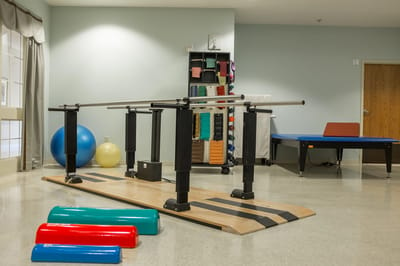
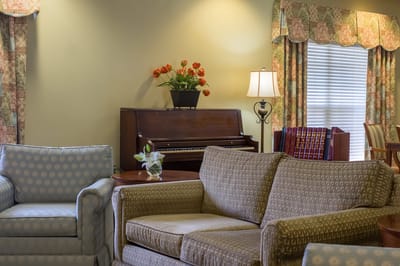
They work collaboratively with physicians to develop personalized care plans, considering the unique needs of each individual. With a focus on resident well-being, White Oak of Charlotte aims to create an environment that fosters comfort and enriches daily experiences. In addition to skilled nursing services, the center also offers independent living apartments at Sharon Village, providing seniors with flexible living options tailored to their preferences and needs.

Quality ratings

Measured by Centers for Medicare & Medicaid Services (CMS)

Overall rating Info The Overall CMS Rating combines results from health inspections, staffing levels and quality measures. Health inspections carry the most weight. Staffing and quality scores can increase or decrease the final rating based on performance compared to state and national standards.
▼ 28.5% Below NC avg. ▼ 28.5% Below NC avg.NC average: 2.8Click the badge to see the full State ranking.Click here to see the full State ranking.
Health Inspection Info Based on the results of the facility's three most recent standard inspections and any complaint investigations. CMS reviews the number, scope, and severity of deficiencies, with more recent findings weighted more heavily.
▼ 64.6% Below NC avg. ▼ 64.6% Below NC avg.NC average: 2.8Click the badge to see the full State ranking.Click here to see the full State ranking.
Staffing Info Measures average nursing staff hours per resident per day, including Registered Nurses (RNs) and total nursing staff. Ratings are adjusted based on the level of care residents require and are compared to state and national benchmarks.
▲ 12.8% Above NC avg. ▲ 12.8% Above NC avg.NC average: 2.7Click the badge to see the full State ranking.Click here to see the full State ranking.
Quality Measures Info Based on clinical and physical health indicators reported to CMS, such as hospital readmissions, falls, pressure ulcers, and improvements in mobility. These measures reflect how well residents' health needs are being managed.
▲ 57.5% Above NC avg. ▲ 57.5% Above NC avg.NC average: 3.2Click the badge to see the full State ranking.Click here to see the full State ranking.

Staffing hours breakdown

Info Daily nursing hours per resident by staff type, reported to CMS. Higher is generally better — compare this facility to state and national averages to see where staffing stands.

Hours per resident per day — compared to North Carolina state averages

Total nursing care / resident Info This home is ranked 52nd out of 97 homes in North Carolina for nurse hours. Total adjusted nursing hours per resident per day, combining RN, LPN, and aide time. CMS adjusts this for case-mix so facilities can be fairly compared.
3h 55m per day
Rank #52 / 97Nurse hours — State benchmarkedThis home is ranked 52nd out of 97 homes in North Carolina. Shows adjusted nurse hours per resident per day benchmarked to the North Carolina average, with a ranking across 97 North Carolina facilities. More hours mean more direct care. The national average is about 3.5 hrs; below 3.0 is a red flag.Rankings are based only on facilities in North Carolina that report data for that category. Facilities without available data are excluded from the ranking.Click the rank badge to see the full State ranking.Click here to see the full State ranking.
This facility North Carolina avg (3h 59m per day)
vs North Carolina avg
-2%

5 of 6 metrics below state avg

Standout metric LPN / LVN is +4% above state avg
Staff typeHours / Day / Residentvs state avg
Registered Nurse (RN) Info RNs hold the highest nursing license and can assess residents, interpret test results, and direct care plans. More RN hours per day often signals stronger clinical oversight and faster response to health changes. 25m per day ▼ 29% State avg: 35m per day · National avg: 41m per day
LPN / LVN Info Licensed Practical Nurses (LPNs) or Licensed Vocational Nurses (LVNs) deliver routine hands-on care — medication administration, wound dressing, and monitoring vital signs. They work under RN supervision and make up a large share of daily bedside care. 54m per day ▲ 4% State avg: 52m per day · National avg: 52m per day
Nurse Aide Info Certified Nurse Aides (CNAs) provide the most direct day-to-day assistance: bathing, dressing, feeding, and mobility. Nurse aide hours are typically the largest staffing category and directly affect residents' quality of life. 2h 9m per day ▼ 7% State avg: 2h 19m per day · National avg: 2h 21m per day
Weekend Total Nursing Info Combined nursing hours (RN + LPN + Nurse Aide) per resident per day on weekends. Staffing often drops on weekends — this figure reveals whether the facility maintains adequate coverage outside of weekday hours. 3h 2m per day ▼ 9% State avg: 3h 20m per day · National avg: 3h 26m per day
Physical Therapist Info Hours per resident per day provided by licensed Physical Therapists (PTs) or PT Assistants. PT services help residents recover mobility after injury or illness and are especially important for post-acute (short-stay) rehabilitation. 2m per day ▼ 62% State avg: 5m per day · National avg: 4m per day
Weekend RN Info Registered nurse hours specifically on weekends. Facilities sometimes reduce RN presence on Saturdays and Sundays — a low weekend RN figure compared to weekday hours can indicate reduced clinical oversight when most administrative staff are absent. 11m per day ▼ 50% State avg: 23m per day · National avg: 29m per day

Capacity and availability

This home usually has availability

Similar occupancy to the North Carolina average: 76.4%
Occupancy rate
75.9% Rank #128 / 271Occupancy rate — State benchmarkedThis home is ranked 128th out of 271 homes in North Carolina. Shows this facility's occupancy rate versus the North Carolina average, with its Statewide rank out of 271. Higher occupancy signals strong local demand and financial stability.Rankings are based only on facilities in North Carolina that report data for that category. Facilities without available data are excluded from the ranking.Click the rank badge to see the full State ranking.Click here to see the full State ranking.
Avg. Length of Stay
152 days
Bed community size
180-bed community Rank #4 / 390Bed count — State benchmarkedThis home is ranked 4th out of 390 homes in North Carolina. Shows this facility's certified or reported bed count compared to other North Carolina facilities. Larger communities may offer more amenities, programs, and on-site services for residents and families.Rankings are based only on facilities in North Carolina that report data for that category. Facilities without available data are excluded from the ranking.Click the rank badge to see the full State ranking.Click here to see the full State ranking.
A large-scale community that may provide a wide range of amenities, services, and structured programs.
Years in operation
42 years in operation
A longer operating history, which may indicate experience navigating regulations and delivering ongoing care.
Walk Score
Walk Score: 24 / 100 Rank #349 / 572Walk Score — State benchmarkedThis home is ranked 349th out of 572 homes in North Carolina. Shows how walkable this facility's neighborhood is compared to the average Walk Score across North Carolina facilities. Higher scores benefit residents, families, and staff.Rankings are based only on facilities in North Carolina that report data for that category. Facilities without available data are excluded from the ranking.Click the rank badge to see the full State ranking.Click here to see the full State ranking.
Car-dependent. Most errands require a car, with limited nearby walkable options.
BBB Rating
BBB Rating: A+ (Not Accredited)
An independent rating from the Better Business Bureau based on factors such as complaint history, transparency, and business practices.
How BBB ratings work

About this community

License Details

CMS Certification Number345238

Safety & Compliance

Secured Perimeter
Emergency SystemsYes
Safety Features24-hour emergency call system

Staffing

Key information about the people who lead and staff this community.

Leadership

ContactMs. Amanda Pack, Owner/Manager

Therapy & Rehabilitation

2 services
Rehabilitation Services
Short-Term Rehab

Staffing & Medical

1 service
24-Hour Staffing

Additional Services

1 service
Home Care

Amenities & Lifestyle

Swimming Pool
Spa
Chapel
Dining Room
Cafe
Garden
Patio
Transportation
Housekeeping
Laundry
Wellness Center
Wellness Program
Branded ProgramsAccelerated Care Plus Program
Specific ProgramsShort Term Rehabilitation
Religious Services
Operating Hours24/7

Contact White Oak Manor Charlotte

Inspection History

In North Carolina, the Department of Health and Human Services, Division of Health Service Regulation conducts unannounced surveys to ensure nursing and adult care homes meet safety standards.

Since 2022 · 4 years of data 25 deficiencies 0 penalties

Inspection Scorecard Info This scorecard compares key inspection, deficiency, and complaint metrics at this facility against the North Carolina state average. Metrics rated ≥15% worse than average are highlighted in red; those ≥15% better are highlighted in green.

Since 2022 vs. North Carolina state average
Overall vs. NC average 0 Worse No metrics in this bucket. 2 Better Metrics better than North Carolina average:
• Total deficiencies (46% below)
• Deficiencies per year (45% below)
Latest Inspection November 18, 2025 Annual Inspection

Deficiencies Info Deficiencies are formal regulatory issues recorded during state inspections.

This FacilityNC Averagevs. NC Avg
Total deficiencies Info Formal regulatory issues recorded by inspectors across all inspection types. 2546 This facility has 46% fewer total deficiencies than a typical North Carolina nursing home (25 vs. NC avg 46).↓ 46% better
Deficiencies per year Info Average deficiencies per year since 2022. 6.311.5 This facility has 45% fewer deficiencies per year than a typical North Carolina nursing home (6.3 vs. NC avg 11.5).↓ 45% better

Inspection Reports Summary Info An editor-reviewed summary of the themes and findings across this facility's recent inspection reports.

  • October 27, 2025 complaint investigation found immediate jeopardy from failure to resume Eliquis anticoagulant therapy, causing pulmonary emboli and hospitalization; immediate jeopardy was removed after corrective actions.
  • November 18, 2025 annual inspection cited two deficiencies including failure to transcribe physician’s verbal blood sugar orders and ineffective pest control with flies and gnats in resident areas.
  • March 27, 2025 annual inspection found five deficiencies including unsafe resident transfers causing a fall, incorrect oxygen delivery, medication storage issues, unclean dishware, and poor hand hygiene during wound care.

Health Inspection History

Inspections since 2022
Total health inspections 4

North Carolina average 4


Last Health inspection on Oct 2025

Total health citations
17 Rank #62 / 101Health citations — State benchmarkedThis home is ranked 62nd out of 101 homes in North Carolina. Shows this facility's total health deficiency citations benchmarked to the North Carolina State average, with a ranking across all 101 NC facilities. Lower citation counts earn a better rank.Rankings are based only on facilities in North Carolina that report data for that category. Facilities without available data are excluded from the ranking.Click the rank badge to see the full State ranking.Click here to see the full State ranking.

North Carolina average 20.9

Citations per inspection
4.25 Rank #52 / 101Citations per inspection — State benchmarkedThis home is ranked 52nd out of 101 homes in North Carolina. Shows average deficiency citations per CMS inspection for this facility versus the North Carolina mean across 101 facilities with citation data. Lower is better.Rankings are based only on facilities in North Carolina that report data for that category. Facilities without available data are excluded from the ranking.Click the rank badge to see the full State ranking.Click here to see the full State ranking.

North Carolina average 4.99


Health citations are formal notices following inspections when they fail to comply with safety and care standards.

8 of 17 citations resulted from standard inspections; 3 of 17 resulted from complaint investigations; and 6 of 17 came from combined inspections (standard and complaint).

Breakdown of citation severity (last 4 years)
Critical health citations
1
23% better than North Carolina average

North Carolina average: 1.3


Serious health citations
0
100% better than North Carolina average

North Carolina average: 0.9

1 critical citation North Carolina average: 1.3

0 serious citations North Carolina average: 0.9

16 moderate citations North Carolina average: 17.1

0 minor citations North Carolina average: 1.6
Citations history (last 4 years)
Nursing Services moderate citation Oct 27, 2025
Corrected

Pharmacy moderate citation Oct 27, 2025
Corrected

Quality of Care critical citation Oct 27, 2025
Corrected

Infection Control moderate citation Mar 27, 2025
Corrected

Staffing Data

Reporting period: October 1 – December 31, 2025 (Q4 2025). Source: CMS Payroll-Based Journal report.

Total staff 168
Employees 152
Contractors 16
Staff to resident ratio 1.11 : 1
39% fewer staff per resident than North Carolina average
North Carolina average ratio: 1.80 : 1 North Carolina average ratio: 1.80 : 1See full North Carolina ranking
Avg staff/day 72
Average shift 8 hours
0% compared with North Carolina average
North Carolina average: 8 hours North Carolina average shift: 8 hoursSee full North Carolina ranking
Total staff hours (quarter) 53,110

Nursing staff breakdown

Q4 2025 · Oct 1 – Dec 31 More info This data comes from the CMS Payroll-Based Journal report covering October 1 – December 31, 2025.
Registered Nurse

Manages medical care and health needs.

RN Staff Info All 11 RN Staff are full-time employees. No contractors work on this role. 11
Average shift length Info Average shift length. Calculated as total hours divided by days worked and average staff per day. 8 hours
Licensed Practical Nurse

Assists with medical care and medications.

LPN Staff Info All 34 LPN Staff are full-time employees. No contractors work on this role. 34
Average shift length Info Average shift length. Calculated as total hours divided by days worked and average staff per day. 8.8 hours
Certified Nursing Assistant

Helps with daily care and mobility.

CNA Staff Info All 84 CNA Staff are full-time employees. No contractors work on this role. 84
Average shift length Info Average shift length. Calculated as total hours divided by days worked and average staff per day. 7.8 hours

Contractor staffing

Q4 2025 · Oct 1 – Dec 31 More info This data comes from the CMS Payroll-Based Journal report covering October 1 – December 31, 2025.

Total hours from contractors

4.4%

2,352 contractor hours this quarter

Qualified Social Worker: 6 Physical Therapy Assistant: 3 Respiratory Therapy Technician: 2 Medical Director: 1 Physical Therapy Aide: 1 Speech Language Pathologist: 1 Administrator: 1 Occupational Therapy Assistant: 1

Staff by category

Q4 2025 · Oct 1 – Dec 31 More info This data comes from the CMS Payroll-Based Journal report covering October 1 – December 31, 2025.
Certified Nursing Assistant8408428,46692100%7.8
Licensed Practical Nurse3403410,79692100%8.8
Registered Nurse110112,96792100%8
Clinical Nurse Specialist7072,1666571%7.9
RN Director of Nursing3031,4187278%8.6
Other Dietary Services Staff3031,04292100%7
Dental Services Staff2029796773%8.4
Medication Aide/Technician3037645762%11.4
Physical Therapy Assistant0335256874%6.2
Dietitian1014886166%8
Occupational Therapy Aide1014645863%8
Mental Health Service Worker1014645863%8
Speech Language Pathologist0114546571%7
Physical Therapy Aide0114485661%8
Nurse Practitioner1014405560%8
Respiratory Therapy Technician0224295964%7.3
Qualified Social Worker0664016470%6.1
Administrator1123684650%8
Medical Director0111833%6
Occupational Therapy Assistant0111422%7
84 Certified Nursing Assistant
% of Days 100%
34 Licensed Practical Nurse
% of Days 100%
11 Registered Nurse
% of Days 100%
7 Clinical Nurse Specialist
% of Days 71%
3 RN Director of Nursing
% of Days 78%
3 Other Dietary Services Staff
% of Days 100%
2 Dental Services Staff
% of Days 73%
3 Medication Aide/Technician
% of Days 62%
3 Physical Therapy Assistant
% of Days 74%
1 Dietitian
% of Days 66%
1 Occupational Therapy Aide
% of Days 63%
1 Mental Health Service Worker
% of Days 63%
1 Speech Language Pathologist
% of Days 71%
1 Physical Therapy Aide
% of Days 61%
1 Nurse Practitioner
% of Days 60%
2 Respiratory Therapy Technician
% of Days 64%
6 Qualified Social Worker
% of Days 70%
2 Administrator
% of Days 50%
1 Medical Director
% of Days 3%
1 Occupational Therapy Assistant
% of Days 2%

Penalties and fines

Federal penalties imposed by CMS for regulatory violations, including civil money penalties (fines) and denials of payment for new Medicare/Medicaid admissions.

Source: CMS Penalties Database

No penalties in the past 3 years

No civil money penalties or payment denials were reported in the last 3 years.

Quality of care over time

These measures show how residents usually do over time at this home, based on health outcomes and preventive care.

High-risk clinical events score Info A composite score based on pressure ulcers, falls with injury, weight loss, walking ability decline, and activities of daily living decline. 7.1
38% better than North Carolina average

North Carolina average: 11.5

Functional decline score Info A composite score based on activities of daily living decline, walking ability decline, and incontinence. 12.9
37% better than North Carolina average

North Carolina average: 20.6

Long-stay resident measures
Above average North Carolina avg: 2.9 Info CMS star rating based on long-stay quality measure performance. 5 stars = significantly above average, 1 star = significantly below average.
Need for Help with Daily Activities Increased Info Percent of long-stay residents whose need for help with daily activities has increased 10.6%
40% better than North Carolina average

North Carolina average: 17.5%

Walking Ability Worsened Info Percent of long-stay residents whose ability to move independently worsened 9.5%
59% better than North Carolina average

North Carolina average: 23.3%

Low Risk Residents with Bowel/Bladder Incontinence Info Percent of low risk long-stay residents who lose control of their bowels or bladder 18.7%
13% better than North Carolina average

North Carolina average: 21.4%

Falls with Major Injury Info Percent of long-stay residents experiencing one or more falls with major injury 4.6%
25% worse than North Carolina average

North Carolina average: 3.6%

High Risk Residents with Pressure Ulcers Info Percent of long-stay high risk residents with pressure ulcers 6.6%
5% worse than North Carolina average

North Carolina average: 6.3%

Urinary Tract Infection Info Percent of long-stay residents with a urinary tract infection 0.6%
78% better than North Carolina average

North Carolina average: 2.6%

Lost Too Much Weight Info Percent of long-stay residents who lose too much weight 4.3%
41% better than North Carolina average

North Carolina average: 7.4%

Depressive Symptoms Info Percent of long-stay residents who have depressive symptoms 1.3%
70% better than North Carolina average

North Carolina average: 4.4%

Antipsychotic Use Info Percent of long-stay residents who received an antipsychotic medication 17.1%
28% worse than North Carolina average

North Carolina average: 13.4%

Pneumococcal Vaccine Info Percent of long-stay residents assessed and appropriately given the pneumococcal vaccine 99.6%
9% better than North Carolina average

North Carolina average: 91.6%

Influenza Vaccine Info Percent of long-stay residents assessed and appropriately given the seasonal influenza vaccine 69.6%
26% worse than North Carolina average

North Carolina average: 94.1%

Hospitalizations per 1,000 days Info Number of hospitalizations per 1,000 long-stay resident days. 2.40
36% worse than North Carolina average

North Carolina average: 1.77

ED visits per 1,000 days Info Number of outpatient emergency department visits per 1,000 long-stay resident days. 1.06
42% better than North Carolina average

North Carolina average: 1.82

Short-stay resident measures
Significantly above average North Carolina avg: 2.9 Info CMS star rating based on short-stay quality measure performance. 5 stars = much above average, 1 star = much below average.
Pneumococcal Vaccine Info Percent of short-stay residents assessed and appropriately given the pneumococcal vaccine 96.9%
21% better than North Carolina average

North Carolina average: 79.9%

Antipsychotic medication increase Info Percent of short-stay residents who newly received an antipsychotic medication 2.2%
47% worse than North Carolina average

North Carolina average: 1.5%

Influenza Vaccine Info Percent of short-stay residents assessed and appropriately given the seasonal influenza vaccine 70.1%
10% worse than North Carolina average

North Carolina average: 78.1%

Re-hospitalized after SNF stay Info Percentage of short-stay residents who were re-hospitalized after their nursing home admission. 16.3%
29% better than North Carolina average

North Carolina average: 22.9%

Emergency department visits Info Percentage of short-stay residents who had an outpatient emergency department visit. 2.4%
82% better than North Carolina average

North Carolina average: 13.2%

Falls with major injury Info Percentage of SNF residents who experience falls with major injury during their stay. 2.9%
282% worse than North Carolina average

North Carolina average: 0.8%

Ability to care for self at discharge Info Percentage of residents at or above expected ability to care for themselves at discharge. 61.9%
15% better than North Carolina average

North Carolina average: 53.7%

Successful return to home or community Info Rate of successful return to home or community from a skilled nursing facility. 45.5%
10% worse than North Carolina average

North Carolina average: 50.6%

Breakdown by payment type

Medicare

22% of new residents, usually for short-term rehab.

Typical stay 21 days

Private pay

70% of new residents, often for short stays.

Typical stay 2 - 3 months

Medicaid

9% of new residents, often for long-term daily care.

Typical stay 2 - 3 years

Facility Characteristics

Source: CMS Long-Term Care Facility Characteristics (Data as of Jan 2026)

Total residents 152
Medicare
6
3.9% of residents
Medicaid
81
53.3% of residents
Private pay or other
65
42.8% of residents
Programs & Services
Residents Group

Residents meet regularly to discuss policies, care quality, and activities

Active Resident Council

Organized group of residents that meets regularly to discuss facility policies, quality of life, and activities.

Finances and operations

Based on CMS SNF Cost Report for fiscal year ending in 09/2023.

For-profit
LLC
Net patient revenue Info Net patient revenue — what the home actually collects for resident care, after contractual allowances, bad debt and discounts are subtracted from its gross charges (CMS cost report, Worksheet G-3). It covers resident care only; money the home earns from other sources is shown separately as "Other income."
$14.6M
Net patient income Info Net patient income: net patient revenue minus the home's total operating expenses. A positive figure means it earns more from resident care than it spends to deliver it; a negative figure means the opposite. It excludes non-operating "other income."
$916.9K
For-profit LLC
Net patient revenue Info Net patient revenue — what the home actually collects for resident care, after contractual allowances, bad debt and discounts are subtracted from its gross charges (CMS cost report, Worksheet G-3). It covers resident care only; money the home earns from other sources is shown separately as "Other income."
$14.6M Rank #48 / 104Revenue — State benchmarkedThis home is ranked 48th out of 104 homes in North Carolina. Shows this facility's annual revenue compared to the North Carolina average. Higher revenue generally means more resources for staffing and capital — read alongside Payroll %.Rankings are based only on facilities in North Carolina that report data for that category. Facilities without available data are excluded from the ranking.Click the rank badge to see the full State ranking.Click here to see the full State ranking.
Net patient income Info Net patient income: net patient revenue minus the home's total operating expenses. A positive figure means it earns more from resident care than it spends to deliver it; a negative figure means the opposite. It excludes non-operating "other income."
$916.9K
Other income Info Money the home earns outside of resident care — such as investments, grants, rentals and other non-operating sources (CMS cost report, Worksheet G-3). It is tracked separately from net patient revenue: it is not part of that figure, and it is not included in net patient income.
-$851.5K
Payroll costs Info Staff salaries plus wage-related costs — benefits such as payroll taxes, health insurance and retirement — from the home's own accounting records (CMS cost report, Worksheet A). Contract or agency labor is counted separately, under other operating costs. Rank #31 / 104Payroll — State benchmarkedThis home is ranked 31st out of 104 homes in North Carolina. Shows total annual staff payroll benchmarked to the North Carolina average. Higher payroll investment relative to peers often signals better staffing and less reliance on cheaper contract labor.Rankings are based only on facilities in North Carolina that report data for that category. Facilities without available data are excluded from the ranking.Click the rank badge to see the full State ranking.Click here to see the full State ranking.
$9.3M 63.7% of net patient revenue Info Payroll as a share of revenue: staff salaries and wage-related benefits divided by net patient revenue. A higher figure means more of each revenue dollar goes to staff pay. Rank #12 / 104Payroll % — State benchmarkedThis home is ranked 12th out of 104 homes in North Carolina. Shows payroll as a percentage of revenue versus the North Carolina average. Well-run North Carolina facilities typically land around 49–62% — the top third Statewide. Below 25% may signal understaffing or heavy agency use — read with Staffing ratings.Rankings are based only on facilities in North Carolina that report data for that category. Facilities without available data are excluded from the ranking.Click the rank badge to see the full State ranking.Click here to see the full State ranking.
Other operating costs Info Everything it costs to run the home apart from payroll — food, utilities, supplies, maintenance, contract labor and administration. Calculated as total operating expense minus payroll (staff salaries and wage-related benefits).
$4.4M
Total costs Info The home's total operating expense for the year — all the costs of running it, salaries included (CMS cost report, Worksheet G-3).
$13.7M

Who this home usually serves

TYPE OF STAY

Primarily short stays

Residents typically stay for brief periods, with frequent admissions and discharges throughout the year.

Most new residents arrive under private pay (70% of admissions), and a typical private pay stay runs around 2 - 3 months.

Admissions
351 total

Coverage residents most often arrive under.

Medicare 22%
Private pay 70%
Medicaid 9%
Discharges
327 total

Coverage residents most often leave under.

Medicare 14%
Private pay 68%
Medicaid 18%

Places of interest near White Oak Manor Charlotte

Address 4009 Craig Ave, Charlotte, NC 28211 — 2.94 miles to nearest hospital (Novant Health Presbyterian Medical Center : Cancer Center)

Calculate Travel Distance to White Oak Manor Charlotte

Add your location

Address

Compare Nursing Homes around Charlotte

The information below is reported by the North Carolina Department of Health and Human Services, Division of Health Service Regulation.

5 facilities compared · CMS & NC Dept. of Health data

Brookdale Carriage Club Providence
NH
AL
IL
MC
Charlotte (Olde Providence North)
77
Facility 77
NC AVG 72
Rank #168 / 390
71.5%
Facility 71.5%
NC AVG 76.4%
Rank #145 / 271
-6%
8.12
Facility 8.12
NC AVG 3.98
Rank #4 / 97
+78%+104%
$0
Facility $0
NC AVG $74.6k
Rank #1 / 105
11
Facility 11
NC AVG 20.9
Rank #39 / 101
3.7
Facility 3.7
NC AVG 5.0
Rank #43 / 101
-7A+
12
Facility 12
NC AVG 33
Rank #440 / 572
Bkd Fm Holding Company LLC
$19.6M
Facility $19.6M
NC AVG $13.2M
Rank #99 / 104
$8.1M
Facility $8.1M
NC AVG $4.9M
Rank #39 / 104
41.6%
Facility 41.6%
NC AVG 39.8%
Rank #1 / 104
345482
White Oak Manor Charlotte
NH
AL
IL
MC
NC
Charlotte (Cotswold)
180
Facility 180
NC AVG 72
Rank #4 / 390
75.9%
Facility 75.9%
NC AVG 76.4%
Rank #128 / 271
-1%
3.91
Facility 3.91
NC AVG 3.98
Rank #52 / 97
-29%-2%
$85.7k
Facility $85.7k
NC AVG $74.6k
Rank #91 / 105
17
Facility 17
NC AVG 20.9
Rank #62 / 101
4.3
Facility 4.3
NC AVG 5.0
Rank #52 / 101
1147A+
24
Facility 24
NC AVG 33
Rank #349 / 572
Hayden Keziah
$14.6M
Facility $14.6M
NC AVG $13.2M
Rank #48 / 104
$9.3M
Facility $9.3M
NC AVG $4.9M
Rank #31 / 104
63.7%
Facility 63.7%
NC AVG 39.8%
Rank #12 / 104
345238
University Place Nursing & Rehabilitation
NH
MC
Charlotte (University City North)
207
Facility 207
NC AVG 72
Rank #3 / 390
68.1%
Facility 68.1%
NC AVG 76.4%
Rank #158 / 271
-11%
4.12
Facility 4.12
NC AVG 3.98
Rank #39 / 97
-37%+4%
$276.4k
Facility $276.4k
NC AVG $74.6k
Rank #103 / 105
35
Facility 35
NC AVG 20.9
Rank #87 / 101
5.0
Facility 5.0
NC AVG 5.0
Rank #67 / 101
2158A+
29
Facility 29
NC AVG 33
Rank #321 / 572
-
$17.2M
Facility $17.2M
NC AVG $13.2M
Rank #40 / 104
$7.1M
Facility $7.1M
NC AVG $4.9M
Rank #32 / 104
41.5%
Facility 41.5%
NC AVG 39.8%
Rank #21 / 104
345142
The Cypress of Charlotte
NH
AL
HC
IL
MC
Charlotte (Beverly Woods)
65
Facility 65
NC AVG 72
Rank #210 / 390
78.2%
Facility 78.2%
NC AVG 76.4%
Rank #121 / 271
+2%- +26%-
$58.0k
Facility $58.0k
NC AVG $74.6k
Rank #83 / 105
14
Facility 14
NC AVG 20.9
Rank #50 / 101
4.7
Facility 4.7
NC AVG 5.0
Rank #58 / 101
258-
15
Facility 15
NC AVG 33
Rank #414 / 572
The Cypress Of Charlotte LLC
$7.3M
Facility $7.3M
NC AVG $13.2M
Rank #14 / 104
$14.1M
Facility $14.1M
NC AVG $4.9M
Rank #20 / 104
194.2%
Facility 194.2%
NC AVG 39.8%
Rank #79 / 104
345495
Myers Park Nursing Center
NH
Charlotte (Myers Park)
133
Facility 133
NC AVG 72
Rank #22 / 390
66.9%
Facility 66.9%
NC AVG 76.4%
Rank #165 / 271
-12%
11.47
Facility 11.47
NC AVG 3.98
Rank #1 / 97
-67%+188%
$432.6k
Facility $432.6k
NC AVG $74.6k
Rank #105 / 105
55
Facility 55
NC AVG 20.9
Rank #101 / 101
5.0
Facility 5.0
NC AVG 5.0
Rank #67 / 101
1489A+
83
Facility 83
NC AVG 33
Rank #2 / 572
Mc M53 Spe Opco Holdco
$10.4M
Facility $10.4M
NC AVG $13.2M
Rank #84 / 104
$3.1M
Facility $3.1M
NC AVG $4.9M
Rank #83 / 104
29.8%
Facility 29.8%
NC AVG 39.8%
Rank #32 / 104
345008

Financial Assistance for
Nursing Home in North Carolina

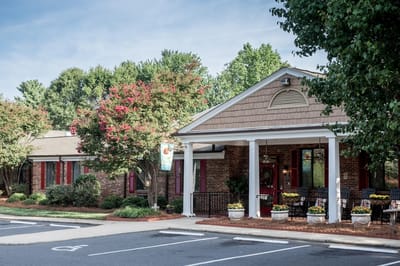
White Oak Manor Charlotte is located in Charlotte, North Carolina.
Here are the financial assistance programs available to residents in North Carolina.

Get Financial aid guidance

Community Alternatives Program for Disabled Adults

NC Medicaid CAP/DA

Age 65+ or disabled
General North Carolina resident, Medicaid- eligible, nursing home-level care need.
Income Limits (2025) ~$2,829/month 300% FBR, individual
Asset Limits $2,000 (individual), $3,000 (couple).
NC

High demand; waitlists common in urban areas.

Benefits
Personal care (5-7 hours/day) Respite (240 hours/year) Adult day care ($60/day) Home modifications ($1,500 avg.)

North Carolina Senior Care Options

NC SCO (via NFCSP)

Age Caregiver of someone 60+ (or with dementia)
General North Carolina resident.
Income Limits No strict limit; prioritizes low-income.
Asset Limits Not applicable.
NC

Limited slots; rural/urban balance.

Benefits
In-home respite (4-6 hours/day) Adult day care (~$60/day) Short-term facility care (up to 5 days)

Program of All-Inclusive Care for the Elderly (PACE)

North Carolina PACE (e.g., PACE of the Triad)

Age 55+
General NC resident (specific counties), NFLOC, safe with PACE support.
Income Limits (2025) ~$2,829/month (Medicaid-eligible); private pay option available.
Asset Limits $2,000 (individual), $3,000 (couple) for Medicaid enrollees.
NC

Available in 10+ counties (e.g., Guilford, Wake); multiple providers (e.g., PACE of the Southern Piedmont).

Benefits
Personal care (5-7 hours/day) Medical care Meals Transportation Respite Therapies

In-Home Aide Services

North Carolina In-Home Aide Services

Age 60+
General NC resident, unable to perform 1+ ADL, at risk of nursing home placement.
Income Limits (2025) No strict cap; prioritizes low-income ~$24,980/year
Asset Limits Not assessed; need-based.
NC

Family can be aides; varies by county funding.

Benefits
Personal care (5-20 hours/week) Meal prep Respite (~5 days/year) Errands

Medicare Savings Program (MSP)

North Carolina Medicare Savings Program

Age 65+ or disabled
General NC resident, Medicare Part A/B.
Income Limits (2025) ~$2,510/month (QMB), ~$3,380/month (SLMB), ~$3,598/month (QI)—individual.
Asset Limits $9,430 (individual), $14,130 (couple).
NC

Three tiers; no waitlist; includes Extra Help for Part D.

Benefits
Covers Part B premiums ($174.70/month) Deductibles ($240/year) Copays (~20%)

VA Aid and Attendance (A&A) and Housebound Benefits

North Carolina VA Aid and Attendance/Housebound

Age 65+ or disabled veteran/spouse
General NC resident, wartime service, need for ADL help (A&A) or homebound.
Income Limits (2025) Net income < ~$1,984/month (veteran with dependent, A&A); pension offsets income.
Asset Limits ~$155,356 net worth limit
NC

High veteran demand in rural/urban areas.

Benefits
Cash (~$1,433-$2,642/month veteran, ~$951-$1,318 spouse) for care costs (e.g., in-home, assisted living)

Urgent Repair Program (URP)

North Carolina Urgent Repair Program

Age 60+ prioritized
General NC resident, homeowner, low-income.
Income Limits (2025) ~$30,258/year 50% AMI, varies by county
Asset Limits Not strictly assessed; home value considered.
NC

Forgivable at $2,000/year; statewide via local partners.

Benefits
Repairs (~$8,000-$12,000 avg.) for safety (e.g., roofs, heating, accessibility)

State/County Special Assistance (SA)

North Carolina Special Assistance

Age 65+ (or disabled)
General NC resident, in licensed adult care home, low-income.
Income Limits (2025) ~$1,255/month (individual, 100% FPL); varies by facility rate.
Asset Limits $2,000 individual
NC

Covers assisted living; counties supplement state funds.

Benefits
Cash (~$1,200-$1,500/month) for room/board; Medicaid covers care services

Frequently Asked Questions about White Oak Manor Charlotte

What neighborhood is White Oak Manor Charlotte in?

White Oak Manor Charlotte is in the Cotswold neighborhood of Charlotte.

Is White Oak Manor Charlotte in a walkable area?

White Oak Manor Charlotte has a walk score of 24. Car-dependent. Most errands require a car, with limited nearby walkable options.

What is the occupancy rate at White Oak Manor Charlotte?

White Oak Manor Charlotte's occupancy is 75.9%.

Does White Oak Manor Charlotte operate as a for-profit or non-profit?

White Oak Manor Charlotte is registered as a for-profit in NC.

Are there photos of White Oak Manor Charlotte?

Yes — there are 74 photos of White Oak Manor Charlotte in the photo gallery on this page.

What is the address of White Oak Manor Charlotte?

White Oak Manor Charlotte is located at 4009 Craig Ave, Charlotte, NC 28211.

What is the phone number of White Oak Manor Charlotte?

(704) 365-2620 will put you in contact with the team at White Oak Manor Charlotte.

Guides for Better Senior Living

Care Cost Calculator: See Prices in Your Area

Nursing Home Data Explorer

Don’t Wait Too Long: 7 Red Flag Signs Your Parent Needs Assisted Living Now

The True Cost of Assisted Living in 2025 – And How Families Are Paying For It

Understanding Senior Living Costs: Pricing Models, Discounts & Financial Assistance