


Total staff
95
Employees
66
Contractors
29
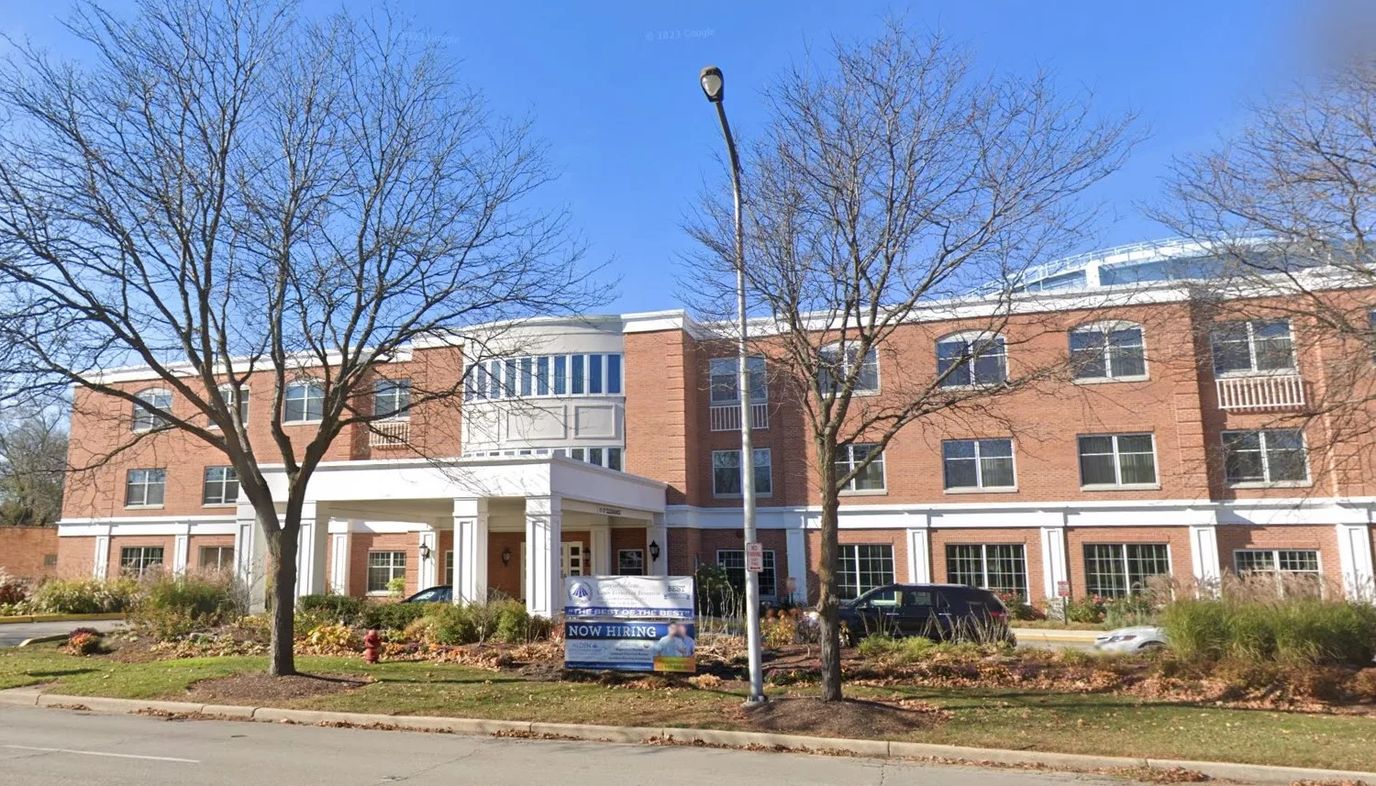
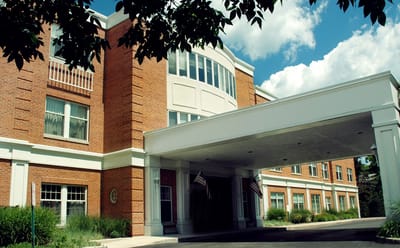


Located on Gross Point Road, Alden Estates of Evanston Rehabilitation and Post Acute Health Care is a 99-bed nursing home in Evanston, Illinois, that specializes in post-acute and rehabilitation services. Its average length of stay is 43 days, with most residents staying temporarily while recovering from surgery, illness, or hospitalization before returning home. Owned by Joshua Molitor, the community also accepts Medicare, Medicaid, and private-pay residents. 24-hour staffing is also available to provide support and care.
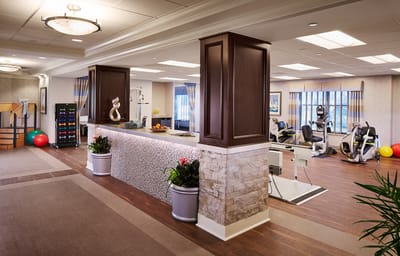
A multidisciplinary clinical team delivers a range of rehabilitation services, including orthopedic, cardiac, NeuroStroke, and pulmonary programs. Furthermore, contracted speech-language pathologists, physical therapy assistants and aides, respiratory therapy technicians, and an occupational therapy aide work alongside nursing staff to support recovery goals. An average of 1 hour and 4 minutes of RN care is also provided daily, while total nursing care averages 2 hours and 59 minutes per day. A Nurse Practitioner, Clinical Nurse Specialist, Mental Health Service Worker, and Dietitian also oversee care.
The community combines rehabilitation services with amenities designed to enhance daily life for older adults. Restaurant-style dining also includes four-course meals at lunch and dinner. Amenities such as an ice cream parlor, aviary, hair and nail salon, complimentary Wi-Fi, and daily newspaper delivery are also available. Residents also have access to a council that meets regularly to discuss care and community matters. For visiting family and friends, the surrounding area offers a walkability score of 70 out of 100, making nearby errands accessible on foot.
| Staff type | Hours / Day / Resident | vs state avg |
|---|---|---|
|
Registered Nurse (RN)
| 1h 4m per day | ▲ 46% State avg: 44m per day · National avg: 41m per day |
|
LPN / LVN
| 46m per day | ▲ 22% State avg: 38m per day · National avg: 52m per day |
|
Nurse Aide
| 2h 2m per day | ▼ 5% State avg: 2h 8m per day · National avg: 2h 21m per day |
|
Weekend Total Nursing
| 3h 22m per day | ▲ 9% State avg: 3h 5m per day · National avg: 3h 26m per day |
|
Physical Therapist
| 13m per day | ▲ 327% State avg: 3m per day · National avg: 4m per day |
|
Weekend RN
| 43m per day | ▲ 26% State avg: 34m per day · National avg: 29m per day |
Reporting period: October 1 – December 31, 2025 (Q4 2025). Source: CMS Payroll-Based Journal report.
Manages medical care and health needs.
Assists with medical care and medications.
Helps with daily care and mobility.
Total hours from contractors
4,465 contractor hours this quarter
| Certified Nursing Assistant | 31 | 0 | 31 | 12,018 | 92 | 100% | 7.7 |
| Registered Nurse | 15 | 0 | 15 | 5,419 | 92 | 100% | 7.6 |
| Licensed Practical Nurse | 10 | 0 | 10 | 4,569 | 92 | 100% | 8 |
| Other Dietary Services Staff | 4 | 0 | 4 | 1,622 | 92 | 100% | 7.3 |
| Respiratory Therapy Technician | 0 | 5 | 5 | 1,262 | 88 | 96% | 7.1 |
| Speech Language Pathologist | 0 | 10 | 10 | 1,191 | 87 | 95% | 6.7 |
| Physical Therapy Aide | 0 | 5 | 5 | 1,062 | 72 | 78% | 7.8 |
| Physical Therapy Assistant | 0 | 5 | 5 | 542 | 72 | 78% | 7.3 |
| Administrator | 1 | 0 | 1 | 472 | 59 | 64% | 8 |
| Nurse Practitioner | 1 | 0 | 1 | 461 | 60 | 65% | 7.7 |
| Dental Services Staff | 1 | 0 | 1 | 443 | 60 | 65% | 7.4 |
| Clinical Nurse Specialist | 1 | 0 | 1 | 429 | 56 | 61% | 7.7 |
| Dietitian | 1 | 0 | 1 | 372 | 52 | 57% | 7.2 |
| Qualified Social Worker | 0 | 1 | 1 | 216 | 56 | 61% | 3.9 |
| Occupational Therapy Aide | 0 | 1 | 1 | 167 | 23 | 25% | 7.3 |
| Mental Health Service Worker | 1 | 0 | 1 | 73 | 10 | 11% | 7.3 |
| Medical Director | 0 | 1 | 1 | 18 | 15 | 16% | 1.2 |
| Qualified Activities Professional | 0 | 1 | 1 | 7 | 1 | 1% | 6.5 |
Federal penalties imposed by CMS for regulatory violations, including civil money penalties (fines) and denials of payment for new Medicare/Medicaid admissions.
Source: CMS Penalties Database
No penalties in the past 3 years
No civil money penalties or payment denials were reported in the last 3 years.
These measures show how residents usually do over time at this home, based on health outcomes and preventive care.
Illinois average: 9.7
Illinois average: 18.6
Illinois average: 15.5%
Illinois average: 18.4%
Illinois average: 21.6%
Illinois average: 3.4%
Illinois average: 5.3%
Illinois average: 1.8%
Illinois average: 6.5%
Illinois average: 48.1%
Illinois average: 20.2%
Illinois average: 89.2%
Illinois average: 91.6%
Illinois average: 2.05
Illinois average: 2.25
Illinois average: 68.3%
Illinois average: 2.3%
Illinois average: 63.0%
Illinois average: 26.2%
Illinois average: 14.0%
Illinois average: 0.8%
Illinois average: 53.7%
Illinois average: 50.6%
Quality measures are calculated from Minimum Data Set (MDS) assessments. For most measures, lower percentages indicate better care quality.
36% of new residents, usually for short-term rehab.
54% of new residents, often for short stays.
11% of new residents, often for long-term daily care.
Source: CMS Long-Term Care Facility Characteristics (Data as of Jan 2026)
Residents meet regularly to discuss policies, care quality, and activities
Organized group of residents that meets regularly to discuss facility policies, quality of life, and activities.
Data sourced from CMS Long-Term Care Facility Characteristics quarterly report. Payer mix reflects the current resident census by primary payment source.
Historical financial and operational data for Alden Estates of Evanston Rehabilitation and Post Acute Health Care from 2011–2023, based on CMS SNF Cost Reports.
Key figures below are for fiscal year ending in 12/2023.
Based on CMS SNF Cost Report for fiscal year ending in 12/2023.
This home supports both short-term rehab and long-term care, with residents staying for a wide range of durations.
Most new residents arrive under private pay (54% of admissions), and a typical private pay stay runs around 1 - 2 months.
Coverage residents most often arrive under.
Coverage residents most often leave under.
![]() 2.2 miles from city center
2.2 miles from city center
![]() Estimated distance in miles from Evanston's city center to Alden Estates of Evanston Rehabilitation and Post Acute Health Care's address, calculated via Google Maps.
— 6.76 miles to nearest hospital (Resurrection Medical Center - Emergency Fast Track)
Estimated distance in miles from Evanston's city center to Alden Estates of Evanston Rehabilitation and Post Acute Health Care's address, calculated via Google Maps.
— 6.76 miles to nearest hospital (Resurrection Medical Center - Emergency Fast Track)
Add your location
Info below is compiled from CMS reports & the IL Dept. of Public Health (IDPH), senior community websites & trusted data sources such as Walk Score & BBB.
Communities are listed from highest to lowest based on our ranking methodology.
| The Mather | NH AL IL MC SNF | Evanston (Davis Street) | 22
Facility
22
IL AVG
85
Rank
#394 / 419 | - | - | 5.88
Facility
5.88
IL AVG
3.10
Rank
#5 / 155 | +102% | +90% | $0
Facility
$0
IL AVG
$151.3k
Rank
#1 / 155 | 7
Facility
7
IL AVG
36.8
Rank
#5 / 155 | 3.5
Facility
3.5
IL AVG
3.7
Rank
#72 / 155 | - | 30 | - |
95
Facility
95
IL AVG
51
Rank
#18 / 648 | Mather Senior Living Communities LLC | $24.7MFiscal year ending 12/2023
Facility
$24.7MFiscal year ending 12/2023
IL AVG
$12.2M
Rank
#38 / 154 | $10.8MFiscal year ending 12/2023
Facility
$10.8MFiscal year ending 12/2023
IL AVG
$4.8M
Rank
#28 / 154 | 43.6%Fiscal year ending 12/2023
Facility
43.6%Fiscal year ending 12/2023
IL AVG
44.3%
Rank
#79 / 154 | 146145 | ||||
| Westminster Place | NH AL IL MC RC SNF | Evanston (Grant Street) | 105
Facility
105
IL AVG
85
Rank
#112 / 419 |
57.0%
Facility
57.0%
IL AVG
73
Rank
#134 / 157 | -22% | 5.50
Facility
5.50
IL AVG
3.10
Rank
#9 / 155 | +47% | +77% | $0
Facility
$0
IL AVG
$151.3k
Rank
#1 / 155 | 7
Facility
7
IL AVG
36.8
Rank
#5 / 155 | 2.3
Facility
2.3
IL AVG
3.7
Rank
#14 / 155 | - | 60 | - |
44
Facility
44
IL AVG
51
Rank
#392 / 648 | Presbyterian Homes | $26.3MFiscal year ending 03/2024
Facility
$26.3MFiscal year ending 03/2024
IL AVG
$12.2M
Rank
#2 / 154 | $15.3MFiscal year ending 03/2024
Facility
$15.3MFiscal year ending 03/2024
IL AVG
$4.8M
Rank
#8 / 154 | 58.2%Fiscal year ending 03/2024
Facility
58.2%Fiscal year ending 03/2024
IL AVG
44.3%
Rank
#150 / 154 | 145026 | ||||
| Alden Estates of Evanston Rehabilitation and Post Acute Health Care | NH SNF | Evanston | 99
Facility
99
IL AVG
85
Rank
#121 / 419 |
64.8%
Facility
64.8%
IL AVG
73
Rank
#116 / 157 | -11% | 2.99
Facility
2.99
IL AVG
3.10
Rank
#71 / 155 | +11% | -4% | $0
Facility
$0
IL AVG
$151.3k
Rank
#1 / 155 | 9
Facility
9
IL AVG
36.8
Rank
#11 / 155 | 3.0
Facility
3.0
IL AVG
3.7
Rank
#40 / 155 | - | 64 | - |
70
Facility
70
IL AVG
51
Rank
#153 / 648 | Joshua Molitor | $11.6MFiscal year ending 12/2023
Facility
$11.6MFiscal year ending 12/2023
IL AVG
$12.2M
Rank
#107 / 154 | $5.6MFiscal year ending 12/2023
Facility
$5.6MFiscal year ending 12/2023
IL AVG
$4.8M
Rank
#115 / 154 | 48.3%Fiscal year ending 12/2023
Facility
48.3%Fiscal year ending 12/2023
IL AVG
44.3%
Rank
#77 / 154 | 145907 | ||||
| Dobson Plaza Rehabilitation and Healthcare | NH PC RC SNF | Evanston (Dodge Avenue) | 97
Facility
97
IL AVG
85
Rank
#128 / 419 |
86.5%
Facility
86.5%
IL AVG
73
Rank
#44 / 157 | +18% | 2.39
Facility
2.39
IL AVG
3.10
Rank
#128 / 155 | +45% | -23% | $0
Facility
$0
IL AVG
$151.3k
Rank
#1 / 155 | 16
Facility
16
IL AVG
36.8
Rank
#24 / 155 | 5.3
Facility
5.3
IL AVG
3.7
Rank
#138 / 155 | 1 | 84 | A+ |
74
Facility
74
IL AVG
51
Rank
#135 / 648 | Charlotte Kohn | $8.3M*Fiscal year ending 12/2021These figures are from this home's most recent complete cost report — an older period than most facilities report. Compare with that in mind.
Facility
$8.3M*Fiscal year ending 12/2021These figures are from this home's most recent complete cost report — an older period than most facilities report. Compare with that in mind.
IL AVG
$12.2M
Rank
#154 / 154 | $3.7M*Fiscal year ending 12/2021These figures are from this home's most recent complete cost report — an older period than most facilities report. Compare with that in mind.
Facility
$3.7M*Fiscal year ending 12/2021These figures are from this home's most recent complete cost report — an older period than most facilities report. Compare with that in mind.
IL AVG
$4.8M
Rank
#135 / 154 | 45.1%*Fiscal year ending 12/2021These figures are from this home's most recent complete cost report — an older period than most facilities report. Compare with that in mind.
Facility
45.1%*Fiscal year ending 12/2021These figures are from this home's most recent complete cost report — an older period than most facilities report. Compare with that in mind.
IL AVG
44.3%
Rank
#1 / 154 | 145122 | ||||
| Three Crowns Park | NH AL MC RC SNF | Evanston (Mcdaniel Avenue) | 18
Facility
18
IL AVG
85
Rank
#398 / 419 | - | - | 7.33
Facility
7.33
IL AVG
3.10
Rank
#2 / 155 | +68% | +137% | $0
Facility
$0
IL AVG
$151.3k
Rank
#1 / 155 | 2
Facility
2
IL AVG
36.8
Rank
#1 / 155 | 1.0
Facility
1.0
IL AVG
3.7
Rank
#1 / 155 | 1 | 25 | - |
68
Facility
68
IL AVG
51
Rank
#163 / 648 | Three Crowns Park | - | - | - | 146199 |
Alden Estates of Evanston Rehabilitation and Post Acute Health Care is located in Evanston, Illinois.
Here are the financial assistance programs available to residents in Illinois.
Alden Estates of Evanston Rehabilitation and Post Acute Health Care has a walk score of 70. Very walkable. Most errands can be accomplished on foot, and many essentials are within a short walk.
Alden Estates of Evanston Rehabilitation and Post Acute Health Care's occupancy is 61.3%.
No, Alden Estates of Evanston Rehabilitation and Post Acute Health Care has a no-pet policy.
Alden Estates of Evanston Rehabilitation and Post Acute Health Care is registered as a for-profit.
Yes — there are 13 photos of Alden Estates of Evanston Rehabilitation and Post Acute Health Care in the photo gallery on this page.
Alden Estates of Evanston Rehabilitation and Post Acute Health Care is located at 2520 Gross Point Rd, Evanston, IL 60201.
(847) 328-6000 will put you in contact with the team at Alden Estates of Evanston Rehabilitation and Post Acute Health Care.
Care Cost Calculator: See Prices in Your Area
Nursing Home Data Explorer
Don’t Wait Too Long: 7 Red Flag Signs Your Parent Needs Assisted Living Now
The True Cost of Assisted Living in 2025 – And How Families Are Paying For It
Understanding Senior Living Costs: Pricing Models, Discounts & Financial Assistance


