Explore Open Rooms

1 Contact details
2 What type of senior care service are you looking for?
3 What budget do you have in mind for senior care?
4 How soon do you need to find care?
5 Additional details

Thank you for your interest!

Our team will be in touch shortly to help with next steps.

Nursing Home

Sandstone Bountiful

Nursing Home

Sandstone Bountiful

523 N Main St, Bountiful, UT 84010 View map
Overview of Sandstone Bountiful

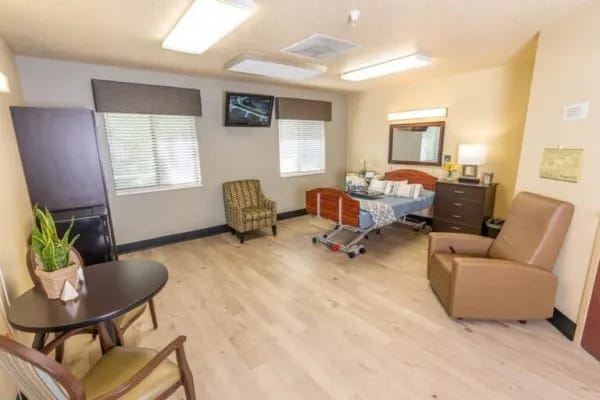
Sandstone Bountiful is where life balances with style– creating an unmatched experience for seniors. In the premier skilled nursing facility with rehabilitative care, residents will find endless possibilities that await; they continue to maintain a sense of independence that leads to fulfillment. At Sandstone Bountiful, enjoy first-class hospitality and an elevated lifestyle during recovery.

Unmatched comfort delivered with an array of services and amenities ensures residents maintain an active day-to-day living supported by a vibrant lifestyle. Its medical services include comprehensive rehabilitation, orthopedic rehabilitation, ventilator care, wound care, post-operative care, and skilled nursing services delivered 24/7.

(801) 951-2273

Quality ratings

Measured by Centers for Medicare & Medicaid Services (CMS)

Overall rating Info The Overall CMS Rating combines results from health inspections, staffing levels and quality measures. Health inspections carry the most weight. Staffing and quality scores can increase or decrease the final rating based on performance compared to state and national standards.
5/5
Utah average: 3.4/5
Health Inspection Info Based on the results of the facility's three most recent standard inspections and any complaint investigations. CMS reviews the number, scope, and severity of deficiencies, with more recent findings weighted more heavily.
4/5
Utah average: 2.8/5
Staffing Info Measures average nursing staff hours per resident per day, including Registered Nurses (RNs) and total nursing staff. Ratings are adjusted based on the level of care residents require and are compared to state and national benchmarks.
3/5
Utah average: 3.1/5
Quality Measures Info Based on clinical and physical health indicators reported to CMS, such as hospital readmissions, falls, pressure ulcers, and improvements in mobility. These measures reflect how well residents' health needs are being managed.
5/5
Utah average: 4.4/5

Nursing care per resident

Info This shows how many total hours of nursing staff time are available per resident each day. Higher numbers usually mean more staff support.
3h 23m per day

This home provides 9% less nursing time per resident than the Utah average.

Utah average: 3h 43m per day

Capacity and availability

Medium-capacity home

Offers a balance of services and community atmosphere.

Total beds 122

This home usually has availability

Lower occupancy suggests more openings may be available.

Lower demand than the Utah average
Occupancy rate 45.7%
Residents per day (avg) 76
Occupancy rate
45.7%
Residents per day (avg)
76

Who this home usually serves

TYPE OF STAY

Mix of rehab and long-term care

This home supports both short-term rehab and long-term care, with residents staying for a wide range of durations.

Breakdown by payment type

Medicare

32% of new residents, usually for short-term rehab.

Typical stay 28 days

Private pay

53% of new residents, often for short stays.

Typical stay 1 months

Medicaid

14% of new residents, often for long-term daily care.

Typical stay 7 - 8 months

Finances and operations

Privately-owned community
Operated by a business corporation.
Home revenue
$11.7M
Profit
$225.8K
Privately-owned community Operated by a business corporation.
Home revenue
$11,729,104.00
Profit
$225,767.00
Payroll costs Info The portion of the home's budget spent on staff, including nurses, caregivers, and other employees who support care and operations.
$2.8M
24.2% of revenue
Other operating costs Info All remaining costs needed to run the home, such as food, utilities, building maintenance, supplies and administrative expenses.
$8.7M
Total costs $11.5M

Types of Care at Sandstone Bountiful

Assisted Living Skilled Nursing
Contact Sandstone Bountiful

Health Inspection History

Inspections
Total health inspections 4

Utah average 3.5


Last Health inspection on Apr 2024

Total health citations 13

Utah average 27.7

Citations per inspection
3.25

Utah average 7.62


Health citations are formal notices following inspections when they fail to comply with safety and care standards.

10 of 13 citations resulted from standard inspections; and 3 of 13 resulted from complaint investigations.

Breakdown of citation severity (last 3 years)
Critical Health citations More info 0
100% better than Utah average

Utah average: 0.7


Serious Health citations More info 2
20% better than Utah average

Utah average: 2.5

0 critical citations More info Utah average: 0.7

2 serious citations More info Utah average: 2.5

11 moderate citations More info Utah average: 24.5

0 minor citations More info Utah average: 0.1
Citations history (last 3 years)
Pharmacy moderate citation Info Issues related to medication management, including how drugs are stored, administered, and monitored. Apr 29, 2024
Corrected

Quality of Care moderate citation Info Issues related to how well residents receive appropriate treatment and support for their medical and daily care needs. Apr 29, 2024
Corrected

Quality of Care moderate citation Info Issues related to how well residents receive appropriate treatment and support for their medical and daily care needs. Apr 29, 2024
Corrected

Quality of Care moderate citation Info Issues related to how well residents receive appropriate treatment and support for their medical and daily care needs. Apr 29, 2024
Corrected

Compare Nursing Homes around Bountiful The information below is reported by the Utah Department of Health and Human Services, Health Facility Licensing.

2 facilities compared · CMS & UT Dept. of Health data · Updated Mar 2026

Sandstone Bountiful
AL

Assisted Living A licensed, long-term care setting for seniors or individuals with disabilities who need help with daily activities — like bathing, dressing, and medication management — but not 24-hour skilled nursing. Offers housing, meals, and around-the-clock support while aiming to maximize resident independence.

NH

Nursing Home Licensed facility providing 24/7 skilled nursing care for residents with complex, ongoing medical needs. Staffed by RNs, LPNs, and CNAs. Inspected and star-rated annually by CMS. Accepts Medicare (short-term rehab) and Medicaid (long-term care).

Bountiful (North Ridge)
122
45.7%
-35%
3.39
+45%
-9%
0
13
2
76
60
Bountiful Nursing & Rehab Llc
$11,6M
$2,8M
24.4%
465156
Sandstone North Park
AL

Assisted Living A licensed, long-term care setting for seniors or individuals with disabilities who need help with daily activities — like bathing, dressing, and medication management — but not 24-hour skilled nursing. Offers housing, meals, and around-the-clock support while aiming to maximize resident independence.

NH

Nursing Home Licensed facility providing 24/7 skilled nursing care for residents with complex, ongoing medical needs. Staffed by RNs, LPNs, and CNAs. Inspected and star-rated annually by CMS. Accepts Medicare (short-term rehab) and Medicaid (long-term care).

Bountiful
102
40.4%
-42%
3.56
-12%
-4%
2
0
0
33
56
North Canyon Nursing & Rehab Llc
$7,5M
$2,4M
31.8%
465163

Places of interest near Sandstone Bountiful

Address 0.5 miles from city center — 0.86 miles to nearest hospital (Lakeview Hospital)

Address 523 N Main St, Bountiful, UT 84010

Calculate Travel Distance to Sandstone Bountiful

Add your location

Address

Staffing Data (Q2 2025)

This data corresponds to Q2 2025 and is based on CMS Payroll-Based Journal.

Total staff 184
Employees 85
Contractors 99
Staff to resident ratio 3.76:1
77% better than Utah average

Utah average ratio: 2.12:1

Avg staff/day 41
Average shift 7.5 hours
5% worse than Utah average

Utah average: 7.9 hours

Total staff hours (quarter) 27,896
Nursing staff breakdown
Registered Nurse

Manages medical care and health needs.

Total count 45
Average shift length Info Average shift length. Calculated as total hours divided by days worked and average staff per day. 8.4 hours

This role is partially covered by contractors.

Licensed Practical Nurse

Assists with medical care and medications.

Total count 15
Average shift length Info Average shift length. Calculated as total hours divided by days worked and average staff per day. 7.9 hours

This role is partially covered by contractors.

Certified Nursing Assistant

Helps with daily care and mobility.

Total count 95
Average shift length Info Average shift length. Calculated as total hours divided by days worked and average staff per day. 7.7 hours

This role is partially covered by contractors.

Contractor staffing

Total hours from contractors

28.3%

7,890 contractor hours this quarter

Certified Nursing Assistant: 51 Registered Nurse: 25 Licensed Practical Nurse: 6 Physical Therapy Aide: 5 Physical Therapy Assistant: 5 Speech Language Pathologist: 3 Respiratory Therapy Technician: 3 Qualified Social Worker: 1
Staff by category
Certified Nursing Assistant44519513,40591100%7.7
Registered Nurse2025456,85191100%8.4
Licensed Practical Nurse96152,3538998%7.9
Other Dietary Services Staff3038927684%6.5
Physical Therapy Aide0557628897%5.2
Dental Services Staff2027356673%8
Clinical Nurse Specialist4047066167%7.6
Speech Language Pathologist0336586875%6.2
Nurse Practitioner1014806066%8
Physical Therapy Assistant0553477481%4.7
Administrator2023284145%8
Respiratory Therapy Technician0332117380%2.3
Qualified Social Worker0111706673%2.6
95 Certified Nursing Assistant
% of Days 100%
45 Registered Nurse
% of Days 100%
15 Licensed Practical Nurse
% of Days 98%
3 Other Dietary Services Staff
% of Days 84%
5 Physical Therapy Aide
% of Days 97%
2 Dental Services Staff
% of Days 73%
4 Clinical Nurse Specialist
% of Days 67%
3 Speech Language Pathologist
% of Days 75%
1 Nurse Practitioner
% of Days 66%
5 Physical Therapy Assistant
% of Days 81%
2 Administrator
% of Days 45%
3 Respiratory Therapy Technician
% of Days 80%
1 Qualified Social Worker
% of Days 73%

Facility Characteristics

Source: CMS Long-Term Care Facility Characteristics (Data as of Jan 2026)

Total census
49 residents
Residents by payment source
Medicare
12 residents (24.5%)
Medicaid
30 residents (61.2%)
Private pay or other
7 residents (14.3%)
Programs & Services
Residents' Group

Residents meet regularly to discuss policies, care quality, and activities

Nurse Aide Training

State-approved Nurse Aide Training and Competency Evaluation Program on-site

Active Resident Council

Organized group of residents that meets regularly to discuss facility policies, quality of life, and activities.

Quality of care over time

These measures show how residents usually do over time at this home, based on health outcomes and preventive care.

High-risk clinical events score Info A composite score based on pressure ulcers, falls with injury, weight loss, walking ability decline, and activities of daily living decline. 11.6
25% worse than Utah average

Utah average: 9.3

Functional decline score Info A composite score based on activities of daily living decline, walking ability decline, and incontinence. 23.2
16% worse than Utah average

Utah average: 20.1

Long-stay resident measures
Need for Help with Daily Activities Increased Info Percent of long-stay residents whose need for help with daily activities has increased 15.9%
In line with Utah average

Utah average: 15.7%

Walking Ability Worsened Info Percent of long-stay residents whose ability to move independently worsened 30.3%
43% worse than Utah average

Utah average: 21.3%

Low Risk Residents with Bowel/Bladder Incontinence Info Percent of low risk long-stay residents who lose control of their bowels or bladder 23.3%
In line with Utah average

Utah average: 23.1%

Falls with Major Injury Info Percent of long-stay residents experiencing one or more falls with major injury 3.0%
14% worse than Utah average

Utah average: 2.6%

High Risk Residents with Pressure Ulcers Info Percent of long-stay high risk residents with pressure ulcers 4.5%
8% worse than Utah average

Utah average: 4.2%

Urinary Tract Infection Info Percent of long-stay residents with a urinary tract infection 3.6%
75% worse than Utah average

Utah average: 2.1%

Lost Too Much Weight Info Percent of long-stay residents who lose too much weight 4.4%
8% worse than Utah average

Utah average: 4.1%

Depressive Symptoms Info Percent of long-stay residents who have depressive symptoms 9.7%
41% better than Utah average

Utah average: 16.5%

Antipsychotic Use Info Percent of long-stay residents who received an antipsychotic medication 5.5%
59% better than Utah average

Utah average: 13.5%

Pneumococcal Vaccine Info Percent of long-stay residents assessed and appropriately given the pneumococcal vaccine 98.8%
In line with Utah average

Utah average: 97.1%

Influenza Vaccine Info Percent of long-stay residents assessed and appropriately given the seasonal influenza vaccine 100.0%
In line with Utah average

Utah average: 98.0%

Short-stay resident measures
Pneumococcal Vaccine Info Percent of short-stay residents assessed and appropriately given the pneumococcal vaccine 96.8%
In line with Utah average

Utah average: 92.9%

Antipsychotic medication increase Info Percent of short-stay residents who newly received an antipsychotic medication 0.5%
52% better than Utah average

Utah average: 1.1%

Influenza Vaccine Info Percent of short-stay residents assessed and appropriately given the seasonal influenza vaccine 89.1%
In line with Utah average

Utah average: 91.0%

Guides for Better Senior Living

Care Cost Calculator: See Prices in Your Area

Nursing Home Data Explorer

Don’t Wait Too Long: 7 Red Flag Signs Your Parent Needs Assisted Living Now

The True Cost of Assisted Living in 2025 – And How Families Are Paying For It

Understanding Senior Living Costs: Pricing Models, Discounts & Financial Assistance

Financial Aid for Utah Seniors

Get financial aid guidance

Aging Waiver

UT Medicaid Aging Waiver

Age 65+, Utah resident, Medicaid-eligible, nursing home-level care need.

~$2,829/month (300% FBR, individual).

$2,000 (individual), $3,000 (couple).

Rural challenges; waitlists possible.

Utah Alternatives Program

UT Alternatives

Age 60+, Utah resident, at risk of nursing home.

~$2,000/month (individual, varies).

$5,000 (individual).

Limited funding; rural focus.

Older Americans Act (OAA) Services

Utah OAA Services

Age 60+, UT resident; no income/asset limits.

None; donations encouraged.

Not assessed.

12 AAAs; includes Meals on Wheels; rural emphasis.

Medicare Savings Program (MSP)

Utah Medicare Savings Program

Age 65+ or disabled, UT resident, Medicare Part A/B.

~$2,510/month (QMB), ~$3,380/month (SLMB), ~$3,598/month (QI)—individual.

$9,430 (individual), $14,130 (couple).

Includes Extra Help for Part D; no waitlist.

Home Energy Assistance Target (HEAT) Program

Utah HEAT Program

Age 60+ prioritized, UT resident, low-income household.

~$3,970/month (185% FPL).

Not assessed.

Covers gas, electric, propane; emergency aid available.

Utah Caregiver Support Program

Utah Family Caregiver Support Program (FCSP)

Caregivers of 60+ needing care or 55+ caregivers of others; UT resident; 2+ ADLs.

No strict cap; prioritizes low-income (~$24,980/year).

Not assessed.

Includes grandparent caregivers; serves ~1,500 annually.

Senior Community Service Employment Program (SCSEP)

Utah SCSEP

Age 55+, unemployed, low-income, UT resident.

~$1,983/month (125% FPL).

Not specified.

Priority for veterans, rural residents; AARP partnership.

VA Aid and Attendance (A&A) and Housebound Benefits

Utah VA Aid and Attendance/Housebound

Age 65+ or disabled veteran/spouse, UT resident, wartime service, ADL help (A&A) or homebound.

Net income < ~$1,984/month (veteran with dependent, A&A); pension offsets income.

~$155,356 (net worth).

Supports rural veterans; high demand near VA centers.

Property Tax Abatement and Deferral Programs

Utah Circuit Breaker and Deferral Programs

Age 66+ (abatement) or 75+ (deferral), UT resident 10+ months/year, homeowner.

~$40,000/year (household, abatement); no limit for deferral.

Not assessed; home value < ~$500,000 typical.

Abatement up to $1,200; deferral accrues interest (2.5%-5%).

Senior Farmers’ Market Nutrition Program (SFMNP)

Utah SFMNP

Age 60+, UT resident, low-income.

~$2,322/month (185% FPL).

Not assessed.

Vouchers (~$50/season); serves ~5,000 via 12 AAAs.

Tour Icon
Planning a tour? Check our touring checklist.
Chat Icon
Thinking of living here? We can help you speak to a current resident