Texhoma Christian Care Center for Alzheimer‘s and Dementia
Nursing Home, Independent Living, Memory Care, Nursing Care & Respite Care · Wichita Falls, TX
CMS overall rating Info CMS (the Centers for Medicare & Medicaid Services) is the federal agency that rates nursing home quality. Its Overall Rating runs from 1 to 5 stars, combining health inspections, staffing, and quality measures, with inspections weighted most heavily.

Texhoma Christian Care Center for Alzheimer‘s and Dementia

Nursing Home, Independent Living, Memory Care, Nursing Care & Respite Care · Wichita Falls, TX
CMS overall rating Info CMS (the Centers for Medicare & Medicaid Services) is the federal agency that rates nursing home quality. Its Overall Rating runs from 1 to 5 stars, combining health inspections, staffing, and quality measures, with inspections weighted most heavily.
Calculator: See prices in your area
Texhoma Christian Care Center for Alzheimer‘s and Dementia accepts Medicare, Medicaid, and private pay.

Overview of Texhoma Christian Care Center for Alzheimer‘s and Dementia

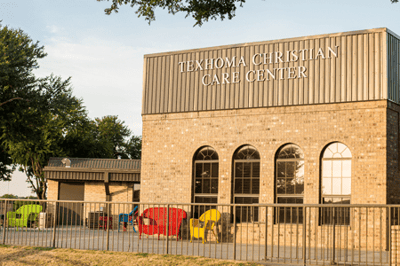
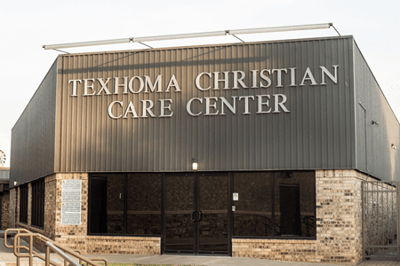
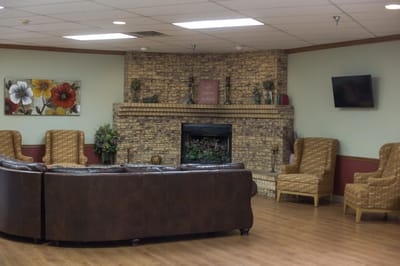
Texhoma Christian Care Center for Alzheimer’s and Dementia is a special care facility within Texhoma Christian Care Center in Wichita Falls, TX, that offers focused care services for residents living with Alzheimer’s and dementia. The Alzheimer’s and Dementia unit features secure, magnetically locked entrances and exits, to ensure the safety of residents who wander.

Residents of Texhoma’s Alzheimer’s and Dementia unit are also provided dietary services, physician services, as well as transportation for scheduled medical appointments. Housekeeping and laundry services, as well as salon and barber services are provided on-site.

Quality ratings

Measured by Centers for Medicare & Medicaid Services (CMS)

Overall rating Info The Overall CMS Rating combines results from health inspections, staffing levels and quality measures. Health inspections carry the most weight. Staffing and quality scores can increase or decrease the final rating based on performance compared to state and national standards.
▲ 78.9% Above TX avg. ▲ 78.9% Above TX avg.TX average: 2.8Click the badge to see the full State ranking.Click here to see the full State ranking.
Health Inspection Info Based on the results of the facility's three most recent standard inspections and any complaint investigations. CMS reviews the number, scope, and severity of deficiencies, with more recent findings weighted more heavily.
▲ 80.9% Above TX avg. ▲ 80.9% Above TX avg.TX average: 2.8Click the badge to see the full State ranking.Click here to see the full State ranking.
Staffing Info Measures average nursing staff hours per resident per day, including Registered Nurses (RNs) and total nursing staff. Ratings are adjusted based on the level of care residents require and are compared to state and national benchmarks.
▲ 88.5% Above TX avg. ▲ 88.5% Above TX avg.TX average: 2.1Click the badge to see the full State ranking.Click here to see the full State ranking.
Quality Measures Info Based on clinical and physical health indicators reported to CMS, such as hospital readmissions, falls, pressure ulcers, and improvements in mobility. These measures reflect how well residents' health needs are being managed.
▲ 6.5% Above TX avg. ▲ 6.5% Above TX avg.TX average: 3.8Click the badge to see the full State ranking.Click here to see the full State ranking.

Staffing hours breakdown

Info Daily nursing hours per resident by staff type, reported to CMS. Higher is generally better — compare this facility to state and national averages to see where staffing stands.

Hours per resident per day — compared to Texas state averages

Total nursing care / resident Info This home is ranked 44th out of 296 homes in Texas for nurse hours. Total adjusted nursing hours per resident per day, combining RN, LPN, and aide time. CMS adjusts this for case-mix so facilities can be fairly compared.
4h 34m per day
Rank #44 / 296Nurse hours — State benchmarkedThis home is ranked 44th out of 296 homes in Texas. Shows adjusted nurse hours per resident per day benchmarked to the Texas average, with a ranking across 296 Texas facilities. More hours mean more direct care. The national average is about 3.5 hrs; below 3.0 is a red flag.Rankings are based only on facilities in Texas that report data for that category. Facilities without available data are excluded from the ranking.Click the rank badge to see the full State ranking.Click here to see the full State ranking.
This facility Texas avg (3h 38m per day)
vs Texas avg
+26%

3 of 6 metrics below state avg

Standout metric Nurse Aide is +30% above state avg
Staff typeHours / Day / Residentvs state avg
Registered Nurse (RN) Info RNs hold the highest nursing license and can assess residents, interpret test results, and direct care plans. More RN hours per day often signals stronger clinical oversight and faster response to health changes. 22m per day ▼ 14% State avg: 26m per day · National avg: 41m per day
LPN / LVN Info Licensed Practical Nurses (LPNs) or Licensed Vocational Nurses (LVNs) deliver routine hands-on care — medication administration, wound dressing, and monitoring vital signs. They work under RN supervision and make up a large share of daily bedside care. 1h 6m per day ▲ 17% State avg: 57m per day · National avg: 52m per day
Nurse Aide Info Certified Nurse Aides (CNAs) provide the most direct day-to-day assistance: bathing, dressing, feeding, and mobility. Nurse aide hours are typically the largest staffing category and directly affect residents' quality of life. 2h 37m per day ▲ 30% State avg: 2h 1m per day · National avg: 2h 21m per day
Weekend Total Nursing Info Combined nursing hours (RN + LPN + Nurse Aide) per resident per day on weekends. Staffing often drops on weekends — this figure reveals whether the facility maintains adequate coverage outside of weekday hours. 3h 45m per day ▲ 26% State avg: 2h 59m per day · National avg: 3h 26m per day
Physical Therapist Info Hours per resident per day provided by licensed Physical Therapists (PTs) or PT Assistants. PT services help residents recover mobility after injury or illness and are especially important for post-acute (short-stay) rehabilitation. 2m per day ▼ 44% State avg: 4m per day · National avg: 4m per day
Weekend RN Info Registered nurse hours specifically on weekends. Facilities sometimes reduce RN presence on Saturdays and Sundays — a low weekend RN figure compared to weekday hours can indicate reduced clinical oversight when most administrative staff are absent. 15m per day ▼ 30% State avg: 21m per day · National avg: 29m per day

Capacity and availability

This home usually has availability

Lower occupancy than the Texas average: 63.5%
Occupancy rate
46.8% Rank #257 / 304Occupancy rate — State benchmarkedThis home is ranked 257th out of 304 homes in Texas. Shows this facility's occupancy rate versus the Texas average, with its Statewide rank out of 304. Higher occupancy signals strong local demand and financial stability.Rankings are based only on facilities in Texas that report data for that category. Facilities without available data are excluded from the ranking.Click the rank badge to see the full State ranking.Click here to see the full State ranking.
Avg. Length of Stay
105 days
Bed community size
234-bed community Rank #6 / 988Bed count — State benchmarkedThis home is ranked 6th out of 988 homes in Texas. Shows this facility's certified or reported bed count compared to other Texas facilities. Larger communities may offer more amenities, programs, and on-site services for residents and families.Rankings are based only on facilities in Texas that report data for that category. Facilities without available data are excluded from the ranking.Click the rank badge to see the full State ranking.Click here to see the full State ranking.
A large-scale community that may provide a wide range of amenities, services, and structured programs.
Walk Score
Walk Score: 8 / 100 Rank #1259 / 1391Walk Score — State benchmarkedThis home is ranked 1259th out of 1391 homes in Texas. Shows how walkable this facility's neighborhood is compared to the average Walk Score across Texas facilities. Higher scores benefit residents, families, and staff.Rankings are based only on facilities in Texas that report data for that category. Facilities without available data are excluded from the ranking.Click the rank badge to see the full State ranking.Click here to see the full State ranking.
Car-dependent. Most errands require a car, with limited nearby walkable options.

Payment & Insurance

2 services
Accept Medicaid
Accept Medicare

Therapy & Rehabilitation

2 services
Rehabilitation Services
Short-Term Rehab

Staffing & Medical

1 service
Doctor on Staff

Additional Services

2 services
Long-Term Nursing Care
Alzheimer’s & Dementia Care

Amenities & Lifestyle

Medical Services
Physician Services
Dietary Services
Recreational & Activities
Laundry & Housekeeping
Financial Options
Maintenance
Transportation
Specific ProgramsIndependent Living Cottages

Contact Texhoma Christian Care Center for Alzheimer‘s and Dementia

Staffing Data

Reporting period: October 1 – December 31, 2025 (Q4 2025). Source: CMS Payroll-Based Journal report.

Total staff 182
Employees 162
Contractors 20
Staff to resident ratio 1.33 : 1
10% fewer staff per resident than Texas average
Texas average ratio: 1.48 : 1 Texas average ratio: 1.48 : 1See full Texas ranking
Avg staff/day 82
Average shift 8.5 hours
5% better than Texas average
Texas average: 8.1 hours Texas average shift: 8.1 hoursSee full Texas ranking
Total staff hours (quarter) 64,270

Nursing staff breakdown

Q4 2025 · Oct 1 – Dec 31 More info This data comes from the CMS Payroll-Based Journal report covering October 1 – December 31, 2025.
Registered Nurse

Manages medical care and health needs.

RN Staff Info All 9 RN Staff are full-time employees. No contractors work on this role. 9
Average shift length Info Average shift length. Calculated as total hours divided by days worked and average staff per day. 8.6 hours
Licensed Practical Nurse

Assists with medical care and medications.

LPN Staff Info All 32 LPN Staff are full-time employees. No contractors work on this role. 32
Average shift length Info Average shift length. Calculated as total hours divided by days worked and average staff per day. 9.2 hours
Certified Nursing Assistant

Helps with daily care and mobility.

CNA Staff Info All 78 CNA Staff are full-time employees. No contractors work on this role. 78
Average shift length Info Average shift length. Calculated as total hours divided by days worked and average staff per day. 8.9 hours

Contractor staffing

Q4 2025 · Oct 1 – Dec 31 More info This data comes from the CMS Payroll-Based Journal report covering October 1 – December 31, 2025.

Total hours from contractors

6.7%

4,327 contractor hours this quarter

Respiratory Therapy Technician: 5 Qualified Social Worker: 4 Physical Therapy Aide: 3 Speech Language Pathologist: 3 Physical Therapy Assistant: 2 Medical Director: 1 Feeding Assistant: 1 Occupational Therapy Assistant: 1

Staff by category

Q4 2025 · Oct 1 – Dec 31 More info This data comes from the CMS Payroll-Based Journal report covering October 1 – December 31, 2025.
Certified Nursing Assistant7807828,15592100%8.9
Licensed Practical Nurse3203213,88092100%9.2
Medication Aide/Technician110114,97092100%9.1
Nurse Aide in Training160163,8668997%9.7
Registered Nurse9093,35692100%8.6
RN Director of Nursing5051,7377076%7.9
Clinical Nurse Specialist4041,3757278%7.3
Speech Language Pathologist0331,3528289%7.2
Physical Therapy Aide0331,0086975%6.1
Mental Health Service Worker2029746368%8.1
Qualified Social Worker0448426368%7.7
Respiratory Therapy Technician0555286975%5.3
Nurse Practitioner2024966065%8
Administrator1014886166%8
Other Dietary Services Staff1014505964%7.6
Medical Director01127092100%2.9
Physical Therapy Assistant0222314549%5.1
Occupational Therapy Aide10119792100%2.1
Occupational Therapy Assistant01176910%8.4
Feeding Assistant011201112%1.8
78 Certified Nursing Assistant
% of Days 100%
32 Licensed Practical Nurse
% of Days 100%
11 Medication Aide/Technician
% of Days 100%
16 Nurse Aide in Training
% of Days 97%
9 Registered Nurse
% of Days 100%
5 RN Director of Nursing
% of Days 76%
4 Clinical Nurse Specialist
% of Days 78%
3 Speech Language Pathologist
% of Days 89%
3 Physical Therapy Aide
% of Days 75%
2 Mental Health Service Worker
% of Days 68%
4 Qualified Social Worker
% of Days 68%
5 Respiratory Therapy Technician
% of Days 75%
2 Nurse Practitioner
% of Days 65%
1 Administrator
% of Days 66%
1 Other Dietary Services Staff
% of Days 64%
1 Medical Director
% of Days 100%
2 Physical Therapy Assistant
% of Days 49%
1 Occupational Therapy Aide
% of Days 100%
1 Occupational Therapy Assistant
% of Days 10%
1 Feeding Assistant
% of Days 12%

Penalties and fines

Federal penalties imposed by CMS for regulatory violations, including civil money penalties (fines) and denials of payment for new Medicare/Medicaid admissions.

Source: CMS Penalties Database

No penalties in the past 3 years

No civil money penalties or payment denials were reported in the last 3 years.

Quality of care over time

These measures show how residents usually do over time at this home, based on health outcomes and preventive care.

High-risk clinical events score Info A composite score based on pressure ulcers, falls with injury, weight loss, walking ability decline, and activities of daily living decline. 11.0
28% worse than Texas average

Texas average: 8.6

Functional decline score Info A composite score based on activities of daily living decline, walking ability decline, and incontinence. 20.8
30% worse than Texas average

Texas average: 16.0

Long-stay resident measures
Above average Info CMS star rating based on long-stay quality measure performance. 5 stars = significantly above average, 1 star = significantly below average.
Need for Help with Daily Activities Increased Info Percent of long-stay residents whose need for help with daily activities has increased 26.5%
64% worse than Texas average

Texas average: 16.2%

Walking Ability Worsened Info Percent of long-stay residents whose ability to move independently worsened 19.5%
20% worse than Texas average

Texas average: 16.2%

Low Risk Residents with Bowel/Bladder Incontinence Info Percent of low risk long-stay residents who lose control of their bowels or bladder 16.4%
5% worse than Texas average

Texas average: 15.7%

Falls with Major Injury Info Percent of long-stay residents experiencing one or more falls with major injury 5.0%
54% worse than Texas average

Texas average: 3.2%

High Risk Residents with Pressure Ulcers Info Percent of long-stay high risk residents with pressure ulcers 0.8%
81% better than Texas average

Texas average: 4.4%

Urinary Tract Infection Info Percent of long-stay residents with a urinary tract infection 0.6%
23% better than Texas average

Texas average: 0.8%

Lost Too Much Weight Info Percent of long-stay residents who lose too much weight 3.5%
In line with Texas average

Texas average: 3.5%

Depressive Symptoms Info Percent of long-stay residents who have depressive symptoms 2.1%
27% better than Texas average

Texas average: 2.9%

Antipsychotic Use Info Percent of long-stay residents who received an antipsychotic medication 0.5%
94% better than Texas average

Texas average: 7.9%

Pneumococcal Vaccine Info Percent of long-stay residents assessed and appropriately given the pneumococcal vaccine 100.0%
In line with Texas average

Texas average: 97.3%

Influenza Vaccine Info Percent of long-stay residents assessed and appropriately given the seasonal influenza vaccine 100.0%
In line with Texas average

Texas average: 97.9%

Hospitalizations per 1,000 days Info Number of hospitalizations per 1,000 long-stay resident days. 2.01
6% better than Texas average

Texas average: 2.13

ED visits per 1,000 days Info Number of outpatient emergency department visits per 1,000 long-stay resident days. 1.32
36% better than Texas average

Texas average: 2.07

Short-stay resident measures
Average Info CMS star rating based on short-stay quality measure performance. 5 stars = much above average, 1 star = much below average.
Pneumococcal Vaccine Info Percent of short-stay residents assessed and appropriately given the pneumococcal vaccine 98.5%
9% better than Texas average

Texas average: 90.4%

Antipsychotic medication increase Info Percent of short-stay residents who newly received an antipsychotic medication 0.0%
100% better than Texas average

Texas average: 1.4%

Influenza Vaccine Info Percent of short-stay residents assessed and appropriately given the seasonal influenza vaccine 98.3%
12% better than Texas average

Texas average: 88.0%

Re-hospitalized after SNF stay Info Percentage of short-stay residents who were re-hospitalized after their nursing home admission. 27.3%
5% worse than Texas average

Texas average: 25.9%

Emergency department visits Info Percentage of short-stay residents who had an outpatient emergency department visit. 10.2%
15% better than Texas average

Texas average: 12.0%

Falls with major injury Info Percentage of SNF residents who experience falls with major injury during their stay. 0.0%
100% better than Texas average

Texas average: 0.8%

Ability to care for self at discharge Info Percentage of residents at or above expected ability to care for themselves at discharge. 55.1%
In line with Texas average

Texas average: 53.7%

Successful return to home or community Info Rate of successful return to home or community from a skilled nursing facility. 53.2%
5% better than Texas average

Texas average: 50.6%

Breakdown by payment type

Medicare

44% of new residents, usually for short-term rehab.

Typical stay 25 days

Private pay

32% of new residents, often for short stays.

Typical stay 2 - 3 months

Medicaid

24% of new residents, often for long-term daily care.

Typical stay 10 - 11 months

Facility Characteristics

Source: CMS Long-Term Care Facility Characteristics (Data as of Jan 2026)

Total residents 137
Medicare
13
9.5% of residents
Medicaid
93
67.9% of residents
Private pay or other
31
22.6% of residents
Programs & Services
Residents Group

Residents meet regularly to discuss policies, care quality, and activities

Nurse Aide Training

State-approved Nurse Aide Training and Competency Evaluation Program on-site

Active Resident Council

Organized group of residents that meets regularly to discuss facility policies, quality of life, and activities.

Finances and operations

Based on CMS SNF Cost Report for fiscal year ending in 02/2024.

Nonprofit
Nonprofit Corporation
Net patient revenue Info Net patient revenue — what the home actually collects for resident care, after contractual allowances, bad debt and discounts are subtracted from its gross charges (CMS cost report, Worksheet G-3). It covers resident care only; money the home earns from other sources is shown separately as "Other income."
$16.4M
Net patient income Info Net patient income: net patient revenue minus the home's total operating expenses. A positive figure means it earns more from resident care than it spends to deliver it; a negative figure means the opposite. It excludes non-operating "other income."
$83.3K
Nonprofit Nonprofit Corporation
Net patient revenue Info Net patient revenue — what the home actually collects for resident care, after contractual allowances, bad debt and discounts are subtracted from its gross charges (CMS cost report, Worksheet G-3). It covers resident care only; money the home earns from other sources is shown separately as "Other income."
$16.4M Rank #96 / 304Revenue — State benchmarkedThis home is ranked 96th out of 304 homes in Texas. Shows this facility's annual revenue compared to the Texas average. Higher revenue generally means more resources for staffing and capital — read alongside Payroll %.Rankings are based only on facilities in Texas that report data for that category. Facilities without available data are excluded from the ranking.Click the rank badge to see the full State ranking.Click here to see the full State ranking.
Net patient income Info Net patient income: net patient revenue minus the home's total operating expenses. A positive figure means it earns more from resident care than it spends to deliver it; a negative figure means the opposite. It excludes non-operating "other income."
$83.3K
Other income Info Money the home earns outside of resident care — such as investments, grants, rentals and other non-operating sources (CMS cost report, Worksheet G-3). It is tracked separately from net patient revenue: it is not part of that figure, and it is not included in net patient income.
$530.7K
Payroll costs Info Staff salaries plus wage-related costs — benefits such as payroll taxes, health insurance and retirement — from the home's own accounting records (CMS cost report, Worksheet A). Contract or agency labor is counted separately, under other operating costs. Rank #19 / 304Payroll — State benchmarkedThis home is ranked 19th out of 304 homes in Texas. Shows total annual staff payroll benchmarked to the Texas average. Higher payroll investment relative to peers often signals better staffing and less reliance on cheaper contract labor.Rankings are based only on facilities in Texas that report data for that category. Facilities without available data are excluded from the ranking.Click the rank badge to see the full State ranking.Click here to see the full State ranking.
$10.3M 63.1% of net patient revenue Info Payroll as a share of revenue: staff salaries and wage-related benefits divided by net patient revenue. A higher figure means more of each revenue dollar goes to staff pay. Rank #4 / 304Payroll % — State benchmarkedThis home is ranked 4th out of 304 homes in Texas. Shows payroll as a percentage of revenue versus the Texas average. Well-run Texas facilities typically land around 51–63% — the top third Statewide. Below 25% may signal understaffing or heavy agency use — read with Staffing ratings.Rankings are based only on facilities in Texas that report data for that category. Facilities without available data are excluded from the ranking.Click the rank badge to see the full State ranking.Click here to see the full State ranking.
Other operating costs Info Everything it costs to run the home apart from payroll — food, utilities, supplies, maintenance, contract labor and administration. Calculated as total operating expense minus payroll (staff salaries and wage-related benefits).
$6.0M
Total costs Info The home's total operating expense for the year — all the costs of running it, salaries included (CMS cost report, Worksheet G-3).
$16.3M

Who this home usually serves

TYPE OF STAY

Mostly short-term rehab stays

Most residents typically stay for a few weeks or months before returning home or moving on.

New residents most often arrive under Medicare (44% of admissions), and a typical Medicare stay runs around 25 days.

Admissions
506 total

Coverage residents most often arrive under.

Medicare 44%
Private pay 32%
Medicaid 24%
Discharges
502 total

Coverage residents most often leave under.

Medicare 45%
Private pay 30%
Medicaid 25%

Places of interest near Texhoma Christian Care Center for Alzheimer‘s and Dementia

Address 3.4 miles from city center Info Estimated distance in miles from Wichita Falls's city center to Texhoma Christian Care Center for Alzheimer‘s and Dementia's address, calculated via Google Maps.

Calculate Travel Distance to Texhoma Christian Care Center for Alzheimer‘s and Dementia

Add your location

Address

Compare Nursing Homes around Wichita Falls

The information below is reported by the Texas Health and Human Services Commission.

5 facilities compared · CMS & TX Dept. of Health data

Texhoma Christian Care Center for Alzheimer‘s and Dementia
NH
IL
MC
NC
RC
Wichita Falls
234
Facility 234
TX AVG 80
Rank #6 / 988
46.8%
Facility 46.8%
TX AVG 63.5%
Rank #257 / 304
-26%
4.57
Facility 4.57
TX AVG 3.63
Rank #44 / 296
-36%+26%
$0
Facility $0
TX AVG $81.8k
Rank #1 / 301
12
Facility 12
TX AVG 25.9
Rank #39 / 299
3.0
Facility 3.0
TX AVG 3.7
Rank #120 / 299
-153-
8
Facility 8
TX AVG 41
Rank #1259 / 1391
Texhoma Christian Care Center Inc
$16.4M
Facility $16.4M
TX AVG $8.4M
Rank #96 / 304
$10.3M
Facility $10.3M
TX AVG $3.5M
Rank #19 / 304
63.1%
Facility 63.1%
TX AVG 47%
Rank #4 / 304
455965
Senior Care Health & Rehabilitation
NH
NC
Wichita Falls (910)
144
Facility 144
TX AVG 80
Rank #78 / 988
89.4%
Facility 89.4%
TX AVG 63.5%
Rank #21 / 304
+41%
3.02
Facility 3.02
TX AVG 3.63
Rank #255 / 296
+2%-17%
$0
Facility $0
TX AVG $81.8k
Rank #1 / 301
10
Facility 10
TX AVG 25.9
Rank #26 / 299
2.5
Facility 2.5
TX AVG 3.7
Rank #64 / 299
-128-
23
Facility 23
TX AVG 41
Rank #1057 / 1391
Delana Hood
$17.6M
Facility $17.6M
TX AVG $8.4M
Rank #14 / 304
$6.9M
Facility $6.9M
TX AVG $3.5M
Rank #66 / 304
39.4%
Facility 39.4%
TX AVG 47%
Rank #302 / 304
676144
University Park Nursing & Rehabilitation
NH
Wichita Falls
98
Facility 98
TX AVG 80
Rank #376 / 988
84.6%
Facility 84.6%
TX AVG 63.5%
Rank #39 / 304
+33%
3.82
Facility 3.82
TX AVG 3.63
Rank #93 / 296
-31%+5%
$0
Facility $0
TX AVG $81.8k
Rank #1 / 301
32
Facility 32
TX AVG 25.9
Rank #230 / 299
4.0
Facility 4.0
TX AVG 3.7
Rank #215 / 299
-92-
40
Facility 40
TX AVG 41
Rank #734 / 1391
Wichita Falls I Enterprises, LLC
$5.2M
Facility $5.2M
TX AVG $8.4M
Rank #249 / 304
$3.4M
Facility $3.4M
TX AVG $3.5M
Rank #251 / 304
64.5%
Facility 64.5%
TX AVG 47%
Rank #164 / 304
455916
Nexion Midwestern Healthcare Center
NH
Wichita Falls (601)
121
Facility 121
TX AVG 80
Rank #205 / 988
61.2%
Facility 61.2%
TX AVG 63.5%
Rank #191 / 304
-4%
4.63
Facility 4.63
TX AVG 3.63
Rank #44 / 296
-10%+28%
$29.9k
Facility $29.9k
TX AVG $81.8k
Rank #177 / 301
32
Facility 32
TX AVG 25.9
Rank #230 / 299
5.3
Facility 5.3
TX AVG 3.7
Rank #274 / 299
373-
6
Facility 6
TX AVG 41
Rank #1286 / 1391
Decatur Hospital Authority
$6.1M
Facility $6.1M
TX AVG $8.4M
Rank #254 / 304
$3.8M
Facility $3.8M
TX AVG $3.5M
Rank #207 / 304
62%
Facility 62%
TX AVG 47%
Rank #41 / 304
675128
The Pines at Rolling Meadows -
NH
AL
IL
MC
NC
Wichita Falls
22
Facility 22
TX AVG 80
Rank #800 / 988
52.7%
Facility 52.7%
TX AVG 63.5%
Rank #238 / 304
-17%------------
50
Facility 50
TX AVG 41
Rank #515 / 1391
Wichita Falls Retirement Foundation
$8.4M
Facility $8.4M
TX AVG $8.4M
Rank #149 / 304
$4.6M
Facility $4.6M
TX AVG $3.5M
Rank #167 / 304
54.9%
Facility 54.9%
TX AVG 47%
Rank #194 / 304
676203

Financial Assistance for
Nursing Home in Texas

Texhoma Christian Care Center for Alzheimer‘s and Dementia is located in Wichita Falls, Texas.
Here are the financial assistance programs available to residents in Texas.

Get Financial aid guidance

Community Care for the Aged and Disabled (CCAD)

TX Medicaid CCAD

Age 65+ or disabled
General Texas resident, Medicaid-eligible, care need (not always nursing home level).
Income Limits (2025) ~$2,829/month 300% FBR, individual
Asset Limits $2,000 (individual), $3,000 (couple).
TX

Large state; rural access challenges.

Benefits
Personal care (5-7 hours/day) Respite (240 hours/year) Adult day care (~$60/day) Home aides

Texas Community Care Services

TX CCS

Age 60+
General Texas resident, at risk of decline.
Income Limits ~$2,000/month individual, varies
Asset Limits $5,000 individual
TX

Limited funding; high demand in urban areas.

Benefits
In-home care (3-5 hours/week) Respite (up to 10 days/year) Transportation (~5 trips/month)

Area Agency on Aging (AAA) Services

Texas AAA Services

Age 60+
General TX resident; no income/asset limits.
Income Limits (2025) None; donations encouraged.
Asset Limits Not assessed.
TX

28 AAAs; includes Meals on Wheels in some areas.

Benefits
Meals (~$5-$7/meal) Transportation Homemaker services (~4 hours/week) Respite (~5 days/year) Legal aid

Medicare Savings Program (MSP)

Texas Medicare Savings Program

Age 65+ or disabled
General TX resident, Medicare Part A/B.
Income Limits (2025) ~$2,510/month (QMB), ~$3,380/month (SLMB), ~$3,598/month (QI)—individual.
Asset Limits $9,430 (individual), $14,130 (couple).
TX

Includes Extra Help for Part D; no waitlist.

Benefits
Covers Part B premiums ($174.70/month) Deductibles ($240/year) Copays (~20%)

Family Caregiver Support Program (FCSP)

Texas Family Caregiver Support Program

Age
General Caregivers of 60+ needing care or 55+ caregivers of others; TX resident; 2+ ADLs.
Income Limits (2025) No strict cap; prioritizes low-income ~$24,980/year
Asset Limits Not assessed.
TX

High rural demand; includes grandparent caregivers.

Benefits
Respite (4-6 hours/week or 5 days/year) Adult day care ($60/day) Training Supplies (~$500/year)

VA Aid and Attendance (A&A) and Housebound Benefits

Texas VA Aid and Attendance/Housebound

Age 65+ or disabled veteran/spouse
General TX resident, wartime service, ADL help (A&A) or homebound.
Income Limits (2025) Net income < ~$1,984/month (veteran with dependent, A&A); pension offsets income.
Asset Limits ~$155,356 net worth
TX

High veteran population; supports rural/urban needs.

Benefits
Cash (~$1,433-$2,642/month veteran, ~$951-$1,318 spouse) for care costs

Property Tax Exemption for Seniors

Texas Senior Property Tax Exemption

Age 65+
General TX resident, homeowner (homestead).
Income Limits (2025) None; tax-based eligibility.
Asset Limits Not assessed.
TX

$25,000+ exemption; optional freeze in some counties; saves ~$500-$1,000/year.

Benefits
Tax exemption or freeze (~$500-$1,000/year savings)

Senior Farmers’ Market Nutrition Program (SFMNP)

Texas SFMNP

Age 60+
General TX resident, low-income.
Income Limits (2025) ~$2,322/month 185% FPL
Asset Limits Not assessed.
TX

Vouchers (~$50/season); serves ~20,000 via 28 AAAs.

Benefits
Vouchers (~$50/season) for produce at farmers’ markets

Frequently Asked Questions about Texhoma Christian Care Center for Alzheimer‘s and Dementia

Is Texhoma Christian Care Center for Alzheimer‘s and Dementia in a walkable area?

Texhoma Christian Care Center for Alzheimer‘s and Dementia has a walk score of 8. Car-dependent. Most errands require a car, with limited nearby walkable options.

What is the occupancy rate at Texhoma Christian Care Center for Alzheimer‘s and Dementia?

Texhoma Christian Care Center for Alzheimer‘s and Dementia's occupancy is 46.8%.

Does Texhoma Christian Care Center for Alzheimer‘s and Dementia operate as a for-profit or non-profit?

Texhoma Christian Care Center for Alzheimer‘s and Dementia is registered as a non-profit.

Are there photos of Texhoma Christian Care Center for Alzheimer‘s and Dementia?

Yes — there are 7 photos of Texhoma Christian Care Center for Alzheimer‘s and Dementia in the photo gallery on this page.

What is the address of Texhoma Christian Care Center for Alzheimer‘s and Dementia?

Texhoma Christian Care Center for Alzheimer‘s and Dementia is located at 300 Tx-11 Loop, Wichita Falls, TX 76306.

What is the phone number of Texhoma Christian Care Center for Alzheimer‘s and Dementia?

(940) 723-8420 will put you in contact with the team at Texhoma Christian Care Center for Alzheimer‘s and Dementia.

Is Texhoma Christian Care Center for Alzheimer‘s and Dementia Medicare or Medicaid certified?

Yes — Texhoma Christian Care Center for Alzheimer‘s and Dementia is a CMS-certified provider of Medicare and Medicaid.

Guides for Better Senior Living

Care Cost Calculator: See Prices in Your Area

Nursing Home Data Explorer

Don’t Wait Too Long: 7 Red Flag Signs Your Parent Needs Assisted Living Now

The True Cost of Assisted Living in 2025 – And How Families Are Paying For It

Understanding Senior Living Costs: Pricing Models, Discounts & Financial Assistance