


Agape Living Assisted Living
Assisted Living & Memory Care · Silver Spring, MD
Agape Living Assisted Living
Assisted Living & Memory Care · Silver Spring, MD
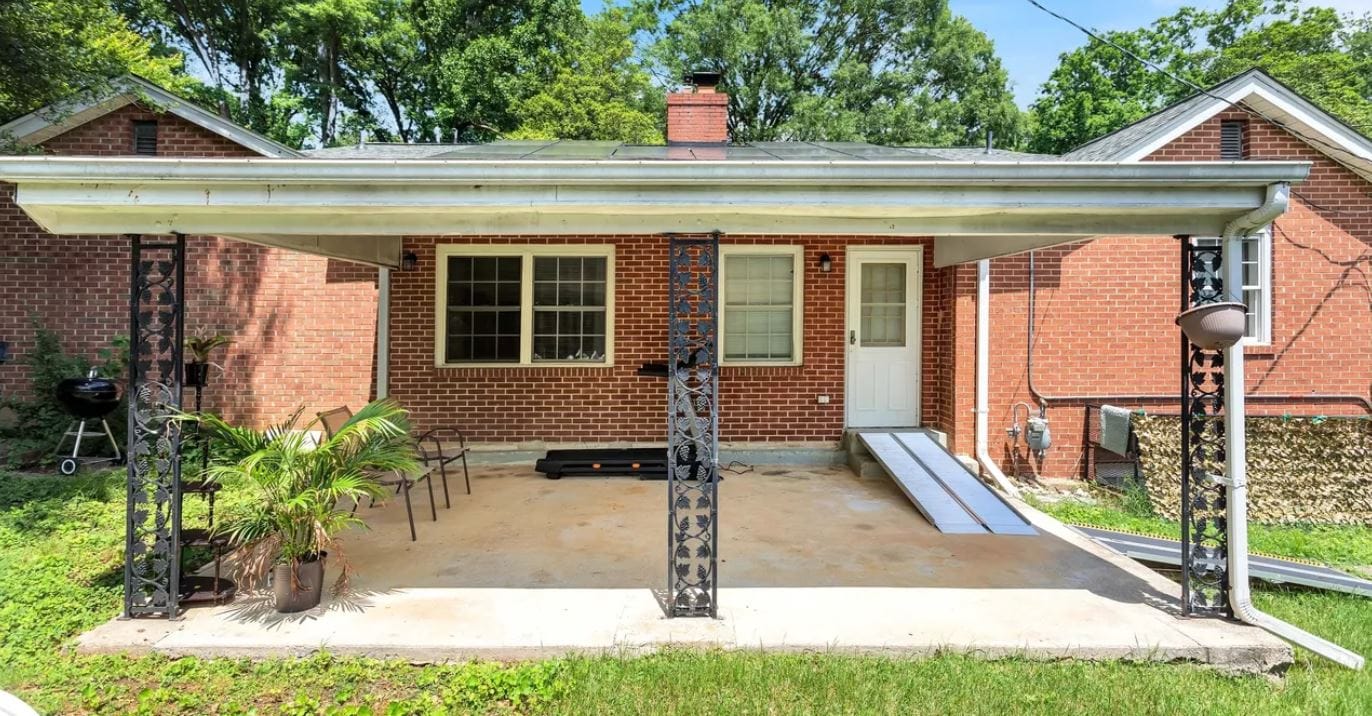
Spend your golden years doing what you love with Agape Living Assisted Living, a prominent senior living community located in the serene Cresthaven Drive, Silver Spring, MD, that specializes in assisted living. The community goes above and beyond to provide the right care for seniors’ various needs with different levels of care and assistance. Agape Living Assisted Living also offers medication management and memory care to ensure residents are well-cared for.
Understanding seniors at a deeper level allows the community to provide them with a care plan that best matches their needs and aspirations. Moreover, residents may explore new interests and relive old hobbies with a robust calendar of activities and programs. Agape Living Assisted Living promotes a lively and inviting environment for seniors to live without worries and make a more meaningful retirement.
5-bed community Rank #424 / 685Bed count — State benchmarkedThis home is ranked 424th out of 685 homes in Maryland for bed count. Shows this facility's certified or reported bed count compared to other Maryland facilities. Larger communities may offer more amenities, programs, and on-site services for residents and families.Facilities with the same value for a metric share the same rank. Rankings are based only on facilities in Maryland that report data for that category. Facilities without available data are excluded from the ranking.Click the rank badge to see the full State ranking.Click here to see the full State ranking.
A smaller, more intimate setting that may offer a quieter environment and closer staff-resident interactions.
Walk Score: 29 / 100 Rank #638 / 985Walk Score — State benchmarkedThis home is ranked 638th out of 985 homes in Maryland for walk score. Shows how walkable this facility's neighborhood is compared to the average walk score across Maryland facilities. Higher scores benefit residents, families, and staff.Facilities with the same value for a metric share the same rank. Rankings are based only on facilities in Maryland that report data for that category. Facilities without available data are excluded from the ranking.Click the rank badge to see the full State ranking.Click here to see the full State ranking.
Somewhat walkable. A few nearby services may be reachable on foot, but most trips require transportation.
About this community
Facility TypeAssisted Living
CountyPrince George's
Licensed Nurses/CNAs
No mild Alzheimer's level
No moderate Alzheimer's level
No severe Alzheimer's level
Low Level Of Care
Moderate Level Of Care
High Level Of Care
Specific ProgramsSpecialized memory care programs, Family engagement
What does this home offer?
No pets allowed
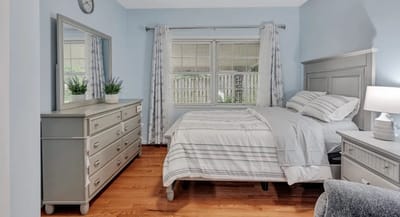
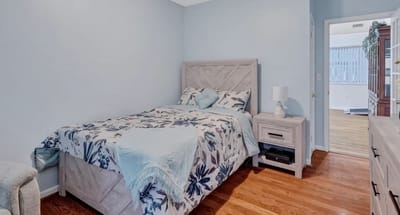
Housing Options: Private Rooms
Building Type: Single-story
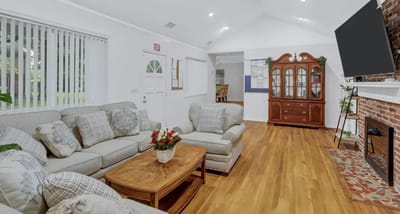
Social and Recreational Activities

Health Programs
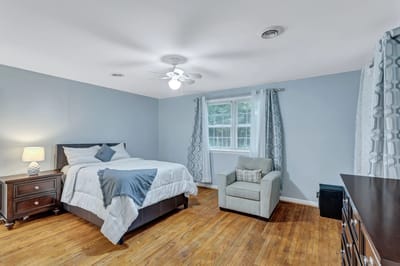
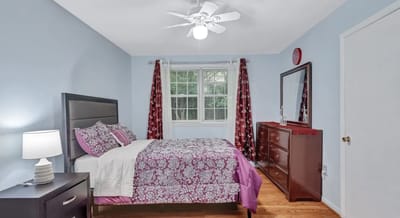
Type of Rooms Available
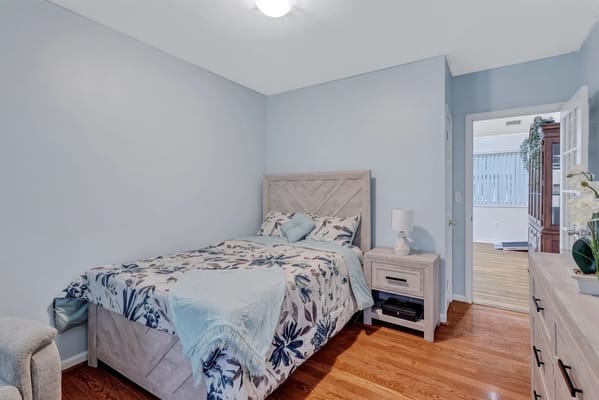

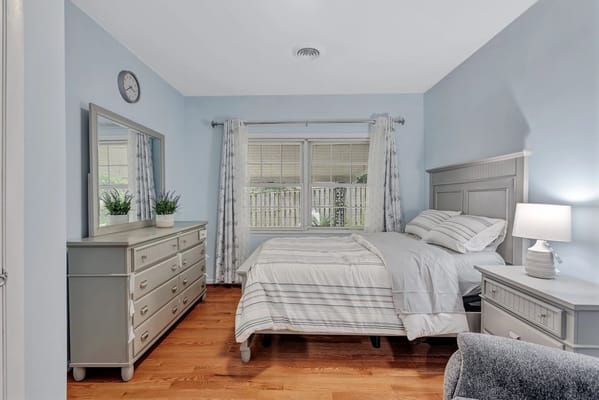
1 / 4
Private Rooms
Places of interest near Agape Living Assisted Living
![]() 3.3 miles from city center
3.3 miles from city center
![]() Estimated distance in miles from Silver Spring's city center to Agape Living Assisted Living's address, calculated via Google Maps.
Estimated distance in miles from Silver Spring's city center to Agape Living Assisted Living's address, calculated via Google Maps.
Calculate Travel Distance to Agape Living Assisted Living
Add your location
Compare Assisted Living around Silver Spring
Info below is compiled from the MD Dept. of Health (OHCQ), senior community websites & trusted data sources such as Walk Score & BBB.
Communities are listed from highest to lowest based on our ranking methodology.
| Riderwood Village | AL IL MC | Silver Spring | 275
Facility
275
MD AVG
42
Rank
#3 / 685 | Yes |
33
Facility
33
MD AVG
43
Rank
#597 / 985 | - | 23
Facility
23
MD AVG
21
Rank
#101 / 210 |
29% Male Residents — State Benchmarked 29% of residents are male, compared to the Maryland average of 31%. This facility caters to a majority female resident pool (71% female), consistent with the broader assisted living trend where women significantly outnumber men. |
71% Female Residents — State Benchmarked 71% of residents are female, compared to the Maryland average of 69%. Women comprise the large majority, consistent with national assisted living demographics where women live longer and enter care facilities at higher rates. |
89% White Residents — State Benchmarked 89% of residents are reported as White, compared to the Maryland average of 81%. Close to the average for this category among assisted living facilities in Maryland with reported race/ethnicity data. |
7% African American Residents — State Benchmarked 7% of residents are reported as African American or Black, compared to the Maryland average of 13%. In line with the Maryland average for African American residents among facilities reporting this breakdown. |
4% Other Ethnicity Residents — State Benchmarked 4% of residents fall into categories other than White or African American (combined), compared to the Maryland average of 6%. This column aggregates Hispanic, Asian, multiracial, and any other labeled groups that are not classified as White or African American. Reported subgroups in this total: Asian (3%), Hispanic (0%). |
2% Residents Age 65–74 — State Benchmarked 2% of residents are 65–74, compared to the Maryland average of 13%. Fewer younger seniors suggests the resident population skews older, likely requiring higher acuity care and more hands-on support. |
23% Residents Age 75–84 — State Benchmarked 23% of residents are 75–84, compared to the Maryland average of 31%. Below the state norm — the resident mix may skew either younger or older than this typical middle bracket. |
52% Residents Age 85–94 — State Benchmarked 52% of residents are 85–94, compared to the Maryland average of 44%. A high concentration of very elderly residents signals a higher-acuity facility with experience caring for advanced age-related needs. |
23% Residents Age 95+ — State Benchmarked 23% of residents are 95 or older, compared to the Maryland average of 16%. A high proportion of the oldest-old suggests strong end-of-life care experience and very-high-acuity capabilities. |
| Sunrise of Chevy Chase | AL MC | Silver Spring (Rock Creek Gardens) | 196
Facility
196
MD AVG
42
Rank
#10 / 685 | No |
71
Facility
71
MD AVG
43
Rank
#175 / 985 | Studio / 1 Bed / 2 Bed | 8
Facility
8
MD AVG
21
Rank
#164 / 210 |
58% Male Residents — State Benchmarked 58% of residents are male, compared to the Maryland average of 31%. An unusually high male share for assisted living, where most facilities skew heavily female. |
42% Female Residents — State Benchmarked 42% of residents are female, compared to the Maryland average of 69%. An unusually low female share — most assisted living facilities have 65–75% female residents. |
69% White Residents — State Benchmarked 69% of residents are reported as White, compared to the Maryland average of 81%. A lower White share than the Maryland average — the community may draw a more diverse resident mix relative to other facilities in Maryland. |
28% African American Residents — State Benchmarked 28% of residents are reported as African American or Black, compared to the Maryland average of 13%. A higher African American share than the typical Maryland average — useful context when comparing cultural fit and community composition. |
3% Other Ethnicity Residents — State Benchmarked 3% of residents fall into categories other than White or African American (combined), compared to the Maryland average of 6%. This column aggregates Hispanic, Asian, multiracial, and any other labeled groups that are not classified as White or African American. Reported subgroups in this total: Hispanic (2%), Asian (1%). |
12% Residents Age 65–74 — State Benchmarked 12% of residents are 65–74, compared to the Maryland average of 13%. In line with the statewide profile for this youngest senior bracket in assisted living. |
39% Residents Age 75–84 — State Benchmarked 39% of residents are 75–84, compared to the Maryland average of 31%. A high concentration in this mid-range bracket, where residents typically need moderate support with daily activities. |
42% Residents Age 85–94 — State Benchmarked 42% of residents are 85–94, compared to the Maryland average of 44%. This is typically the most common age bracket in assisted living — this facility is in line with the statewide norm. |
6% Residents Age 95+ — State Benchmarked 6% of residents are 95 or older, compared to the Maryland average of 16%. Most residents here have not yet reached the oldest-old bracket, suggesting a younger overall community. |
| Bedford Court, a CCRC | AL HOS IL MC NH RC SNF | Silver Spring (International Drive) | 76
Facility
76
MD AVG
42
Rank
#174 / 685 | Yes |
64
Facility
64
MD AVG
43
Rank
#261 / 985 | Studio / 1 Bed | 34
Facility
34
MD AVG
21
Rank
#22 / 210 |
15% Male Residents — State Benchmarked 15% of residents are male, compared to the Maryland average of 31%. This facility caters to a majority female resident pool (85% female), consistent with the broader assisted living trend where women significantly outnumber men. |
85% Female Residents — State Benchmarked 85% of residents are female, compared to the Maryland average of 69%. Women comprise the large majority, consistent with national assisted living demographics where women live longer and enter care facilities at higher rates. |
95% White Residents — State Benchmarked 95% of residents are reported as White, compared to the Maryland average of 81%. A higher White share than is typical for assisted living in Maryland in this dataset — compare with peer facilities for local context. |
3% African American Residents — State Benchmarked 3% of residents are reported as African American or Black, compared to the Maryland average of 13%. A lower African American share than is typical in Maryland; local markets still vary widely. |
2% Other Ethnicity Residents — State Benchmarked 2% of residents fall into categories other than White or African American (combined), compared to the Maryland average of 6%. This column aggregates Hispanic, Asian, multiracial, and any other labeled groups that are not classified as White or African American. Reported subgroups in this total: Asian (2%). |
2% Residents Age 65–74 — State Benchmarked 2% of residents are 65–74, compared to the Maryland average of 13%. Fewer younger seniors suggests the resident population skews older, likely requiring higher acuity care and more hands-on support. |
8% Residents Age 75–84 — State Benchmarked 8% of residents are 75–84, compared to the Maryland average of 31%. Below the state norm — the resident mix may skew either younger or older than this typical middle bracket. |
65% Residents Age 85–94 — State Benchmarked 65% of residents are 85–94, compared to the Maryland average of 44%. A high concentration of very elderly residents signals a higher-acuity facility with experience caring for advanced age-related needs. |
26% Residents Age 95+ — State Benchmarked 26% of residents are 95 or older, compared to the Maryland average of 16%. A high proportion of the oldest-old suggests strong end-of-life care experience and very-high-acuity capabilities. |
| Bedford Court | AL HOS IL MC NH RC SNF | Silver Spring (International Drive) | 76
Facility
76
MD AVG
42
Rank
#174 / 685 | Yes |
66
Facility
66
MD AVG
43
Rank
#240 / 985 | Studio / 1 Bed / 2 Bed | 34
Facility
34
MD AVG
21
Rank
#22 / 210 |
15% Male Residents — State Benchmarked 15% of residents are male, compared to the Maryland average of 31%. This facility caters to a majority female resident pool (85% female), consistent with the broader assisted living trend where women significantly outnumber men. |
85% Female Residents — State Benchmarked 85% of residents are female, compared to the Maryland average of 69%. Women comprise the large majority, consistent with national assisted living demographics where women live longer and enter care facilities at higher rates. |
95% White Residents — State Benchmarked 95% of residents are reported as White, compared to the Maryland average of 81%. A higher White share than is typical for assisted living in Maryland in this dataset — compare with peer facilities for local context. |
3% African American Residents — State Benchmarked 3% of residents are reported as African American or Black, compared to the Maryland average of 13%. A lower African American share than is typical in Maryland; local markets still vary widely. |
2% Other Ethnicity Residents — State Benchmarked 2% of residents fall into categories other than White or African American (combined), compared to the Maryland average of 6%. This column aggregates Hispanic, Asian, multiracial, and any other labeled groups that are not classified as White or African American. Reported subgroups in this total: Asian (2%). |
2% Residents Age 65–74 — State Benchmarked 2% of residents are 65–74, compared to the Maryland average of 13%. Fewer younger seniors suggests the resident population skews older, likely requiring higher acuity care and more hands-on support. |
8% Residents Age 75–84 — State Benchmarked 8% of residents are 75–84, compared to the Maryland average of 31%. Below the state norm — the resident mix may skew either younger or older than this typical middle bracket. |
65% Residents Age 85–94 — State Benchmarked 65% of residents are 85–94, compared to the Maryland average of 44%. A high concentration of very elderly residents signals a higher-acuity facility with experience caring for advanced age-related needs. |
26% Residents Age 95+ — State Benchmarked 26% of residents are 95 or older, compared to the Maryland average of 16%. A high proportion of the oldest-old suggests strong end-of-life care experience and very-high-acuity capabilities. |
| Agape Living Assisted Living | AL MC | Silver Spring | 5
Facility
5
MD AVG
42
Rank
#424 / 685 | No |
29
Facility
29
MD AVG
43
Rank
#638 / 985 | Private Rooms | - | - | - | - | - | - | - | - | - | - |
Financial Assistance for
Assisted Living in Maryland
Agape Living Assisted Living is located in Silver Spring, Maryland.
Here are the financial assistance programs available to residents in Maryland.
Frequently Asked Questions about Agape Living Assisted Living
Is Agape Living Assisted Living in a walkable area?
Agape Living Assisted Living has a walk score of 29. Somewhat walkable. A few nearby services may be reachable on foot, but most trips require transportation.
Are pets allowed at Agape Living Assisted Living?
No, Agape Living Assisted Living has a no-pet policy.
How many beds does Agape Living Assisted Living have?
Agape Living Assisted Living has 5 beds.
Are there photos of Agape Living Assisted Living?
Yes — there are 6 photos of Agape Living Assisted Living in the photo gallery on this page.
What is the address of Agape Living Assisted Living?
Agape Living Assisted Living is located at 1300 Cresthaven Dr, Silver Spring, MD 20903.
What is the phone number of Agape Living Assisted Living?
(301) 328-0085 will put you in contact with the team at Agape Living Assisted Living.
What county is Agape Living Assisted Living located in?
Agape Living Assisted Living is in Prince George's County.
Guides for Better Senior Living
Care Cost Calculator: See Prices in Your Area
Assisted Living Explorer
Don’t Wait Too Long: 7 Red Flag Signs Your Parent Needs Assisted Living Now
The True Cost of Assisted Living in 2025 – And How Families Are Paying For It
Understanding Senior Living Costs: Pricing Models, Discounts & Financial Assistance
Updated on
