Fernbrook Manor
Assisted Living & Memory Care · Odenton, MD

Fernbrook Manor

Assisted Living & Memory Care · Odenton, MD

Overview of Fernbrook Manor

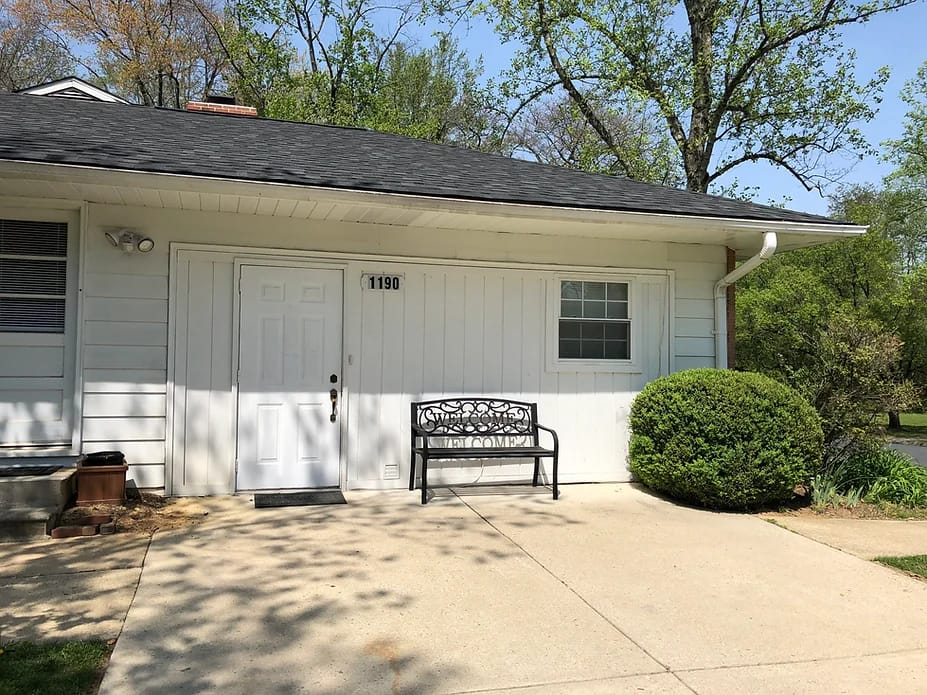
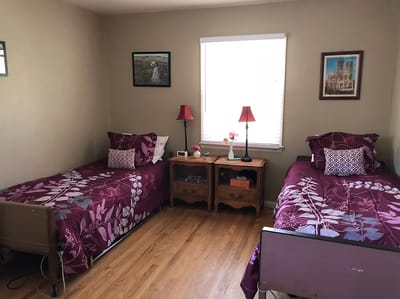
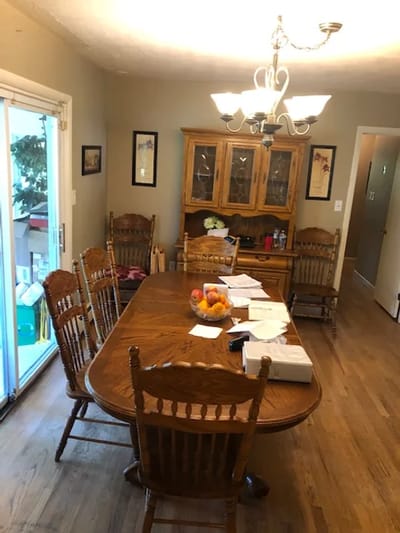
Fernbrook Manor is a tightly-knit elder care home that provides healthcare services.  The center boasts a modest, warm, and welcoming atmosphere for its residents. The home-like atmosphere creates a comfortable and well-managed resident-focused senior assisted living environment.

Fernbrook Manor provides comprehensive services that have a proportionate staff-to-resident ratio, with an activity director on-site, physician visits, a podiatrist, and a hairdresser available. Essential amenities include housekeeping, laundry, medication management, nutritional meals served daily, transportation services, and stimulating assisted living activities planned.

By The Numbers

Community insights.

Bed count Info A smaller, more intimate setting that may offer a quieter environment and closer staff-resident interactions. 14 Rank #282 / 684Bed count — State benchmarkedThis home is ranked 282nd out of 684 homes we track in Maryland for bed count. Shows this facility's certified or reported bed count compared to other Maryland facilities. Larger communities may offer more amenities, programs, and on-site services for residents and families.Communities with the same value for a metric share the same rank. Rankings cover every community we track in Maryland that reports data for that category. Communities without available data are excluded, so the pool size varies from metric to metric.Click the rank badge to see the full State ranking.Click here to see the full State ranking.

Smaller home · May offer a more intimate, personalized care environment.

Years of operating Info A longer operating history, which may indicate experience navigating regulations and delivering ongoing care. Rank #12 / 210Years in operation — State benchmarkedThis home is ranked 12th out of 210 homes we track in Maryland for years in operation. Shows how long this facility has been in operation compared to other Maryland facilities. Longer operating histories may benefit residents, families, and staff.Communities with the same value for a metric share the same rank. Rankings cover every community we track in Maryland that reports data for that category. Communities without available data are excluded, so the pool size varies from metric to metric.Click the rank badge to see the full State ranking.Click here to see the full State ranking.
39 years
Walk Score Info Somewhat walkable. A few nearby services may be reachable on foot, but most trips require transportation. Rank #474 / 953Walk Score — State benchmarkedThis home is ranked 474th out of 953 homes we track in Maryland for walk score. Shows how walkable this facility's neighborhood is compared to the average walk score across Maryland facilities. Higher scores benefit residents, families, and staff.Communities with the same value for a metric share the same rank. Rankings cover every community we track in Maryland that reports data for that category. Communities without available data are excluded, so the pool size varies from metric to metric.Click the rank badge to see the full State ranking.Click here to see the full State ranking.
45 / 100

About this community

License Details

Facility TypeSole Proprietorship
CountyAnne Arundel

Room costs

Semi-Private Room $70 - $75 per day

Hospice Affiliations

Amedisys Hospice of Greater Chesapeake

Memory & Specialized Care

3 services
Mild Alzheimer's Level
Moderate Alzheimer's Level
Severe Alzheimer's Level

Contact Fernbrook Manor

Demographics

Resident demographic information for this facility.

Gender

  • Female 40%
  • Male 60%

Age Distribution

  • 65-74 60%
  • 75-84 20%
  • 85-94 10%
  • ≤64 10%

Ethnicity

  • White 90%
  • Hispanic 10%

Infection Prevention & Vaccination

How this facility protects residents through staff vaccination policies and immunization practices.

Influenza Gold Star

Awarded by the Maryland Health Care Commission (MHCC) to healthcare facilities that achieve a high influenza vaccination rate.

Mandatory Vaccination Policy

The facility requires certain vaccinations for staff as part of its infection prevention measures.

Mandatory COVID Policy

The facility requires COVID-19 vaccination for staff.

What does this home offer?

Pets allowed icon
Pets allowed icon

Pets Allowed

Building type icon
Building type icon

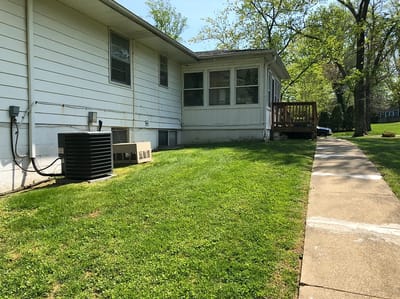
Building Type: Single-story

Transportation services icon

Transportation Services

Fitness and recreation icon

Fitness and Recreation

Places of interest near Fernbrook Manor

Address 1.2 miles from city center Info Estimated distance in miles from Odenton's city center to Fernbrook Manor's address, calculated via Google Maps. — 10.13 miles to nearest hospital (Fresenius Medical Care at Anne Arundel Medical Center)

Calculate Travel Distance to Fernbrook Manor

Add your location

Address

Compare Assisted Living around Odenton

Info below is compiled from the MD Dept. of Health (OHCQ), senior community websites & trusted data sources such as Walk Score & BBB.

Communities are listed from highest to lowest based on our ranking methodology.

Care Types in This Table AL (Assisted Living): Housing with help for daily activities like bathing, dressing, and medication, without 24-hour skilled nursing. NH (Nursing Home): 24/7 skilled nursing care for residents with complex, ongoing medical needs. SNF (Skilled Nursing Facility): Round-the-clock nursing care, often for recovery after surgery, injury, or illness. MC (Memory Care): Secured, specialized care for people living with Alzheimer's or dementia. RC (Respite Care): Short-term temporary care that gives family caregivers a break. HOS (Hospice Care): Comfort-focused care for those with a terminal illness, prioritizing quality of life over treatment.
City and state of the facility. Used for mapping and state-average comparisons.
Licensed bed capacity (maximum allowed). Not the same as how many beds are currently filled.
Indicates whether residents are allowed to have pets in the facility.
Third-party neighborhood walkability score (0–100). Convenience/context metric, not a healthcare quality measure.
Description of bed or unit types offered (e.g. assisted living, memory care), as reported in state or facility disclosures.
Number of years the company has been in operation.
Better Business Bureau grade for the operating company. Reflects complaint handling and business practices, not clinical care quality.
Percentage of residents reported as male in state demographics, shown as a whole-number percent.
Percentage of residents reported as female in state demographics, shown as a whole-number percent.
Share of residents reported as White in the state-published race/ethnicity breakdown for this facility, shown as a whole-number percent. Parsed from the same source as the profile demographics section.
Share of residents reported as African American or Black in the state breakdown, shown as a whole-number percent. Labels in the raw data are normalized to this bucket for compare.
Combined share of all race/ethnicity groups that are not classified as White or African American (e.g. Hispanic, Asian, multiracial, and other labeled categories), summed to a single whole-number percent.
Share of residents aged 65–74 in reported demographics, as a whole-number percentage of residents.
Share of residents aged 75–84 in reported demographics, as a whole-number percentage of residents.
Share of residents aged 85–94 in reported demographics, as a whole-number percentage of residents.
Share of residents aged 95 or older in reported demographics, as a whole-number percentage of residents.
Arbor Terrace Waugh Chapel
AL
MC
Gambrills (Waugh Chapel Towne Centre)
96
Facility 96
MD AVG 42
Rank #130 / 684
Yes
47
Facility 47
MD AVG 45
Rank #458 / 953
Studio / 1 Bed / 2 Bed
4
Facility 4
MD AVG 21
Rank #197 / 210
A+
30%

Male Residents — State Benchmarked 30% of residents are male, compared to the Maryland average of 31%. This facility caters to a majority female resident pool (70% female), consistent with the broader assisted living trend where women significantly outnumber men.

70%

Female Residents — State Benchmarked 70% of residents are female, compared to the Maryland average of 69%. Women comprise the large majority, consistent with national assisted living demographics where women live longer and enter care facilities at higher rates.

86%

White Residents — State Benchmarked 86% of residents are reported as White, compared to the Maryland average of 81%. Close to the average for this category among assisted living facilities in Maryland with reported race/ethnicity data.

12%

African American Residents — State Benchmarked 12% of residents are reported as African American or Black, compared to the Maryland average of 13%. In line with the Maryland average for African American residents among facilities reporting this breakdown.

3%

Other Ethnicity Residents — State Benchmarked 3% of residents fall into categories other than White or African American (combined), compared to the Maryland average of 6%. This column aggregates Hispanic, Asian, multiracial, and any other labeled groups that are not classified as White or African American. Reported subgroups in this total: Asian (1%), Hawaiian/Pacific Islander (1%).

10%

Residents Age 65–74 — State Benchmarked 10% of residents are 65–74, compared to the Maryland average of 13%. Fewer younger seniors suggests the resident population skews older, likely requiring higher acuity care and more hands-on support.

43%

Residents Age 75–84 — State Benchmarked 43% of residents are 75–84, compared to the Maryland average of 31%. A high concentration in this mid-range bracket, where residents typically need moderate support with daily activities.

39%

Residents Age 85–94 — State Benchmarked 39% of residents are 85–94, compared to the Maryland average of 44%. This is typically the most common age bracket in assisted living — this facility is in line with the statewide norm.

8%

Residents Age 95+ — State Benchmarked 8% of residents are 95 or older, compared to the Maryland average of 16%. Most residents here have not yet reached the oldest-old bracket, suggesting a younger overall community.

Arcadia of Denton II
AL
MC
NH
RC
SNF
Denton
16
Facility 16
MD AVG 42
Rank #245 / 684
Yes
49
Facility 49
MD AVG 45
Rank #430 / 953
-
5
Facility 5
MD AVG 21
Rank #185 / 210
-
38%

Male Residents — State Benchmarked 38% of residents are male, compared to the Maryland average of 31%. This facility caters to a majority female resident pool (62% female), consistent with the broader assisted living trend where women significantly outnumber men.

62%

Female Residents — State Benchmarked 62% of residents are female, compared to the Maryland average of 69%. Closer to an even gender split than most assisted living facilities, which typically have 65–75% female residents.

100%

White Residents — State Benchmarked 100% of residents are reported as White, compared to the Maryland average of 81%. A higher White share than is typical for assisted living in Maryland in this dataset — compare with peer facilities for local context.

0%

African American Residents — State Benchmarked 0% of residents are reported as African American or Black, compared to the Maryland average of 13%. A lower African American share than is typical in Maryland; local markets still vary widely.

0%

Other Ethnicity Residents — State Benchmarked 0% of residents fall into categories other than White or African American (combined), compared to the Maryland average of 6%. This column aggregates Hispanic, Asian, multiracial, and any other labeled groups that are not classified as White or African American.

8%

Residents Age 65–74 — State Benchmarked 8% of residents are 65–74, compared to the Maryland average of 13%. Fewer younger seniors suggests the resident population skews older, likely requiring higher acuity care and more hands-on support.

62%

Residents Age 75–84 — State Benchmarked 62% of residents are 75–84, compared to the Maryland average of 31%. A high concentration in this mid-range bracket, where residents typically need moderate support with daily activities.

15%

Residents Age 85–94 — State Benchmarked 15% of residents are 85–94, compared to the Maryland average of 44%. The population here skews younger than the statewide norm, which may indicate a more active, lower-acuity community.

15%

Residents Age 95+ — State Benchmarked 15% of residents are 95 or older, compared to the Maryland average of 16%. In line with the statewide profile for the oldest resident bracket.

Fernbrook Manor
AL
MC
Odenton (Maple Ridge)
14
Facility 14
MD AVG 42
Rank #282 / 684
Yes
45
Facility 45
MD AVG 45
Rank #474 / 953
-
39
Facility 39
MD AVG 21
Rank #12 / 210
-
60%

Male Residents — State Benchmarked 60% of residents are male, compared to the Maryland average of 31%. An unusually high male share for assisted living, where most facilities skew heavily female.

40%

Female Residents — State Benchmarked 40% of residents are female, compared to the Maryland average of 69%. An unusually low female share — most assisted living facilities have 65–75% female residents.

90%

White Residents — State Benchmarked 90% of residents are reported as White, compared to the Maryland average of 81%. A higher White share than is typical for assisted living in Maryland in this dataset — compare with peer facilities for local context.

0%

African American Residents — State Benchmarked 0% of residents are reported as African American or Black, compared to the Maryland average of 13%. A lower African American share than is typical in Maryland; local markets still vary widely.

10%

Other Ethnicity Residents — State Benchmarked 10% of residents fall into categories other than White or African American (combined), compared to the Maryland average of 6%. This column aggregates Hispanic, Asian, multiracial, and any other labeled groups that are not classified as White or African American. Reported subgroups in this total: Hispanic (10%).

60%

Residents Age 65–74 — State Benchmarked 60% of residents are 65–74, compared to the Maryland average of 13%. A higher share of younger seniors often signals a more independent, active resident community with lower acuity care needs.

20%

Residents Age 75–84 — State Benchmarked 20% of residents are 75–84, compared to the Maryland average of 31%. Below the state norm — the resident mix may skew either younger or older than this typical middle bracket.

10%

Residents Age 85–94 — State Benchmarked 10% of residents are 85–94, compared to the Maryland average of 44%. The population here skews younger than the statewide norm, which may indicate a more active, lower-acuity community.

-
Royal Assisted Living Inc
AL
Odenton (Bonaventure)
5
Facility 5
MD AVG 42
Rank #423 / 684
No
62
Facility 62
MD AVG 45
Rank #285 / 953
---
0%

Male Residents — State Benchmarked 0% of residents are male, compared to the Maryland average of 31%. This facility caters to a majority female resident pool (100% female), consistent with the broader assisted living trend where women significantly outnumber men.

0%

Female Residents — State Benchmarked 0% of residents are female, compared to the Maryland average of 69%. An unusually low female share — most assisted living facilities have 65–75% female residents.

-------
Arcadia of Crofton I (Formerly Autumn Meadows)
AL
HOS
MC
NH
RC
SNF
Gambrills-No
38
Facility 38
MD AVG 45
Rank #542 / 953
Private Rooms-----------

Financial Assistance for
Assisted Living in Maryland

Fernbrook Manor is located in Odenton, Maryland.
Here are the financial assistance programs available to residents in Maryland.

Get Financial aid guidance

Community Options Waiver

Maryland Medicaid Community Options Waiver

Age 65+ or disabled
General Maryland resident, Medicaid- eligible, nursing home-level care need.
Income Limits (2025) ~$2,829/month 300% FBR, individual
Asset Limits $2,000 (individual), $3,000 (couple) (excludes home, car).
MD

High urban demand; rural outreach efforts.

Benefits
Personal care (5-7 hours/day, e.g., bathing, dressing) Respite care (up to 240 hours/year) Adult day care ($70/day) Home modifications ($1,500 avg.)

Senior Care Program

Maryland Senior Care

Age 65+
General Maryland resident, at risk of nursing home placement.
Income Limits ~$2,000/month individual, varies by county
Asset Limits $11,000 individual
MD

Limited funding; waitlists common in high-demand areas.

Benefits
In-home care (3-5 hours/week) Respite care (up to 10 days/year) Meals (~$6/meal) Transportation (~5 trips/month) Case management

Maryland Nursing Home Medicaid

Maryland Medical Assistance (Medicaid) Nursing Home Program

Age 65+
General Maryland resident, Medicaid-eligible, requires nursing home-level care.
Income Limits (2025) $943/month (individual); most income applied to care costs.
Asset Limits $2,500 (individual), $3,000 (couple); spousal protections up to $155,356.
MD

Home equity limit $636,000; estate recovery applies post-55.

Benefits
24/7 nursing care Meals Therapy Medications (unlimited per medical need)

Senior Assisted Living Subsidy Program

Maryland Senior Assisted Living Group Home Subsidy

Age 62+
General Maryland resident, in or moving to approved assisted living, low/moderate income.
Income Limits (2025) ~$34,000/year individual, varies by county
Asset Limits Not strict; prioritizes low-income.
MD

Not available statewide; facility must be licensed by MDH.

Benefits
Personal care Meals 24-hour supervision (up to $1,500/month subsidy typical)

Veterans Aid and Attendance (A&A) Benefit

Maryland VA Aid and Attendance

Age
General Wartime veteran/spouse, age 65+ or disabled, needs ADL help, Maryland resident.
Income Limits (2025) Net income minus medical expenses < $1,984/month individual with A&A
Asset Limits $155,356 net worth limit
MD

High veteran population in suburban/rural areas.

Benefits
Cash benefit ($1,478-$2,471/month, varies by status) for care costs

Senior Prescription Drug Assistance Program (SPDAP)

Maryland Senior Prescription Drug Assistance Program

Age 65+
General Maryland resident (6+ months), Medicare Part D enrolled.
Income Limits (2025) $48,560/year individual, 300% FPL
Asset Limits None specified.
MD

Supplements Medicare Part D; annual enrollment required.

Benefits
Up to $40/month premium subsidy Reducing drug costs

Medicare Savings Programs (MSP)

Maryland Medicare Savings Programs

Age 65+
General Maryland resident, Medicare Part A/B enrollee.
Income Limits (2025) $2,014/month (QMB), $2,706/month (SLMB/QI, individual).
Asset Limits $9,090 (individual), $13,630 (couple).
MD

Includes QMB, SLMB, QI categories.

Benefits
Covers premiums (up to $174.70/month Part B) Co-pays Deductibles

Community Personal Assistance Services (CPAS)

Maryland Medicaid Community Personal Assistance Services

Age 65+
General Maryland resident, Medicaid-eligible, needs ADL assistance.
Income Limits (2025) $943/month (individual); spend-down available.
Asset Limits $2,500 (individual), $3,000 (couple).
MD

Consumer-directed option allows hiring family caregivers.

Benefits
Personal care (hours vary, typically 20-30/week) Chores Nurse supervision

Frequently Asked Questions about Fernbrook Manor

What neighborhood is Fernbrook Manor in?

Fernbrook Manor is in the Maple Ridge neighborhood of Odenton.

Is Fernbrook Manor in a walkable area?

Fernbrook Manor has a walk score of 45. Somewhat walkable. A few nearby services may be reachable on foot, but most trips require transportation.

How long has Fernbrook Manor been in business?

Fernbrook Manor has been operating for approximately 39 years, based on available licensing and registration records.

Are pets allowed at Fernbrook Manor?

Yes, Fernbrook Manor allows residents to bring their pets.

How many beds does Fernbrook Manor have?

Fernbrook Manor has 14 beds.

Are there photos of Fernbrook Manor?

Yes — there are 4 photos of Fernbrook Manor in the photo gallery on this page.

What is the address of Fernbrook Manor?

Fernbrook Manor is located at 1190 Monie Rd, Odenton, MD 21113.

Guides for Better Senior Living

Care Cost Calculator: See Prices in Your Area

Assisted Living Explorer

Don’t Wait Too Long: 7 Red Flag Signs Your Parent Needs Assisted Living Now

The True Cost of Assisted Living in 2025 – And How Families Are Paying For It

Understanding Senior Living Costs: Pricing Models, Discounts & Financial Assistance